3888
Intensity inhomogeneity correction of whole body fat-water images using fat and water fraction information on a 3T PET/MR scanner1Radiology, Uppsala University, Uppsala, Sweden, 2Centre for Image Analysis, Uppsala University, Uppsala, Sweden, 3Medical Sciences, Uppsala University, Uppsala, Sweden, 4Applied Science Laboratory, GE Healthcare, Uppsala, Sweden, 5Antaros Medical, Mölndal, Sweden
Synopsis
We describe and evaluate a method for intensity non-uniformity correction of whole-body fat-water MR data acquired with both surface and body coils on a 3T PET/MRI system. The proposed method consists of two steps. Abrupt station intensity changes are first supressed, followed by correction of smooth intensity changes using fat and water fraction information. Visual and quantitative evaluations of 42 corrected fat-water datasets show that the method gives improved adipose and lean tissue uniformity for both surface and body coil acquisitions. This renders the data suitable for continued analysis in a whole-body imaging framework.
Purpose
Intensity non-uniformity (INU) is problematic in MR image evaluation, giving a smooth intensity variation (bias field, u) across the imaged subject. Correction methods proposed in the literature are often body-part specific and evaluated at 1.5T.1 Fat-water whole-body INU correction using adipose tissue as an internal reference has however previously been performed for fat quantification purposes.2
The aim of this work was to develop and evaluate a method for INU correction of whole-body 3T fat-water images acquired both with surface and body coils, using fat fraction (FF) and water fraction (WF) information. The purpose of the correction was further analysis in a whole-body imaging framework.3
Methods
Forty-two whole-body datasets were acquired using two Dixon sequences (Signa PET/MR, GE Healthcare); LAVA Flex using surface coils (TE/TR 1.73/3.93 ms, flip angle 12°, voxel size 2×2×4 mm) and MR attenuation correction (MRAC) using the body coil (TE/TR 1.67/4.05 ms, flip angle 5°, voxel size 2×2×5.2 mm). Ten stations per subject were scanned and subsequently stitched to form whole-body scans. Informed written consent was obtained from all subjects (local ethics committee approved).
The correction consisted of two steps using an in-house MATLAB procedure (R2016b, MathWorks Inc.). Abrupt station intensity changes were first suppressed; each slice in the fat and water images were normalized to the mean slice intensity in the summed fat-water image. Smooth intensity correction was then performed by estimating u using FF and WF information as described below (hereafter called fat and water correction, FWC), followed by division of the fat and water images with u.
1. Classify a voxel into either adipose or lean tissue if the voxel’s FF or WF, respectively, is >50%.
2. Calculate mean fat and water voxel intensities for voxels where the FF or WF, respectively, is >90%. Set image intensities for voxels classified in step 1 to these values.
3. Create a starting guess for u by dividing the original summed fat-water image with the summed image from step 2. This provides a good approximation for voxels with high fraction of adipose or lean tissue.
4. An estimation for all voxels is obtained by assuming small differences in u between adjacent voxels. This is formulated as an optimization problem, seeking u that simultaneously minimizes data (squared voxel-wise difference from the starting guess) and smoothness (sum of squares differences in the u-estimation between all adjacent voxels) terms. Data and smoothness term balance is determined from a voxel’s adipose or lean tissue content, indicating the starting guess degree of confidence. A globally optimal solution is found by solving a sparse system of linear equations.4
To assess the contribution from WF information, the correction was also performed with FF information only (hereafter called fat correction, FC).
Original and corrected whole-body scans were evaluated by (1) calculating the coefficient of variation (CV) of adipose and lean tissue compartments, (2) visual assessment of intensity histograms and (3) visual assessment of summed fat-water images. For the latter, a medical student with 6 months experience in fat-water image analysis was presented with blinded and randomly arranged movie clips of uncorrected, FC and FWC data. For each subject, the datasets were scored as A, B or C, where A and C represented the highest and lowest overall image uniformity, respectively.
Results
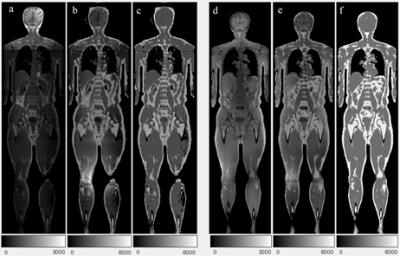
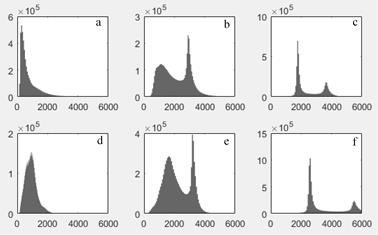
Due to fat-water swaps and a corrupted dataset, one LAVA Flex and three MRAC datasets were excluded. Representative original and corrected images, and the corresponding intensity histograms are shown in Figures 1 and 2, respectively. The corrections gave more uniform fat and water image appearances, and sharper peaks with clearer distinction between fat, water and background in the histograms. Increased image uniformity was also evident from the visual assessment of summed fat-water images (Table 1). The CVs of adipose and lean tissue compartments were reduced for corrected data (Table 2), with the overall smallest CVs measured for FWC. When incorporating WF information in the correction, the CV was in particular improved for the lean tissue compartment.Discussion
The described correction method gave improved adipose and lean tissue uniformity, both when assessed visually and with CVs. FWC gave the overall best homogeneity and histogram peak separation. The largest effect of the correction method was seen for the LAVA flex surface coil acquisition. The correction however gives a reduction in real intensity contrast and is dependent on the original images’ T1-weighting.Conclusion
INU correction using FF and WF information is effective in creating uniform data for surface and body coil fat-water 3T MR images. This renders the data suitable for continued analysis in a whole-body imaging framework.Acknowledgements
This work was partly funded by research grants from the Swedish Research Council, the Swedish Cancer Society and Antaros Medical.References
1. Belaroussi B, Milles J, Carme S, et al. Intensity non-uniformity correction in MRI: Existing methods and their validation, Medical Image Analysis. 2006;10:234-246.
2. Romu T, Borga M & Dahlqvist Leinhard O. MANA - multi scale adaptive normalized averaging. Proc. Int. Symp. Biomedical Imaging 2011:361-364.
3. Kullberg J, Johansson L, Lind L, et al. Imiomics: Bringing –omics to whole body imaging: Examples in cross sectional interaction between whole-body MRI and non-imaging data. In Proceedings of the 10th Annual Meeting of ISMRM, Toronto, Canada, 2015. Abstract 3431.
4. Grady L and Schwartz EL. Anisotropic interpolation on graphs: the combinatorial Dirichlet problem. Boston, US; Boston University Center for Adaptive Systems and Department of Cognitive and Neural Systems, Technical Report CAS/CNS-2003-014; 2003.
Figures


