3887
Atlas-based generation of synthesized transmission images for brain PETMR attenuation correction using MPRAGE1Biomedical Engineering, Stony Brook University, Stony Brook, NY, United States, 2Electrical and Computer Engineering, Stony Brook University, Stony Brook, NY, United States, 3Psychiatry, Stony Brook Medicine, Stony Brook, NY, United States, 4Radiology, Stony Brook Medicine, Stony Brook, NY, United States
Synopsis
Attenuation correction remains a challenge in simultaneous PETMR, as MR signal is not directly related to attenuation. This is particularly problematic in PETMR studies of the brain, where accurate radiotracer quantification is extremely important. Here, we present a method for generating individual-specific transmission data for attenuation correction from an input MPRAGE MR volume. The method uses an atlas of matched MPRAGE and transmission images in order to achieve this. Our method does not add to scan time, as do common MR-based methods, and directly yields attenuation data for PET energies, unlike CT-based methods.
PURPOSE
Attenuation correction (AC) is essential for accurate radiotracer quantification of PET data, especially for kinetic modeling using dynamic scans as often employed in research brain PETMR studies. As MR signal comes from protons and attenuation is determined by electron density, accurate AC remains a significant challenge in simultaneous PETMR. This is compounded in neuroimaging, where sharp boundaries between air and bone exist. Traditionally attenuation correction was performed using transmission images obtained with an external radioactive source with the same photon energy as PET (511keV). Whereas transmission is still considered the gold standard, the procedure has essentially been replaced by CT. CT-based AC requires interpolation to account for the different photon energies used in CT (~100keV), causing error in quantification. Current research endeavors in PETMR include the use of ultrashort-TE or zero-TE (UTE/ZTE) MRI, as well as the synthesis of individual-specific CT volumes for AC from atlases of matched MRI and CT volumes. Whereas these methods provide promising results, the common use of CT-based AC as gold standard is suboptimal. Here, we present a technique to synthesize individual-specific transmission images using MPRAGE MR images.METHODS
We assembled an atlas of eight pairs of matched MPRAGE and transmission images from our de-identified neuroimaging database. An additional pair was used as testing data set. All volumes were registered onto the testing data set using FLIRT1.
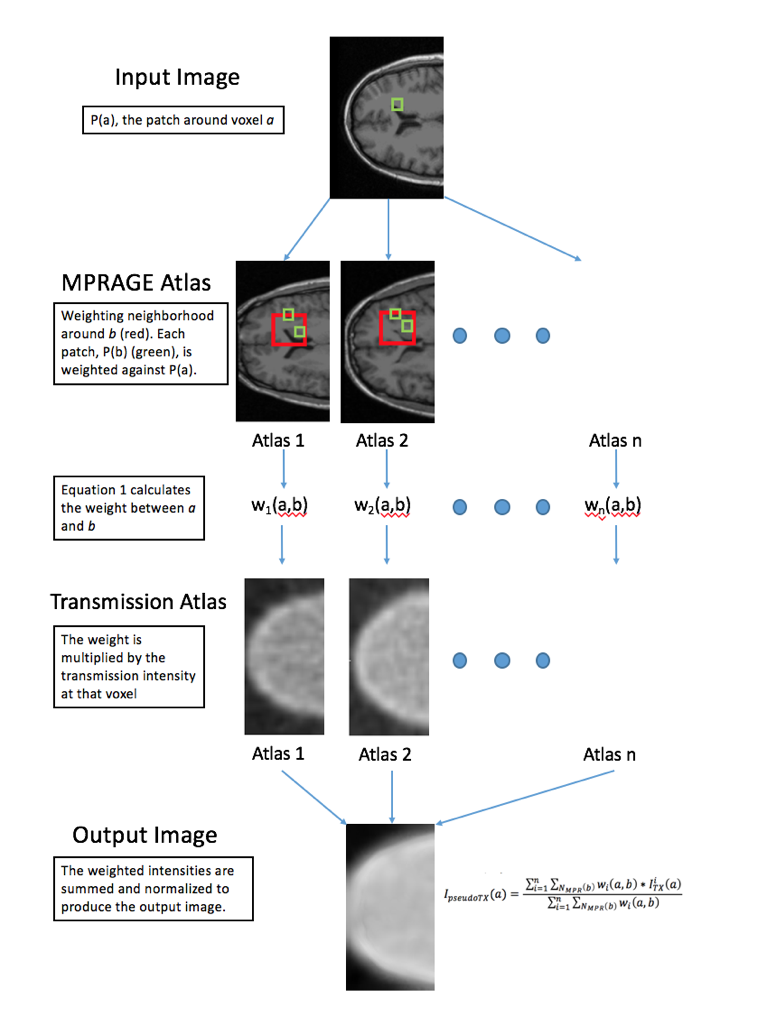
The synthesis algorithm uses patch-based weighting2, obviating the necessity for deformable registration3. For a patient $$$i$$$ in the atlas, weighting between voxel $$$b$$$ in that patient’s MPRAGE data and voxel $$$a$$$ in the input image is calculated as a function of the $$$L^{2}$$$ distances between the intensities $$$I_{Input}(a’)$$$ and $$$I_{MPR}(b’)$$$ of all voxels $$$a’,b’$$$ in a 3x3x3 patch, $$$P$$$, centered at $$$a$$$ and $$$b$$$ (Equation 1). To encapsulate the local similarity between the MPRAGE volumes, the weights between $$$a$$$ and all voxels in an 11x11x11 neighborhood, $$$N$$$, around $$$b$$$ are calculated (Equation 2). The final image $$$I_{pseudoTX}$$$ is constructed as a weighted combination of these groups.
$$ w_i(a,b)=f\Big(\sum_{P_{Input}(a)}\sum_{P_{Input}(b)}(I_{Input}(a')-I_{MPR}(b'))^2\Big) $$
$$Equation 1$$
$$ I_{pseudoTX}(a)=\frac{\sum_{i=1}^n\sum_{N_{MPR}(b)}w_i(a,b)*I_{TX}^{i}(a)}{\sum_{i=1}^n\sum_{N_{MPR}(b)}w_i(a,b)} $$
$$Equation 2$$
The accuracy of synthesized data is calculated in several ways: the mean and standard deviation of voxel-wise percent error between the synthesized and acquired (gold standard) transmission attenuation maps, along with their structural similarity index. The mean and standard deviation of voxel-wise percent error in the reconstructed images are also reported for a representative slice of [11C]-Way PET data reconstructed with both attenuation maps (ECAT HR+ scanner). PET data were reconstructed using filtered back projection.
RESULTS
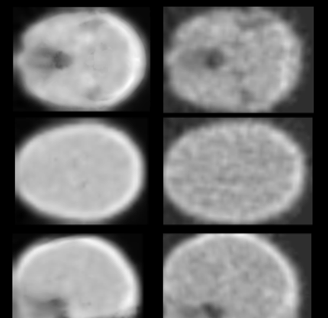
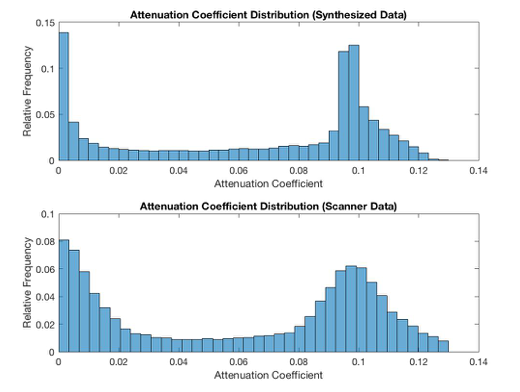
Figure 1 shows the gold standard and synthesized transmission images. The synthesized images are visually similar to the scanner-acquired transmission data. The synthesized transmission images are smoother, given the effects of weighting between several patients in the dictionary as well as incorporating patch-based weighting. This smoothness is perhaps best illustrated by Figure 2, which shows the normalized distribution of attenuation coefficients in both the real and synthesized data, where the attenuation peak associated with brain tissue is noticeably taller and narrower.
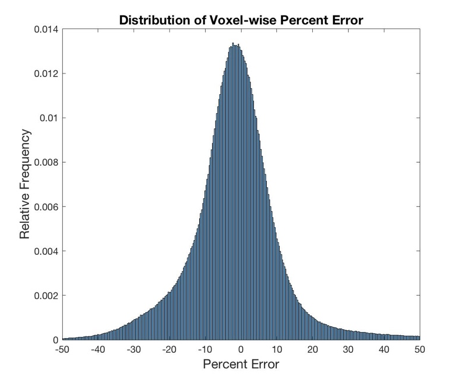
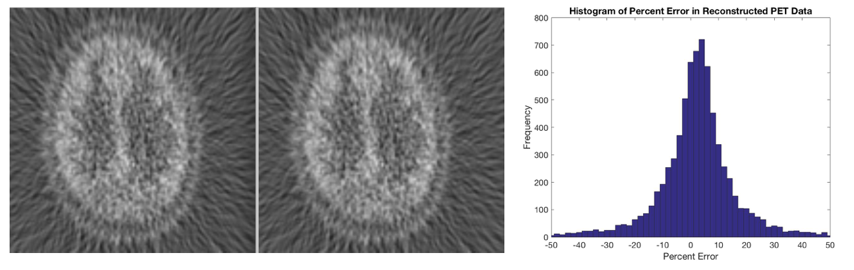
The mean percent error between the synthesized and gold standard attenuation data is -0.9%; the standard deviation of percent error in each voxel is 15.5% (Figure 3). The structural similarity index was calculated using the MATLAB Image Processing Toolbox as 0.9911, indicating good agreement between image features. Voxels outside of the head are excluded from the comparison. Figure 4 demonstrates the visual and quantitative similarity of one slice of the reconstructed PET images. The mean percent error is 2.1%, with a standard deviation of 13.3%.
DISCUSSION
Here we have demonstrated the feasibility of synthesizing transmission data using patch-based techniques. This approach does not suffer from the same drawbacks as the current state of the art: it does not require extra scan time as do UTE/ZTE-based methods, and directly yields attenuation coefficients for the energies employed in PET, unlike CT-based methods. The standard deviation seen in the percent errors, both between the attenuation maps themselves and the reconstructed PET images, could be considered relatively high, however, this is possibly due to noise in the gold standard data, along with the abundance of zero-valued attenuation outside of the head in the synthesized data (Figure 1) as opposed to direct limitations of the algorithm. Further study is needed to better validate the synthesized transmission.CONCLUSION
Synthesis of transmission data from T1 MRI data can be a useful tool for PET/MRI studies which seek to quantify radiotracer distribution. This method is robust, with the patch-based approach compensating for imperfect alignment of atlas images, as well as modest anatomical variation within the head.Acknowledgements
No acknowledgement found.References
1. FMRIB. http://fsl.fmrib.ox.ac.uk/fsl/fslwiki/FLIRT.
2. Torrado-Carvajal, A., et al., Fast patch-based pseudo-CT synthesis from T1-weighted MR images for PET/MR attenuation correction in brain studies. Journal of Nuclear Medicine, 2016. 57(1): p. 136-143.
3. Rousseau, F., P.A. Habas, and C. Studholme, A supervised patch-based approach for human brain labeling. IEEE transactions on medical imaging, 2011. 30(10): p. 1852-1862.
Figures