3882
Magnetic Resonance Fingerprinting for T1 and T2* quantification with Cartesian readout1Computer Assisted Clinical Medicine, Heidelberg University, Mannheim, Germany, 2Electrical and Computer Engineering, University of Minnesota, 3Center for Magnetic Resonance Research, University of Minnesota
Synopsis
Magnetic resonance fingerprinting (MRF) has shown exceptional promise for simultaneous quantification of T1 and T2, based on numerous spiral readouts. We propose an implementation of the MRF paradigm for quantitative imaging using spoiled echo-planar imaging (EPI) with Cartesian readout for simultaneous assessment of T1 and T2* within 10s. Joint T1 and T2* parameter-maps acquired in phantoms with the proposed MRF method are in good agreement with reference measurements and demonstrate high quality in-vivo. This approach offers a rapid supplement to the non-Cartesian MRF portfolio, with potentially increased usability and robustness.
Purpose
Quantification of relaxation parameters T1, T2 and T2* has long been a major research goal in order to facilitate inter-patient comparability and quantitative diagnosis1. Examples include T1 and T2* mapping to investigate the iron content in the brain of patients suffering from Huntington’s, Parkinson’s and Alzheimer’s disease2. Recently, an emerging technique, called magnetic resonance fingerprinting3 (MRF) has shown exceptional promise for the simultaneous, rapid and robust quantification of T1 and T2 based on spiral readout. In this study we present a sequence for acquiring MRF data based on spoiled EPI readouts for joint T1 and T2* quantification, as an alternative to balanced non-Cartesian imaging.Methods
The proposed MRF strategy (MRF-EPI) is based on the acquisition of a series of GE-EPI images with varying flip angles (FAs) and echo times (TEs) to enable the joint quantification of T1 and T2*. A single inversion pulse is applied followed by multiple EPI readouts (Figure 1a,b). The dictionary was generated by simulating the evolution of the magnetization based on Bloch-equation simulations and extended to allow for a B1+ amplitude correction using a linear scaling factor k. Dictionary matching was performed by minimizing the inner product between the magnitude of the dictionary entries and the magnitude of the measured signal. The acquisition pattern was optimized in numerical simulations to find the minimum TE to allow robust quantification of T2* times up to 150 ms. For this the maximum TE of the TE pattern was chosen by calculating the quantification precision of T2* in dependence of various TE patterns. Imaging was performed on a 3 T whole-body scanner (Magnetom Trio; Siemens Healthcare, Erlangen, Germany). The following image parameters were used for all MRF-EPI phantom and in-vivo measurements: TE/TR=14-75ms/48-109ms, flip angle=0-58°, matrix/FOV=128x128/220x220mm2, BW=1395Hz/pixel, slice thickness=5mm, partial-Fourier=6/8, parallel imaging factor=3 with GRAPPA reconstruction, reference lines=60, frames=160, acquisition time=10s. To validate the quantification accuracy of MRF-EPI, phantom experiments were performed and compared with an IR-TSE (TI=50-1600ms, matrix/FOV=128x128/220x220mm2, scan time=10min 0sec) for T1 and a GRE (TE=5-80msmatrix/FOV=128x128/220x220mm2, scan time=12min 48sec) sequence for T2*. Separate measurements of nine phantoms were preformed, each with a single gadoterate-meglumine (Dotarem; Guerbet) doped agarose compartment. The accuracy of MRF-EPI was assessed by comparing the mean relaxation times in manually drawn ROIs delineating each phantom. In-vivo images of six volunteers (4 females, 2 males 26±2 years old) were acquired in three imaging slices each. To quantitatively compare the accuracy, T1 and T2* values were obtained for white and gray matter in the parietal lobe and in the cortex of the frontal lobe.Results
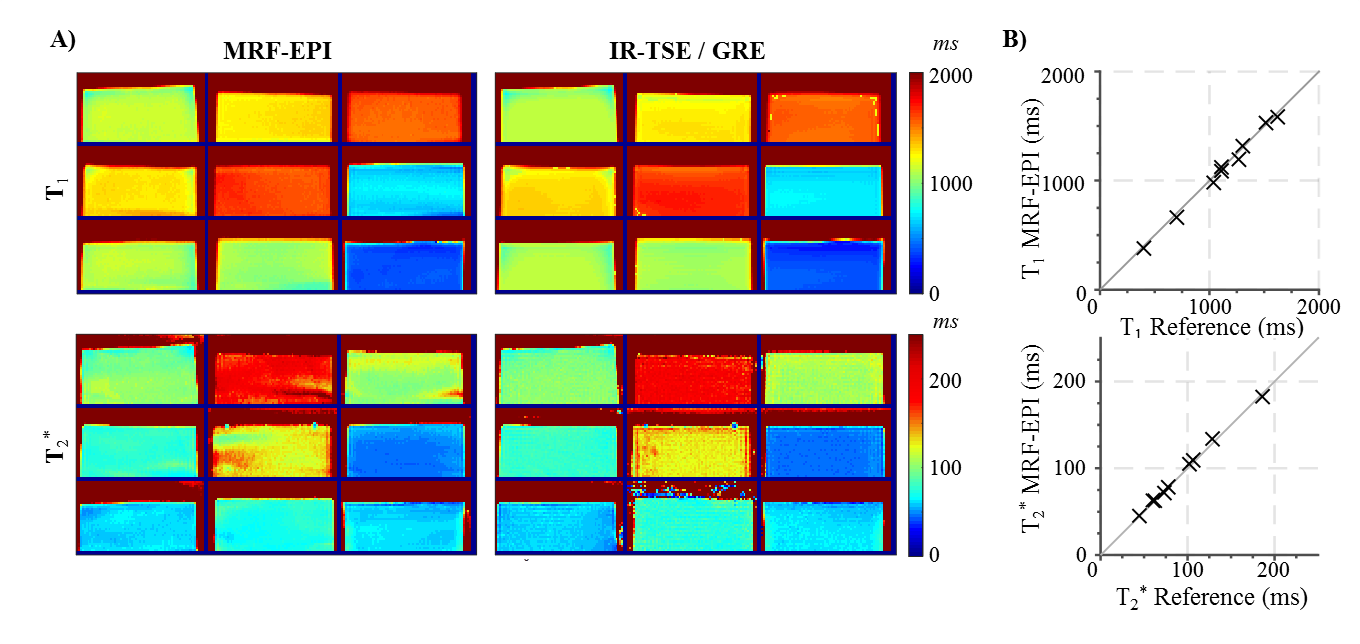
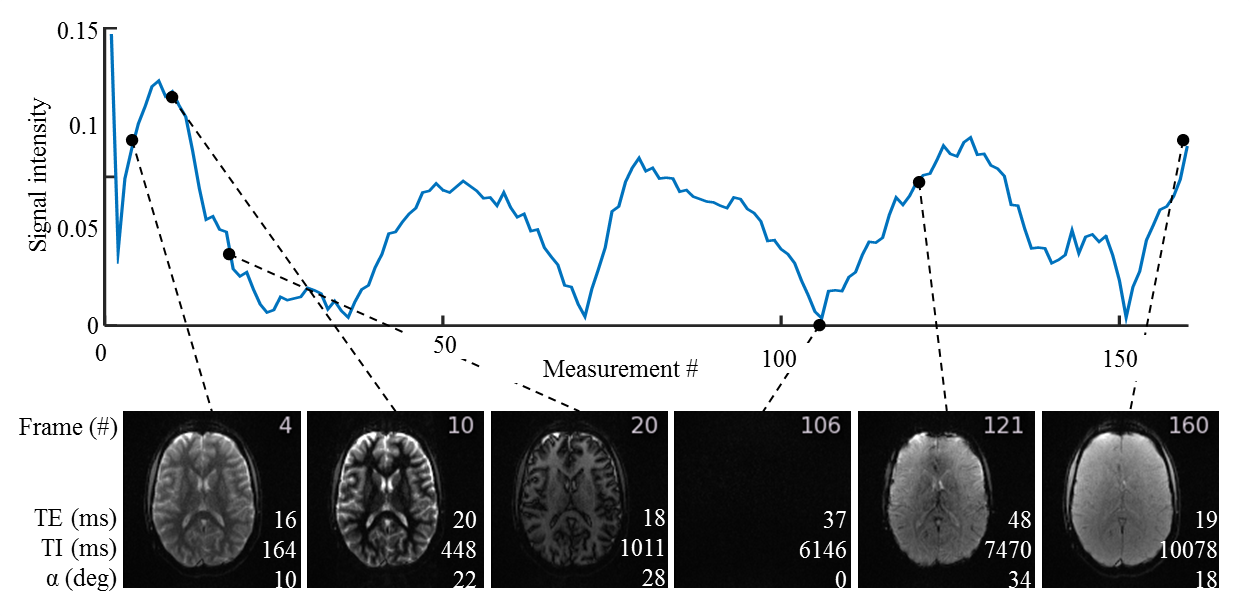
TEs were acquired in a sinusoidal pattern, with maximum TE chosen as 75ms as a compromise between precision and measurement time which gives sufficient precision in the in-vivo range of T2* (<150ms) (Figure 1d). The proposed method with B1+ correction yields homogeneous T1 and T2* estimates within the phantoms (Figure 2a) and shows good agreement with the reference measurements (Figure 2b). MRF-EPI data was successfully acquired in all volunteers. Figure 3 shows an exemplary fingerprint of a healthy subject. MRF baseline images show high image quality with no visible imaging artifacts. Figure 4 shows representative T1 and T2* maps of the MRF-EPI and the gold standard measurements from one healthy subject. The mean T1/T2* values obtained with MRF-EPI and gold standard sequences measured in manually drawn ROIs were: white matter 831±62ms/50±1ms (MRF-EPI), 790±56ms/48±3ms (gold standard), gray matter: 1818±175ms/50±4ms (MRF-EPI), 1751±131ms/48±6ms (gold standard).Discussion
In-vivo scans yielded robust and artifact free parameter maps, with in-vivo relaxation parameter values that are in good agreement with the reference scans. Recent data indicated sensitivity of MRF parameter quantification to system imperfections, due to inherent properties of the non-Cartesian data acquisition, as shown for radial imaging4. Spiral imaging is well known to also suffer from substantial image quality degradation in the presence of gradient deviations and trajectory mismatches5. While sequences based on EPI readout suffer from their own set of challenges like geometric distortions, bipolar EPI imaging is performed with commonly available auto-calibration to compensate for gradient delay errors and eddy current effects, providing a certain degree of robustness to this source of system imperfection6. Given the distinct profile of artifacts and sensitivity to hardware inaccuracies compared with spiral SSFP MRF sequences, the proposed implementation might offer a complimentary approach to study and utilize the MRF paradigm.Conclusion
In the study we have proven the feasibility of a MRF sequence with spoiled EPI readout. Rapid T1 and T2* quantification is performed within 10 seconds per slice and yields in-vivo relaxation parameter maps of high quality.Acknowledgements
No acknowledgement found.References
1. Deoni, S. C. L. Quantitative Relaxometry of the Brain. Top. Magn. Reson. Imaging TMRI 21, 101–113 (2010).
2. Vymazal,
J. et al. T1 and T2 in
the Brain of Healthy Subjects, Patients with Parkinson Disease, and Patients
with Multiple System Atrophy: Relation to Iron Content. Radiology. 1999 May
1;211(2):489–95.
3. Ma, D. et al. Magnetic resonance fingerprinting. Nature 495, 187–192 (2013).
4. Hong, T. et al. Analysis of estimation error from system imperfection in MRF. in Proc. Intl. Soc. Mag. Reson. Med. 24 (2016)
5. Alley, M. T. et al. Gradient characterization using a Fourier-transform technique. Magn. Reson. Med. 39, 581–587 (1998).
6. Schmithorst, V. J. et al. Simultaneous correction of ghost and geometic distortion artifacts in EPI using a multi-echo reference scan. IEEE Trans. Med. Imaging 20, 535–539 (2001).
Figures
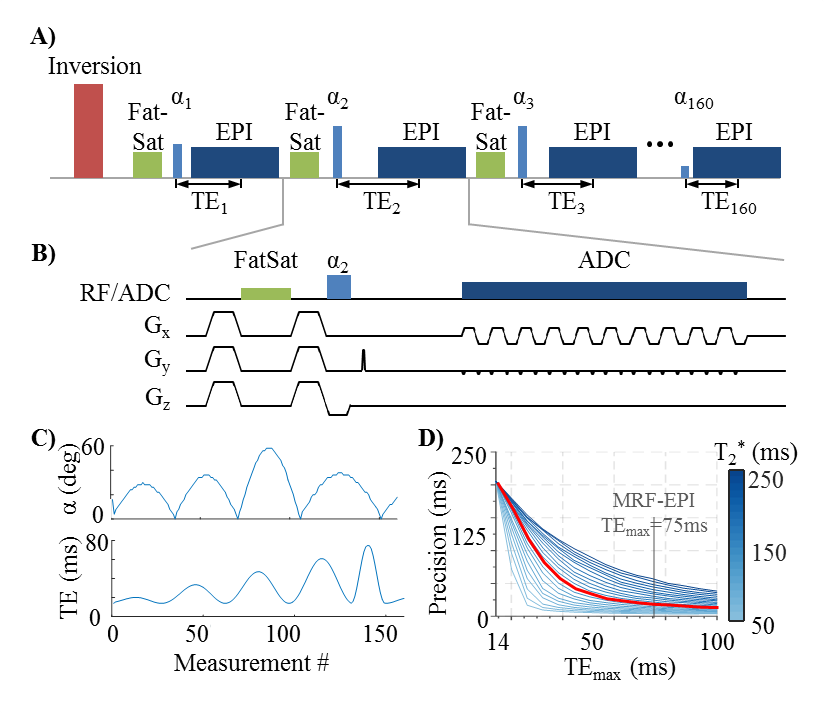
Figure 1:(A,B)Schematic diagram of the MRF-EPI with multiple EPI readouts, each with a different TE and flip angle (C)Profiles of the flip angle and TE variations (D)Quantification precision in dependence of the maximum TE time, T2*=150ms in red. For short T2* values a TE pattern with small TEmax provides sufficient precision.