3879
Correlating ZTE MRI signal to bone density to derive a patient-specific attenuation correction map in brain PET/MR1Brain and Spine Institute (ICM), Hôpital de la Pitié-Salpêtrière, Paris, France, 2Applications and Workflow, GE Healthcare, Orsay, France, 3Laboratoire d’Imagerie Moléculaire In Vivo (IMIV), Commissarriat à l'Energie Atomique et aux Energie Alternatives (CEA), Orsay, France
Synopsis
Attenuation correction (AC) is needed for an accurate PET image quantification in brain PET/MR. Regular MRI cannot distinguish between different tissue types based on electron density, thus, Zero Echo Time (ZTE) has been used to segment bone, air and soft tissue. Furthermore, a correlation has been established between histogram normalized ZTE intensity and measured CT density in Hounsfield Unit (HU) in bone on a CT-MR database of 16 patients. The patient-specific AC map generated by combining ZTE-based segmentation and linear scaling of normalized ZTE signal into HU showed to be a good substitute of the measured CT-AC map in brain PET/MR.
Purpose
An accurate attenuation correction (AC) is required to achieve quantitative PET/MR. Not only MRI cannot measure electron density that is needed to calculate an attenuation map, but also the absence of bone signal in regular MR image makes it difficult to separate the different tissue types in the head (air, bone, soft tissue). Very short TE sequences (UTE,ZTE) can measure bone signal in the MR images and can be used to derive an MR-based AC map (MRAC) in PET/MR[1,2]. However, the measured bone attenuation coefficients (μ) in brain CT images show intra and inter-patient variability. In this work, we investigated the relationship between MR intensity on ZTE images and measured bone density on a CT images in the skull and we used this relationship to derive patient-specific MRAC accounting for variable bone density. We compare the difference between using the continuous MRAC and a fixed bone μ MRAC on brain PET images with the reference CT-based AC map as reference.Methods
16 patients (mean age 65±6) underwent [18F]-FDG PET- CT (Siemens Biograph 6, Erlangen, Germany) and PET-MR (GE Signa, PET/MR, Waukesha, USA).
Zero Echo Time (ZTE), a silent 3D radial PD-weighted sequence[3], was acquired on the head station using a 24-channel head-neck receive coil with following parameters: FA=0.8°, BW=62.5kHz, NEX=4, FOV=(26.4x26.4)cm2, resolution=(1.6x1.6x1.6)mm3, acquisition time:1min32s.
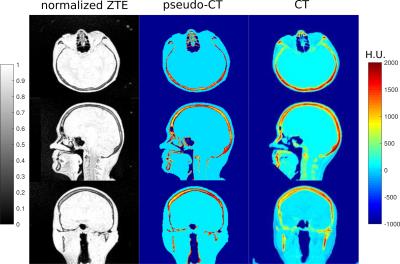
CT image (in Hounsfield Unit HU) acquisition parameters were: 110kVp, sampling=(1.376x1.376x3.000)mm3, registered to MR image using mutual information maximization algorithm (MIPAV, USA) and resampled to ZTE voxel size. The AC map derived from CT (CTAC) is considered as the gold standard. ZTE images were bias-corrected and their intensity histogram was normalized by centering its peaks at 0 (air) and 1 (soft tissue)[4]. Air was segmented by applying a threshold given by the air peak on the histogram. By fitting the soft tissue peak with a Gaussian function, bone intensities were identified to create a bone mask. Hence, a 3-segment map was obtained(Fig.1).
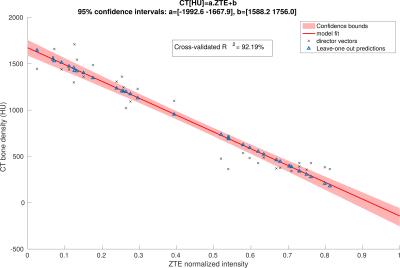
To explore the relationship between CT and normalized ZTE bone intensities, joint histograms were plotted by selecting bone voxels using a bone-only neighbourhood condition to limit the partial volume effect(Fig.2). A principal component analysis (PCA) was applied on the joint histogram in order to reduce the number of variables to interpretable linear combinations of the data. The first principal component (PC) of joint histograms of 16 patients all contained 99,98% of the variance yielding a linear relationship between CT in HU and normalized ZTE. This relationship was determined by linear regression of the first PC of the 16 patients (Fig.3) given by: CT(HU)=-1816.4×ZTEnorm+1671.6. This relation is only valid for the given acquisition parameters. This relationship was used to derive a continuous MRAC (cont-MRAC). A fixed MRAC (fixed-MRAC) was generated by setting bone density to 1136HU. Soft tissue and air were given fixed densities on both maps. For comparison, a bone-free MRAC (nobone-MRAC) was generated by using soft tissue density for bone. PET image reconstruction was done with TOF-OSEM (8 iterations, 28 subsets, matrix size:256x256) and the 3 different MRAC maps (cont-MRAC, fixed-MRAC, nobone-MRAC). A ROI analysis using the AAL brain template in SPM was done to assess the PET uptake difference in the brain when using the cont-MRAC and fixed-MRAC with respect to CTAC used as reference.
Results
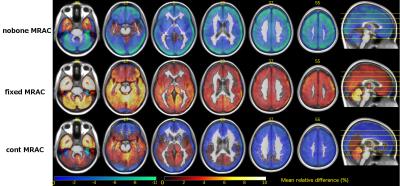
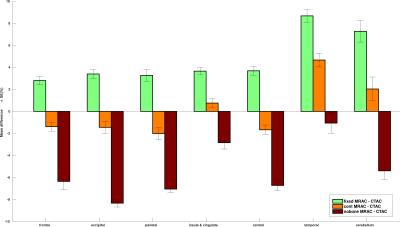
ZTE image segmentation algorithm yielded satisfactory tissue classification especially in regions with air-bone interface. The PCA analysis performed on the joint histograms between CT density in HU and normalized ZTE intensity in bone voxels yielded a linear relationship (R2=92.19%)(Fig.3). Cont-MRAC corrected images showed a lower difference in regional FDG-uptake than fixed-MRAC with CTAC corrected images(Fig.4). Fixed-MRAC corrected images present an overestimation in uptake in all ROIs in comparison to reference CTAC corrected images, whereas ignoring bone shows as expected an underestimation of the reference uptake(Fig.5). Both ZTE-based methods show a similar error in temporal lobes because of overestimation of cancellous bones in this area(Fig.4-5).Discussion/Conclusion
Based on a CT-MR database of 16 patients, we demonstrated the existence of a linear relationship between the measured bone density in CT image and histogram-normalized ZTE bone signal. Then, we showed how this linear relationship can be used to estimate the AC maps from the histogram-normalized ZTE, showing to be a good substitute of the measured CTAC in brain PET/MR. With this method, a patient-specific AC map acquired with MRI can be adapted to children or post-operative patients with variable bone shape and density, where implemented methods based on the atlas approach are limited. Future work will focus on reducing error in temporal lobes by improving ZTE estimation of cancellous bones.Acknowledgements
This work was supported by the Lidex-PIM project funded by the IDEX Paris-Saclay grant "ANR-11-IDEX-0003-02".
This work was performed on a platform of France Life Imaging network partly funded by the grant "ANR-11-INBS-0006" and received funding from the program 'Institut des neurosciences translationnelle' ANR-10-IAIHU-06.
The authors thank GE Healthcare for providing access to research tools and prototype pulse sequences.
The authors would like to thank Michaël Czisch, Victor Spoormaker and Philipp Sämann for providing the high resolution 3D-T1w template.
References
[1] M. Juttukonda et al., NeuroImage, 2015.
[2] G. Delso et al., JNM, 2105.
[3] D. Madio et al., Magn. Res. Med., 1995.
[4] F. Wiesinger et al. ,Magn. Res. Med., 2015.
Figures


Fig. 2: Bone pixels selected on the CT and normalized ZTE images are used to create a joint histogram. On the right, the joint histograms of the 16 patients are grouped in one.
Bone voxels were selected on both images as follows: voxels and their 8-neighbours in 2D must have bone-like densities on CT ([300, 2000]HU) This condition limits ensures that the resulting voxels are not affected too much by partial volume effect.


