3872
Evaluation of image quality of compressed sensing MRI with natural image quality evaluator1Diagnostic Imaging and Nuclear Medicine, Graduate School of Medicine, Kyoto University, Kyoto, Japan, 2Center for Advanced Imaging Innovation and Research (CAI2R) and Bernard and Irene Schwartz Center for Biomedical Imaging, Department of Radiology, New York University School of Medicine, New York, NY, United States, 3Department of Systems Science, Graduate School of Informatics, Kyoto University, Kyoto, Japan
Synopsis
Many image quality assessments (IQA) have been proposed for natural image assessment but few reports have applied them to MRI images, much less to reconstructed images by compressed sensing (CS). Ten subjects were scanned for time-of-flight MR angiography (TOF-MRA), retrospectively under-sampled, and reconstructed by CS. The reconstructed images were evaluated subjectively by radiologists and quantitatively by several IQAs. Structural similarity, scale-invariant feature transform and natural image quality evaluator correlate well with radiologists’ perception and hence can be used to determine the optimal parameters for CS of TOF-MRA.
INTRODUCTION
The optimization of regularization parameters in compressed sensing (CS) MRI remains to be a challenging task1. Conventional full-reference image quality assessments (IQA) such as normalized mean square error (NMSE) and peak signal-to-noise ratio (PSNR), which are often used to evaluate the quality of the reconstructed images, do not necessarily correlate with radiologists' perception. Although it has been previously shown that in 3D time-of-flight MR angiography (TOF-MRA), structural similarity (SSIM)2 and scale-invariant feature transform (SIFT)3 correlate well with radiologists' perception, the number of subjects was very limited4. Additionally, it is unclear whether the optimal parameters determined for one subject could be used for other subjects under the same scanning conditions. To address these issues, TOF-MRA images of 10 patients were scanned and reconstructed by CS, evaluated both subjectively by radiologists and quantitatively by several full-reference IQAs, namely NMSE, SSIM and SIFT, as well as a no-reference IQA, namely natural image quality evaluator (NIQE) 5.METHODS
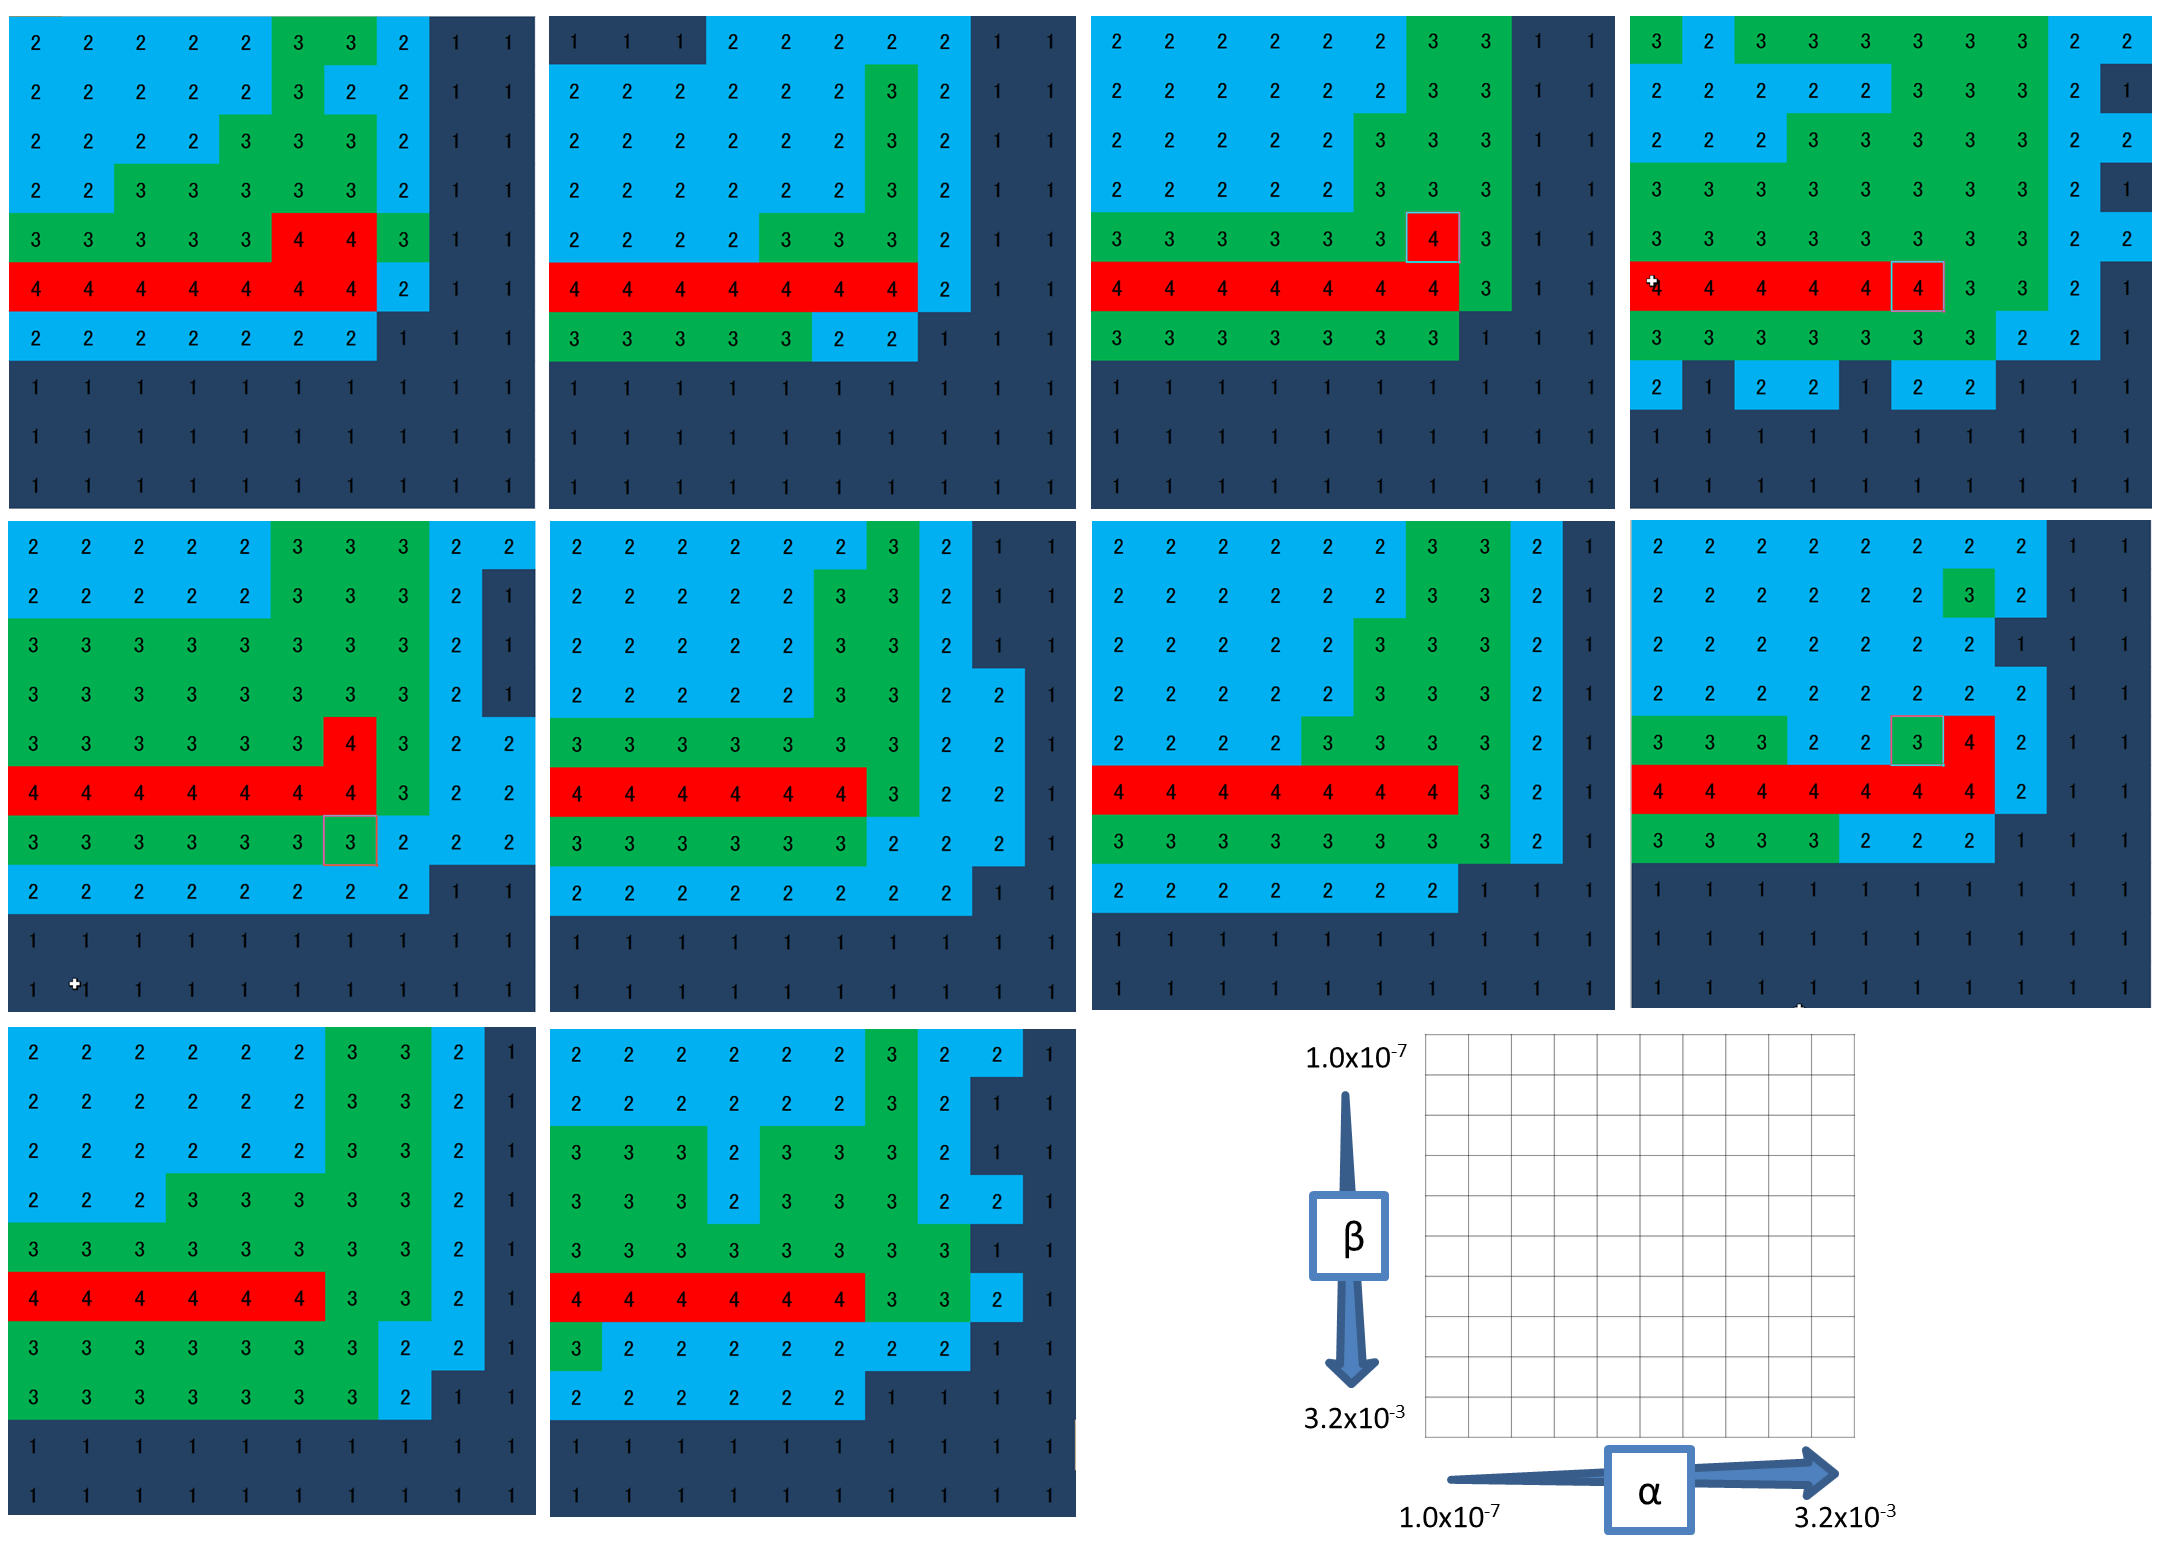
Study protocols were approved by the local ethics committee. 3D TOF-MRA images of 10 healthy volunteers were scanned on a 3.0T MRI (Vantage, TOSHIBA MEDICAL SYSTEMS CORPORATION, Otawara, Japan) using a 32-channel head coil. Data were retrospectively under-sampled at a rate of 21% by use of a variable-density Poisson disk mask. After reducing the data size by a coil compression technique6, CS reconstruction was performed by the FCSA algorithm7 to solve the following minimization problem: $$$min_x\left\{ \frac{1}{2}||y-Ax||_2^2 +\alpha||\Psi(x)||_1 +\beta \cdot TV(x) \right\}$$$, where x is the reconstructed image, y is the measured k-space data, A represents the under-sampled Fourier transform, psi and TV represent wavelet transform and total variation, respectively. α and β are regularization parameters which were both varied in a range of {3.2 × 10⁻³, 1.0 × 10⁻³, 3.2 × 10⁻⁴, 1.0 × 10⁻⁴, 3.2 × 10⁻⁵, 1.0 × 10⁻⁵, 3.2 × 10⁻⁶, 1.0 × 10⁻⁶, 3.2 × 10⁻⁷, 1.0 × 10⁻⁷}. By use of an outline extraction algorithm, a brain mask was created for each subject and applied in order to exclude the extra-axial regions. As a result, a total of 1000 craniocaudal maximum intensity projection (MIP) image was rendered for each reconstructed 3D volume data. The sum of squares image was used as the reference standard. The MIP images were visually evaluated by two radiologists with clinical experience of 8 and 16 years, respectively, on a scoring system from 1 to 4. NMSE and mean SSIM values, and Euclidian norms of the SIFT descriptors between the reconstructed MIP and reference standard images were calculated. NIQE values were calculated for the reconstructed MIP images. The Spearman’s rank-order correlation coefficients (SROCC) for each IQA versus visual scores were calculated. - RESULTS
The
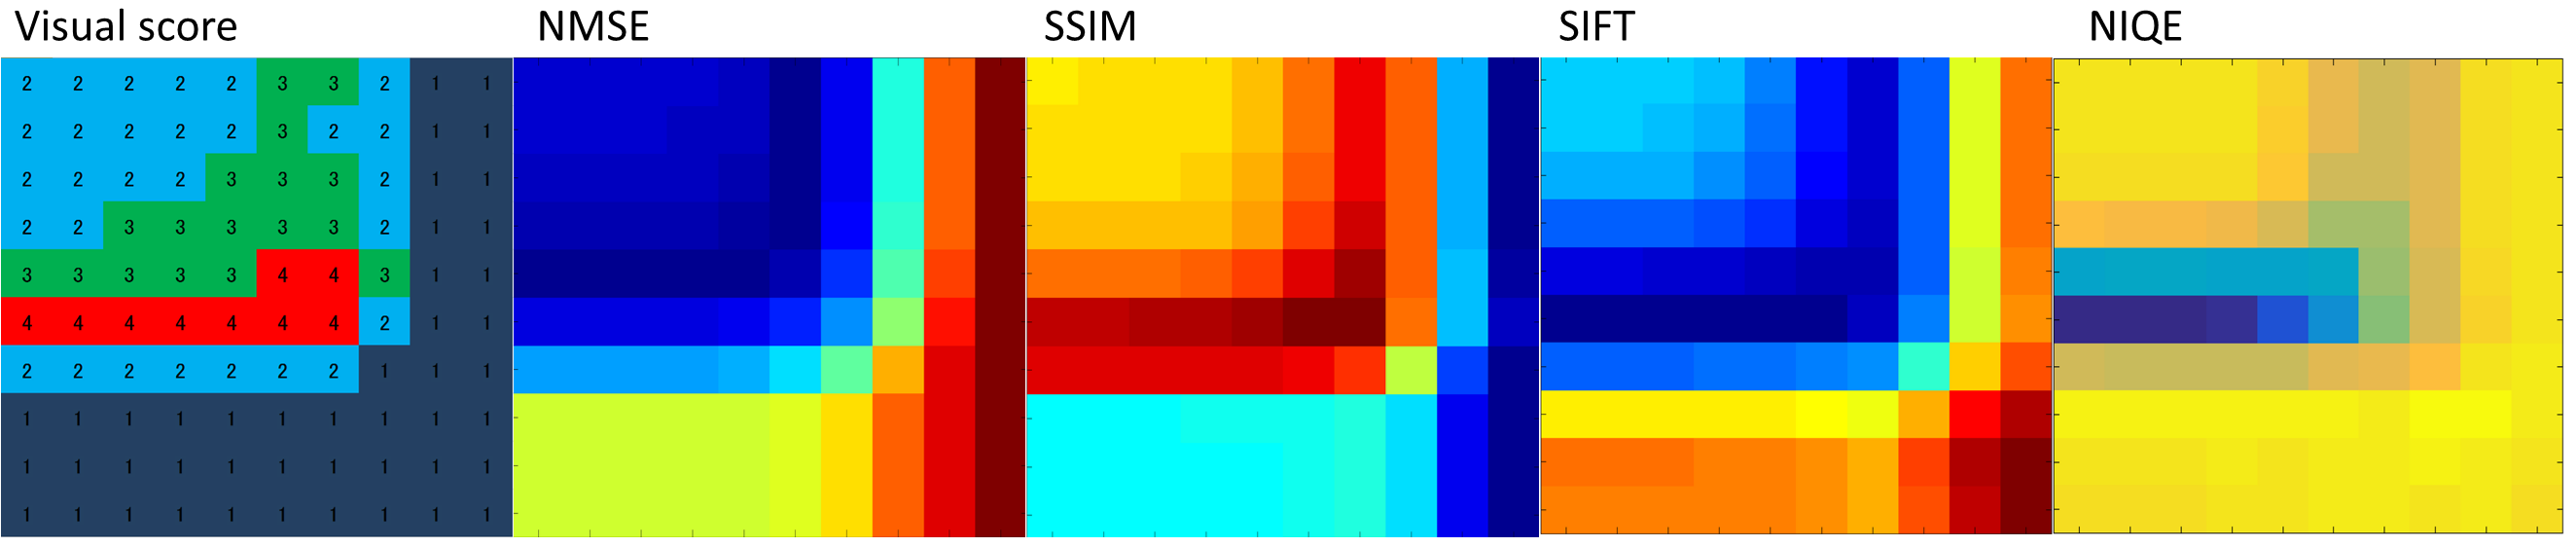
subjective and quantitative results are depicted as color maps against
each parameter pair of α and β (Fig 1,2). The
regularization parameters of the best visually scored images were
consistent among the 10 subjects. The quantitative results were mostly
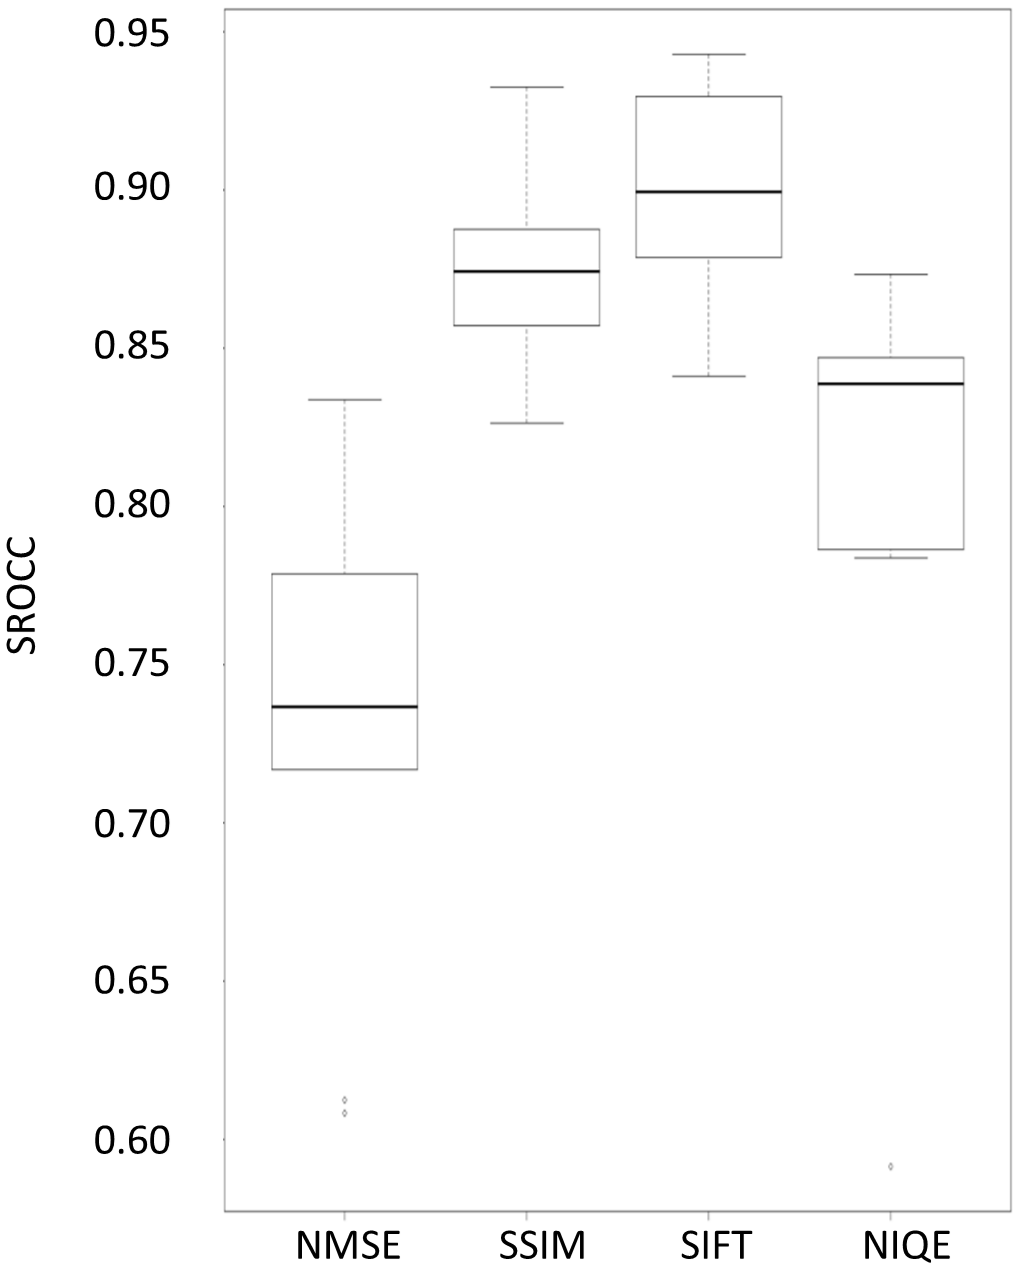
consistent among patients but varied among the type of image metric. The mean
absolute SROCCs between the visual score and each IQA (NMSE, SSIM, SIFT,
NIQE) were 0.7340, 0.8724, 0.9010, and 0.8073, respectively (Fig 3). The
number of subjects for each IQA whose best image also visually scored the
highest were 0, 10, 10, and 9, respectively. - DISCUSSION
In the evaluation of TOF-MRA images reconstructed by CS, NMSE did not
correlate well with radiologists’ visual perception while SSIM and
NIQE correlated well and SIFT showed excellent correlation. The best image determined by SSIM, SIFT and NIQE was
visually scored as the best, except for one subject with NIQE. On the
other hand, our subjective results showed that the optimal regularization
parameters determined for one subject are likely optimal for other
subjects. From these results, SSIM, SIFT and NIQE in conjunction with brain
masks are likely to be useful in the evaluation of TOF-MRA images and hence
parameter optimization in CS of TOF-MRA.
To the
best of our knowledge, this is the first report in which NIQE, an IQA which
does not require a reference standard, has been shown to be useful in the
evaluation of images reconstructed by CS. This metric could be used in various
CS-related researches and may benefit MRI technicians in clinical settings
where image quality assessment is needed in the absence of radiologists. - CONCLUSION
SSIM, SIFT and NIQE with the
use of brain masks correlate well with radiologists’ perception and hence can
be used to determine the optimal parameters for CS of
TOF-MRA.Acknowledgements
This work is supported in part by the Grant-in-Aid for Scientific Research on Innovative Areas “Initiative for High-Dimensional Data-Driven Science through Deepening of Sparse Modeling” (MEXT grant numbers 25120002, 25120008).
References
1. Lustig, M., Donoho, D. & Pauly, J. M. Sparse MRI: The application of compressed sensing for rapid MR imaging. Magn. Reson. Med. 58, 1182–1195 (2007).
2. Z. Wang, A. C. Bovik, H. R. S. and E. P. S. Image quality assessment: From error visibility to structural similarity. IEEE Trans. Image Process. 13, 600–612 (2004).
3. Lowe, D. G. Object recognition from local scale-invariant features. in Proceedings of the Seventh IEEE International Conference on Computer Vision 2, 1150–1157 vol.2 (IEEE, 1999).
4. Akasaka, T. et al. Optimization of Regularization Parameters in Compressed Sensing of Magnetic Resonance Angiography: Can Statistical Image Metrics Mimic Radiologists’ Perception? PLoS One 11, e0146548 (2016).
5. Mittal, A., Soundararajan, R. & Bovik, A. C. Making a ‘completely blind’ image quality analyzer. IEEE Signal Process. Lett. 20, 209–212 (2013).
6. Zhang, T., Pauly, J. M., Vasanawala, S. S. & Lustig, M. Coil compression for accelerated imaging with Cartesian sampling. Magn. Reson. Med. 69, 571–582 (2013).
7. Huang, J., Zhang, S., Li, H. & Metaxas, D. Composite splitting algorithms for convex optimization. Comput. Vis. Image Underst. 115, 1610–1622 (2011).
Figures