3861
Compressed Sensing 3D GRASE with Group-Sparse Reconstruction for Brain Myelin Water Imaging1Physics and Astronomy, University of British Columbia, Vancouver, BC, Canada, 2Medicine, University of British Columbia, Vancouver, BC, Canada, 3Radiology, University of British Columbia, Vancouver, BC, Canada, 4UBC MRI Research Centre, Vancouver, BC, Canada, 5UBC MRI Research Centre, Vancouer, BC, Canada
Synopsis
Myelin water fraction (MWF), which reflects myelin content, can be derived from multiple T2 weighted images. In this study, compressed sensing was used to accelerate 3D GRASE myelin water imaging in simulated experiments using a Cartesian undersampling scheme. Group-sparse reconstruction that exploits the correlation between the echoes, and different echo sampling schemes, were tested. Group-sparse reconstruction was found to improve the overall data quality, and identical phase encode undersampling for each echo was found to improve MWF map quality. Using both, MWF map quality remained usable for up to 4x acceleration.
Introduction
Myelin is important for the normal functioning of the central nervous system. Quantitative T2 based myelin water imaging (MWI) calculates myelin water fraction (MWF), which has been shown to measure myelin content, from T2 distributions derived by fitting a series of T2 weighted images.1–3 Spin-echo based sequences were typically used, but they are inherently slow. The introduction of the gradient-and spin-echo (GRASE) sequence that uses gradient-echoes to fill the periphery of k-space has made whole brain MWI clinically feasible4. This study investigates the use of compressed sensing (CS) reconstruction to accelerate 3D GRASE MWI. Group-sparse reconstructions that exploit the correlation in the echo direction, as well as different echo sampling schemes, were tested.Methods
A 3D GRASE sequence was used to acquire fully-sampled data in the brain of 3 healthy volunteers on a Philips Achieva 3.0T MR scanner (Best, The Netherlands),4 with TE/TR = 10/1,000 ms, 32 echoes, 232 × 225 × 20 matrix size, 23 cm × 19 cm × 100 cm FOV, and SENSE = 2. Two gradient echoes were used per spin echo. Total acquisition time was 14 minutes. Complex images were reconstructed at 240 × 240 × 40 and the corresponding k-space was calculated.
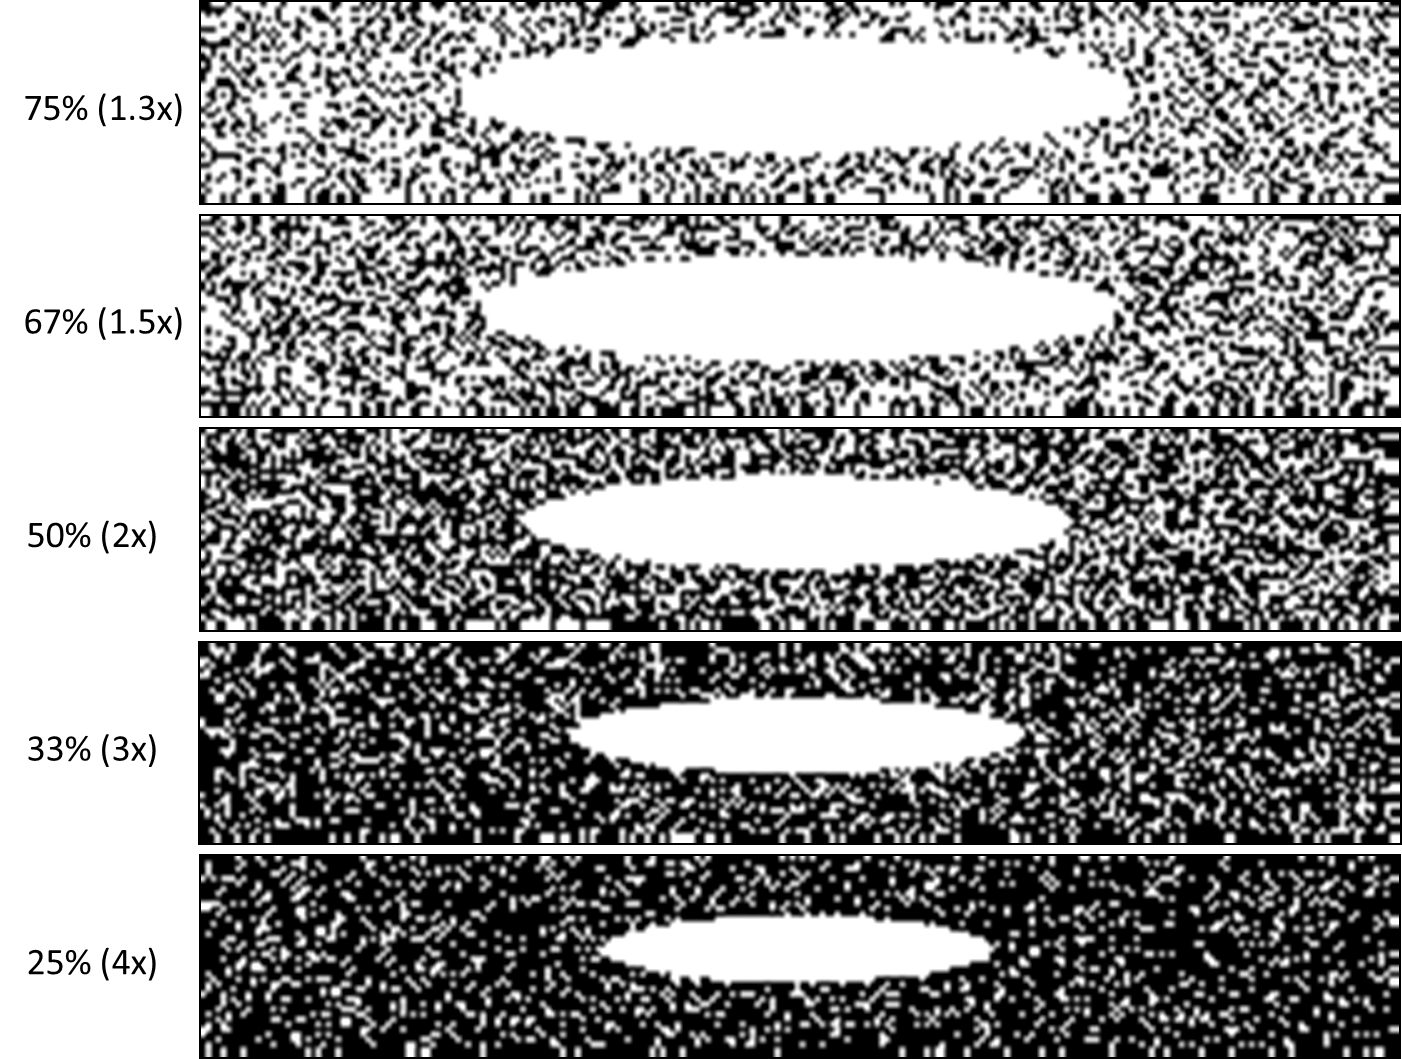
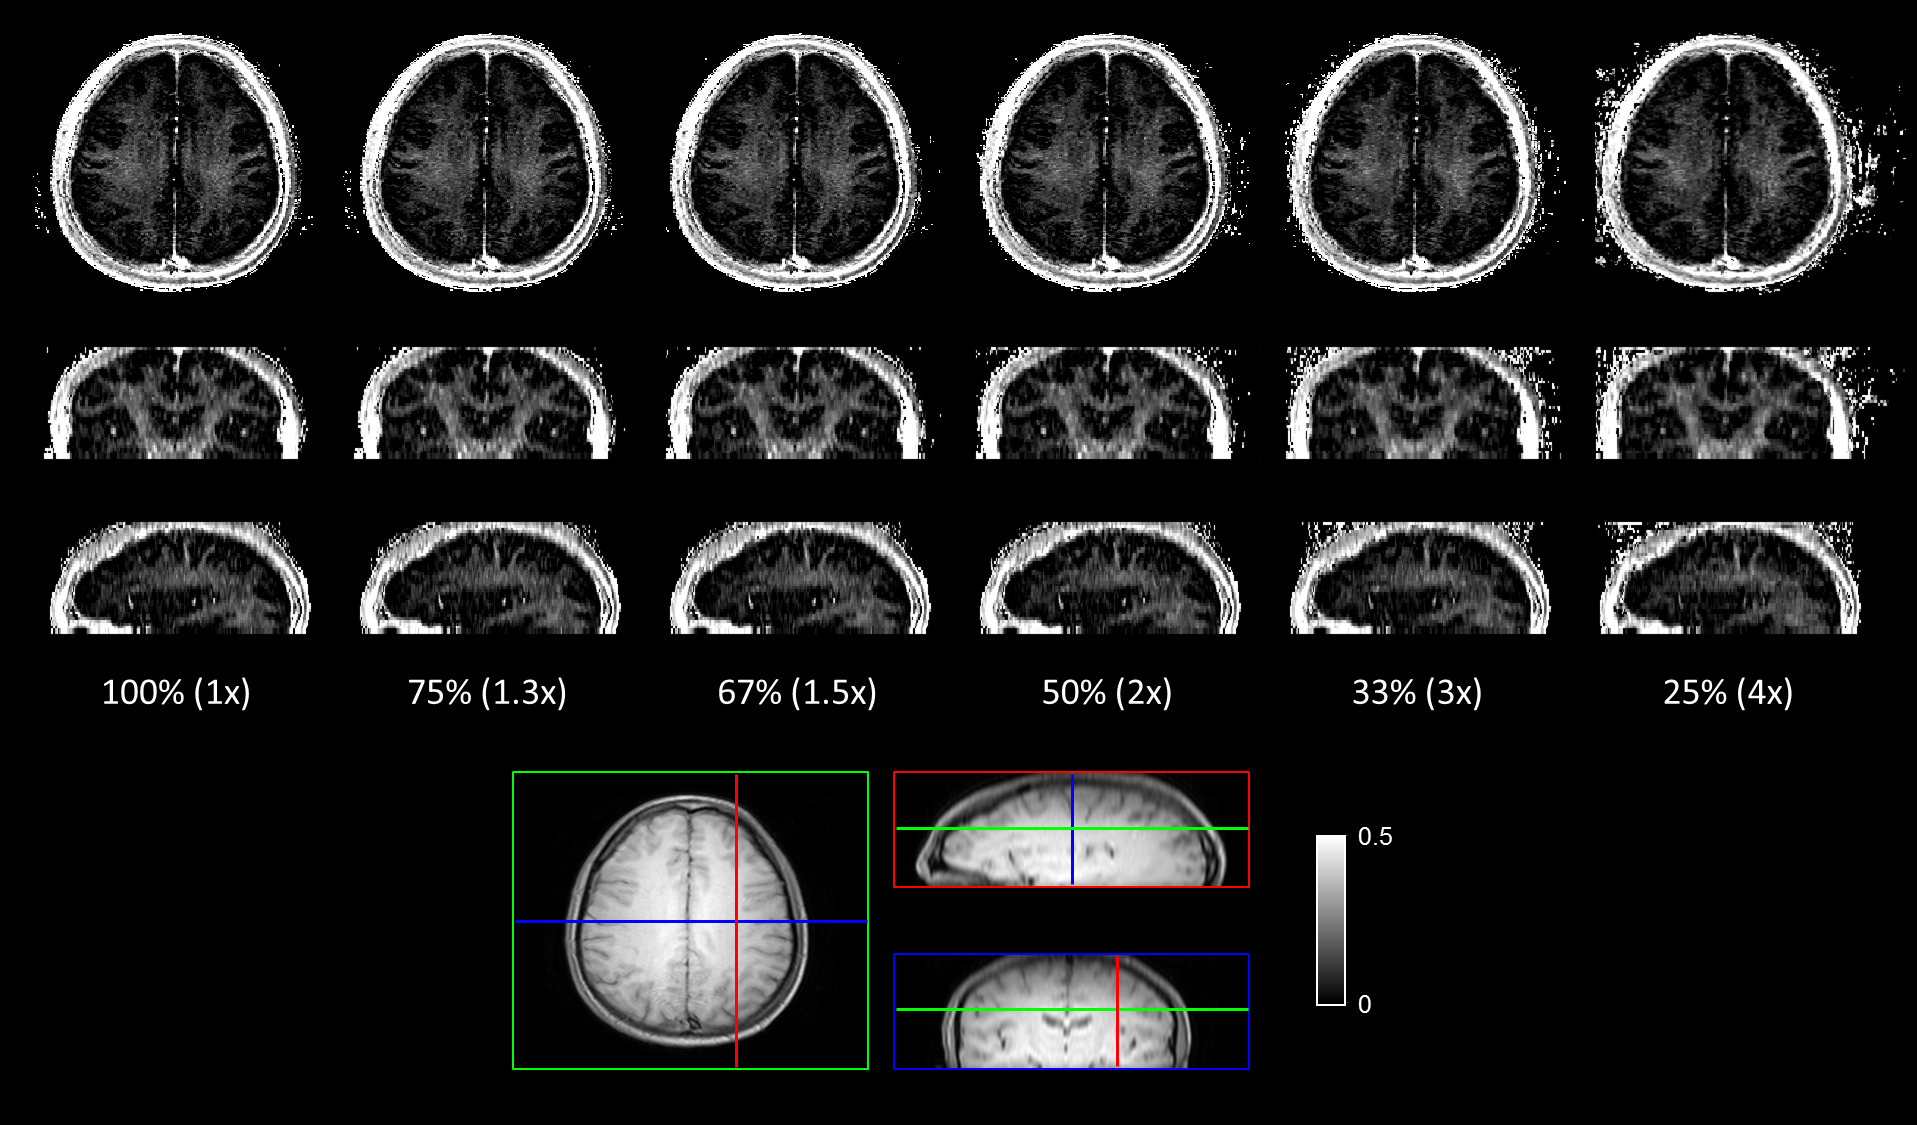
From the three fully-sampled k-space data, undersampled data was generated with acceleration factors of 1.33, 1.5, 2, 3, and 4 using the Cartesian schemes that undersamples the phase encode (PE) directions (Figure 1). Two different approaches were used for echo sampling: 1) Identical echo sampling where PE undersampling were identical for all echoes; and 2) different echo sampling where PE undersampling for each echo was unique, but shared the same probability density function.
The Daubechies 8 wavelet at 3 levels of decomposition was used as the sparsifying transform.5 Reconstruction was performed using SPGL1 with and without utilizing group-sparsity in the echo direction6,7. The non-negative least square (NNLS) algorithm with stimulated echo correction was used to calculate the T2 distribution.8,9 MWF maps were generated by dividing the integral from 15–40 ms by the total integral of the distribution. Normalized mean square error (NMSE), defined as the norm of the difference over the norm of the reference, was used as the metric for comparing the results in the signal region.
Results
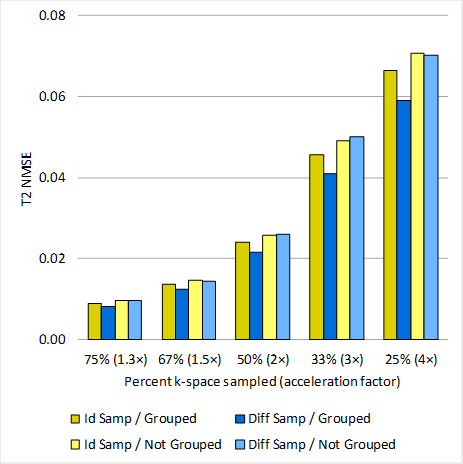
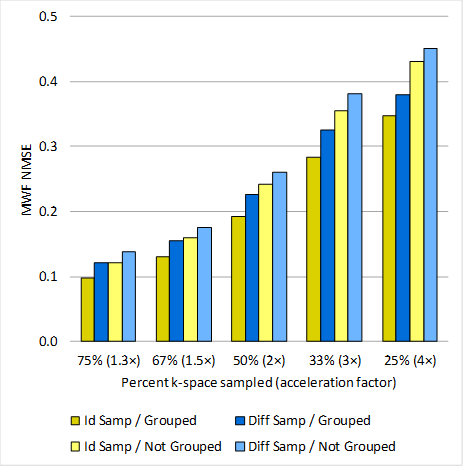
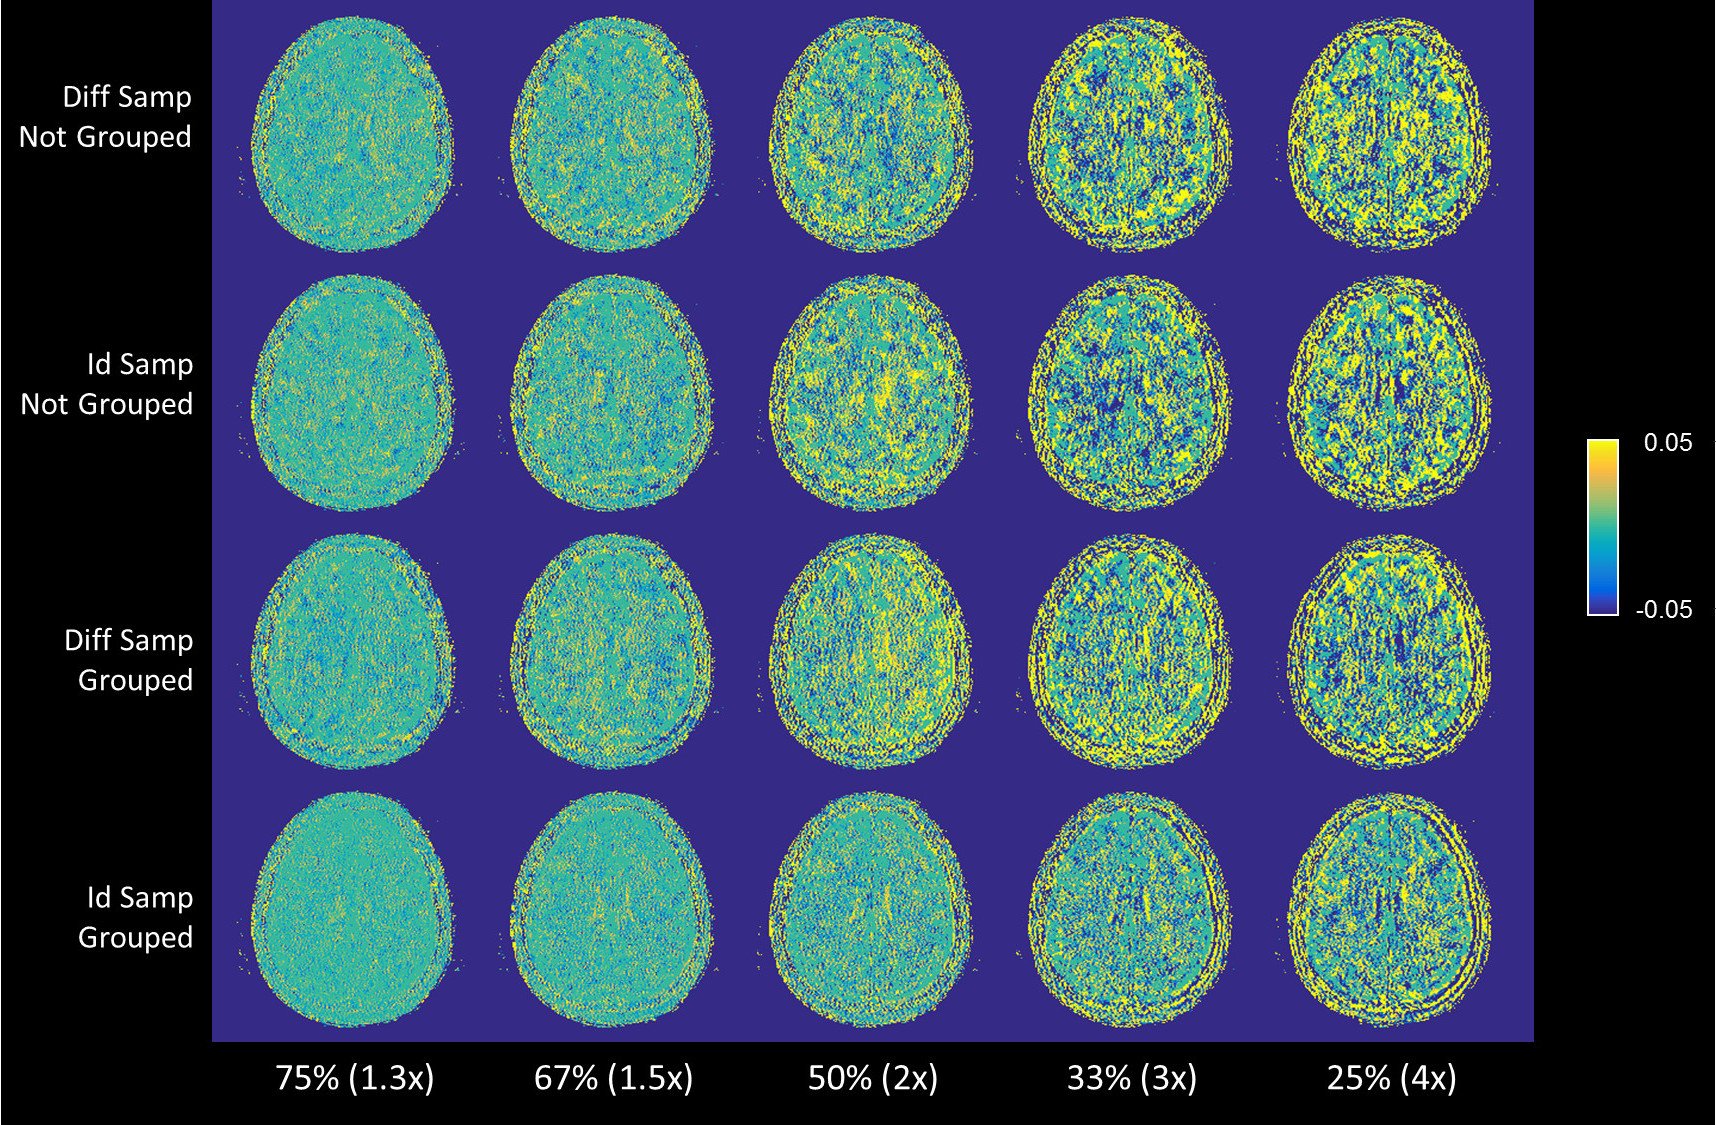
NMSE results are shown in Figure 2 and 3. Selected MWF differences maps and MWF maps are shown in Figure 4 and 5. The use of group-sparse reconstruction in the echo direction improved the quality of both the T2 weighted images and the MWF maps. Reconstructions of the T2 weighted images were more accurate with different echo sampling; however, for MWF map generation, identical echo sampling clearly outperformed different echo sampling. MWF map quality remained excellent for up to 2× acceleration and the maps were still usable at 4× acceleration.Discussion
Unsurprisingly, the least amount of error resulted when the echoes were reconstructed together utilizing group-sparsity. However, unlike 2D CS for MWI,10 identical echo sampling achieved more accurate MWF maps, which is unexpected because different echo sampling was supposed to better utilize the benefit of group-sparse optimization11. Perhaps choosing between identical and different echo sampling is a compromise between reducing aliasing artifacts and promoting sparsity, and recovering accurate T2 decay curves. Because MWF from NNLS analysis is not highly sensitive to small constant offsets, the results shown here may be affected by the interplay between the overall magnitude of CS artifacts in the T2 weighted images and its variation across echoes. The use of identical sampling may produce larger CS artifacts in the T2 weighted image, but may also reduce variation across echoes for more accurate T2 analysis. One could also speculate that in 3D, the extra correlation from the additional phase encode dimension reduces the need for correlation in the echo direction, so that even without utilizing group-sparsity in the echo direction, identical echo sampling produced better MWF maps.
While this is a simulation study, the use of this simple Cartesian scheme is easy to implement. The technique can also be made compatible with parallel imaging by formulating the signals from multiple coils as part of the CS reconstruction problem.
Conclusion
This study demonstrated that quantitative T2 based MWI technique can be greatly accelerated by using a simple Cartesian undersampling scheme with identical echo sampling and group-sparse reconstruction. It is conceivable that with the use of CS, data acquisition for GRASE MWI can be performed in less than 4 minutes.Acknowledgements
This project was supported with funding from NSERC.References
1. Kozlowski P, Liu J, Yung AC, Tetzlaff W. High-resolution myelin water measurements in rat spinal cord. Magn. Reson. Med. 2008;59:796–802.
2. Laule C, Vavasour IM, Moore GRW, Oger J, Li DKB, Paty DW, MacKay AL. Water content and myelin water fraction in multiple sclerosis. J. Neurol. 2004;251:284–293. doi: 10.1007/s00415-004-0306-6.
3. Minty EP, Bjarnason TA, Laule C, MacKay AL. Myelin water measurement in the spinal cord. Magn. Reson. Med. 2009;61:883–892. doi: 10.1002/mrm.21936.
4. Prasloski T, Rauscher A, MacKay AL, Hodgson M, Vavasour IM, Laule C, Mädler B. Rapid whole cerebrum myelin water imaging using a 3D GRASE sequence. NeuroImage 2012;63:533–539. doi: 10.1016/j.neuroimage.2012.06.064.
5. Daubechies I, Heil C. Ten Lectures on Wavelets. Comput. Phys. 1992;6:697–697. doi: 10.1063/1.4823127.
6. Majumdar A, Ward RK. Accelerating multi-echo T2 weighted MR imaging: Analysis prior group-sparse optimization. J. Magn. Reson. 2011;210:90–97.
7. Van Den Berg E, Friedlander MP. Probing the Pareto frontier for basis pursuit solutions. SIAM J. Sci. Comput. 2008;31:890–912.
8. Whittall KP, MacKay AL. Quantitative interpretation of NMR relaxation data. J. Magn. Reson. 1969 1989;84:134–152.
9. Prasloski T, Mädler B, Xiang Q-S, MacKay A, Jones C. Applications of stimulated echo correction to multicomponent T2 analysis. Magn. Reson. Med. 2012;67:1803–1814. doi: 10.1002/mrm.23157.
10. Chen HS, Majumdar A, Kozlowski P. Compressed Sensing CPMG with Group-Sparse Reconstruction for Myelin Water Imaging. In: Proceedings of the International Society of Magnetic Resonance Imaging. 19. ; 2011. p. 2506.
11. Majumdar A, Ward RK. Joint reconstruction of multiecho MR images using correlated sparsity. Magn. Reson. Imaging 2011;29:899–906.
Figures