3852
Independent band-specific correction for B0 and B1 inhomogeneities in multiband 2D RF pulses1Department of Radiology, Stanford University, Stanford, CA, United States, 2Department of Electrical Engineering, Stanford University, Stanford, CA, United States, 3GE Healthcare, Menlo Park, CA, United States
Synopsis
2D in-plane multiband RF pulses have been developed to offer high-resolution diffusion-weighted imaging (DWI) with minimal distortion. However, B0 and B1 inhomogeneities may lead to significant and varying signal loss in different bands, that
Introduction
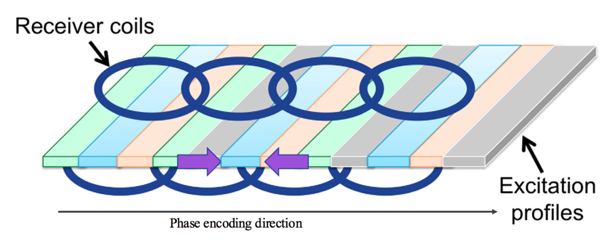
DWI is a promising technique to characterize breast lesions without using contrast agents1, and 2D in-plane multiband pulses have been shown to provide high-resolution DWI with bilateral coverage and reduced distortion2,3. In this method, multiple in-plane bands are excited simultaneously and the whole field of view is covered by sweeping the excitation pattern along the PE direction (Figure 1). Different RF bandwidths are used for the 2D excitation and refocusing pulses to suppress fat4, which makes the sequence sensitive to B0 variations. It has been also shown that in breast MRI, B1 inhomogeneity is severe and leads to a distinct left-right asymmetry5. In this work, we have implemented B0 and B1 inhomogeneity correction for each band independently by tuning the center frequency and amplitude of each 2D RF pulse before multiband modulation.Theory
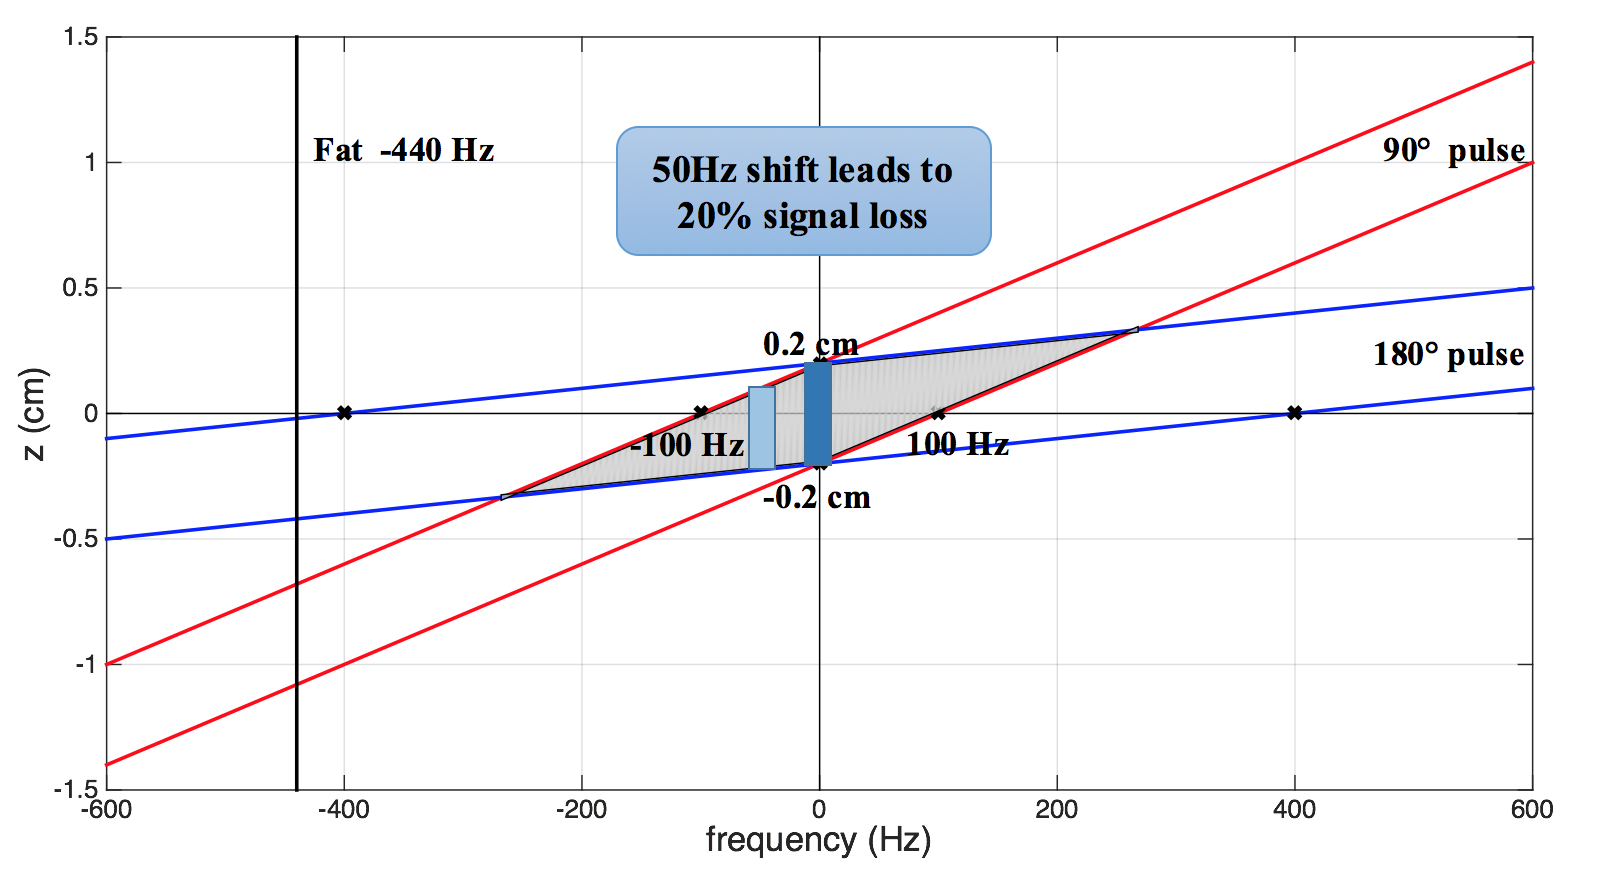
Figure 2a shows the spectral-spatial response of the 90°-180° pair, with z and f representing slice-selection direction and frequency. The slice thicknesses of the 2D excitation and refocusing pulses are both 4mm, while the bandwidths are 200Hz and 800Hz, respectively. Only overlapping regions in the z-t plot are both excited and inverted. This ensures fat suppression on resonance. In the ideal case, water at 0Hz from -0.2cm to 0.2cm is excited and inverted, suffering no signal loss (light blue region in Figure 2a). However, in the presence of B0 inhomogeneity, there is a mismatch between the excitation and refocusing pulses. This mismatch leads to an unwanted signal loss (dark blue region). B1 variations lead to amplitude variations in the image.Methods
There are two steps to correct B0 variations: 1) modulating the 2D excitation pulse for each band to the correct frequency (Figure 3d), and 2) increasing the slice thickness of the 180° pulse. The first step alone is not sufficient to eliminate the influence of B0 variations (Figure 3b), so increasing the refocusing slice thickness is necessary to prevent signal loss (Figure 3c). To correct for B1 inhomogeneity, the amplitude of each 2D excitation pulse is scaled based on a separately acquired B1 map.
Hence, the steps for multiband DWI with B0 and B1 corrections are, 1) acquiring B0 and B1 maps, 2) calculating center frequencies and amplitude scaling factors for each band, 3) frequency (linear-phase) modulating and scaling the 2D excitation pulse for each band independently, 4) combining the separate 2D RF pulses in a multiband excitation.
The proposed method was tested on a 3T GE MR750 scanner with an eight-channel breast coil (FOV=38cm, matrix size=256×256, 4mm slice thickness, BW=250kHz, number of bands in each excitation = 3, number of passes for bilateral coverage = 4, band width = 4cm). B0 and B1 maps were acquired with IDEAL and the Bloch‐Siegert method6,7, respectively.
Results and Discussion
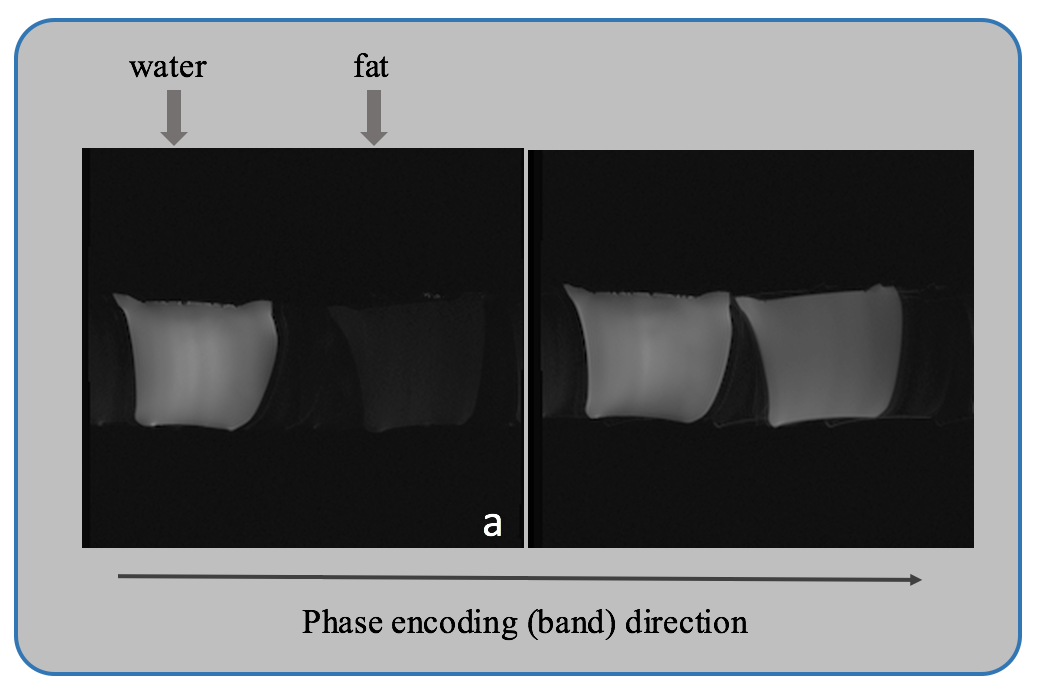
Figure 4 shows images after combining all twelve bands using root sum of squares. The phantom on the left contains water while the one on the right contains oil. In Figure 4a, no correction was applied. There was no signal from the fat phantom, which demonstrated good fat suppression. In Figure 4b, by tuning the center frequencies of the excitation pulses corresponding to the six bands on the right, the fat phantom could be imaged, which indicated that each band was indeed excited at the desired frequency.
Figures 5a and 5b show B0 and B1 maps acquired in a breast phantom, together with step-wise approximations of the center frequencies and amplitude scaling factors. B0 varied slowly along the phase encoding direction while the B1 field could vary widely even within a single band. Figures 5c and 5d show a representative slice acquired with the original multiband 2D RF pulses and the B0/B1 corrected pulses. After correction of B0 and B1 inhomogeneities, as pointed by the arrows, the phantom image appeared more uniform, with an approximately 10% signal increase in the 2nd and 11th bands. However, a more sophisticated correction is necessary to compensate for rapid B1 variation within a single band. Note that the residual slab boundary artifacts visible in Figures 5c and 5d are mostly due to the sum of squares band combination, and may be reduced by using a weighted combination. The proposed method can also be applied to conventional multiband pulses for simultaneous multi-slice imaging.
Conclusion
We have developed a band-independent B0 and B1 inhomogeneity correction method for 2D multiband RF pulses by adjusting the center frequency and amplitude of the 2D RF pulses for each band. The proposed method can help avoid signal loss due to B0 and B1 variations and improve the signal homogeneity of the multiband images.Acknowledgements
Research support from R01-EB009055, P41-EB015891 and GE healthcare.References
[1] EI Khouli, Riham H., et al. "Diffusion-weighted Imaging Improves the Diagnostic Accuracy of Conventional 3.0-T Breast MR Imaging 1." Radiology256.1 (2010): 64-73.
[2] Taviani V, Alley MT, Banerjee S, Daniel BL, and Hargreaves BA. “High-resolution Diffusion-Weighted Imaging Using?Multiband 2D RF Pulses and a Generalized Parallel Imaging Reconstruction.” ISMRM Workshop on Simultaneous Multi-Slice Imaging: Neuroscience & Clinical Applications. Pacific Grove, CA, USA.
[3] Taviani, Valentina, et al. "High-resolution diffusion-weighted imaging of the breast with multiband 2D radiofrequency pulses and a generalized parallel imaging reconstruction." Magnetic resonance in medicine (2016).
[4] Saritas, Emine Ulku, et al. "DWI of the spinal cord with reduced FOV single-shot EPI." Magnetic resonance in medicine 60.2 (2008): 468-473.
[5] Winkler, Simone A., and Brian K. Rutt. "Practical methods for improving B1+ homogeneity in 3 tesla breast imaging." Journal of Magnetic Resonance Imaging 41.4 (2015): 992-999.
[6] Reeder, Scott B., et al. "Iterative decomposition of water and fat with echo asymmetry and least-squares estimation (IDEAL): application with fast spin-echo imaging." Magnetic resonance in medicine 54.3 (2005): 636-644.
[7] Sacolick, Laura I., et al. "B1 mapping by Bloch-Siegert shift." Magnetic Resonance in Medicine 63.5 (2010): 1315-1322.
Figures