3846
Evaluation of upper airway neuromuscular reflex and passive collapsibility using real-time multi-slice MRI during CPAP1University of Southern California, Los Angeles, CA, United States, 2Children's Hospital Los Angeles, Los Angeles, CA, United States
Synopsis
We demonstrate a new imaging test that uses simultaneous multi-slice real-time MRI during continuous positive airway pressure (CPAP) to quantify upper airway neuromuscular reflex and passive collapsibility. Both are measured using cross-sectional area fluctuation during abrupt changes to CPAP. We applied this test to patients with obstructive sleep apnea (OSA) and healthy controls. Subjects with OSA showed 3-5x higher airway area fluctuation compared to healthy volunteers, and this difference was statistically significant (p < 0.05). Neuromuscular reflex and area fluctuation varied greatly among the OSA patients, suggesting a potential spectrum of active/physiological and passive/anatomical factors contributing to OSA.
Purpose
Obstructive sleep apnea (OSA) is a heterogeneous disorder characterized by repetitive upper airway (UA) collapse during sleep. Key pathophysiologic causes likely include airway collapsibility and muscle responsiveness 1. Previous studies have evaluated passive collapsibility using Mueller maneuver (MM) to apply inspiratory load 2. However, MM is inherently unable to identify all types of collapse 3. Continuous positive airway pressure (CPAP) acts as a pneumatic splint to prevent upper airway collapse and is the most efficacious treatment for OSA to date 4. CPAP can be used to evaluate physiological traits by recording ventilation changes during polysomnography 5. In this study, we apply a recently-developed simultaneous multi-slice (SMS) real-time (RT) MRI technique 2 to quantify UA changes, by alternating CPAP level between therapeutic and sub-therapeutic levels. This experiment, for the first time, enables direct measurement of active and passive factors in airway contributing to OSA, enables visualization of airway dynamics, and potentially reveals specific pathways lead to the disease.Methods
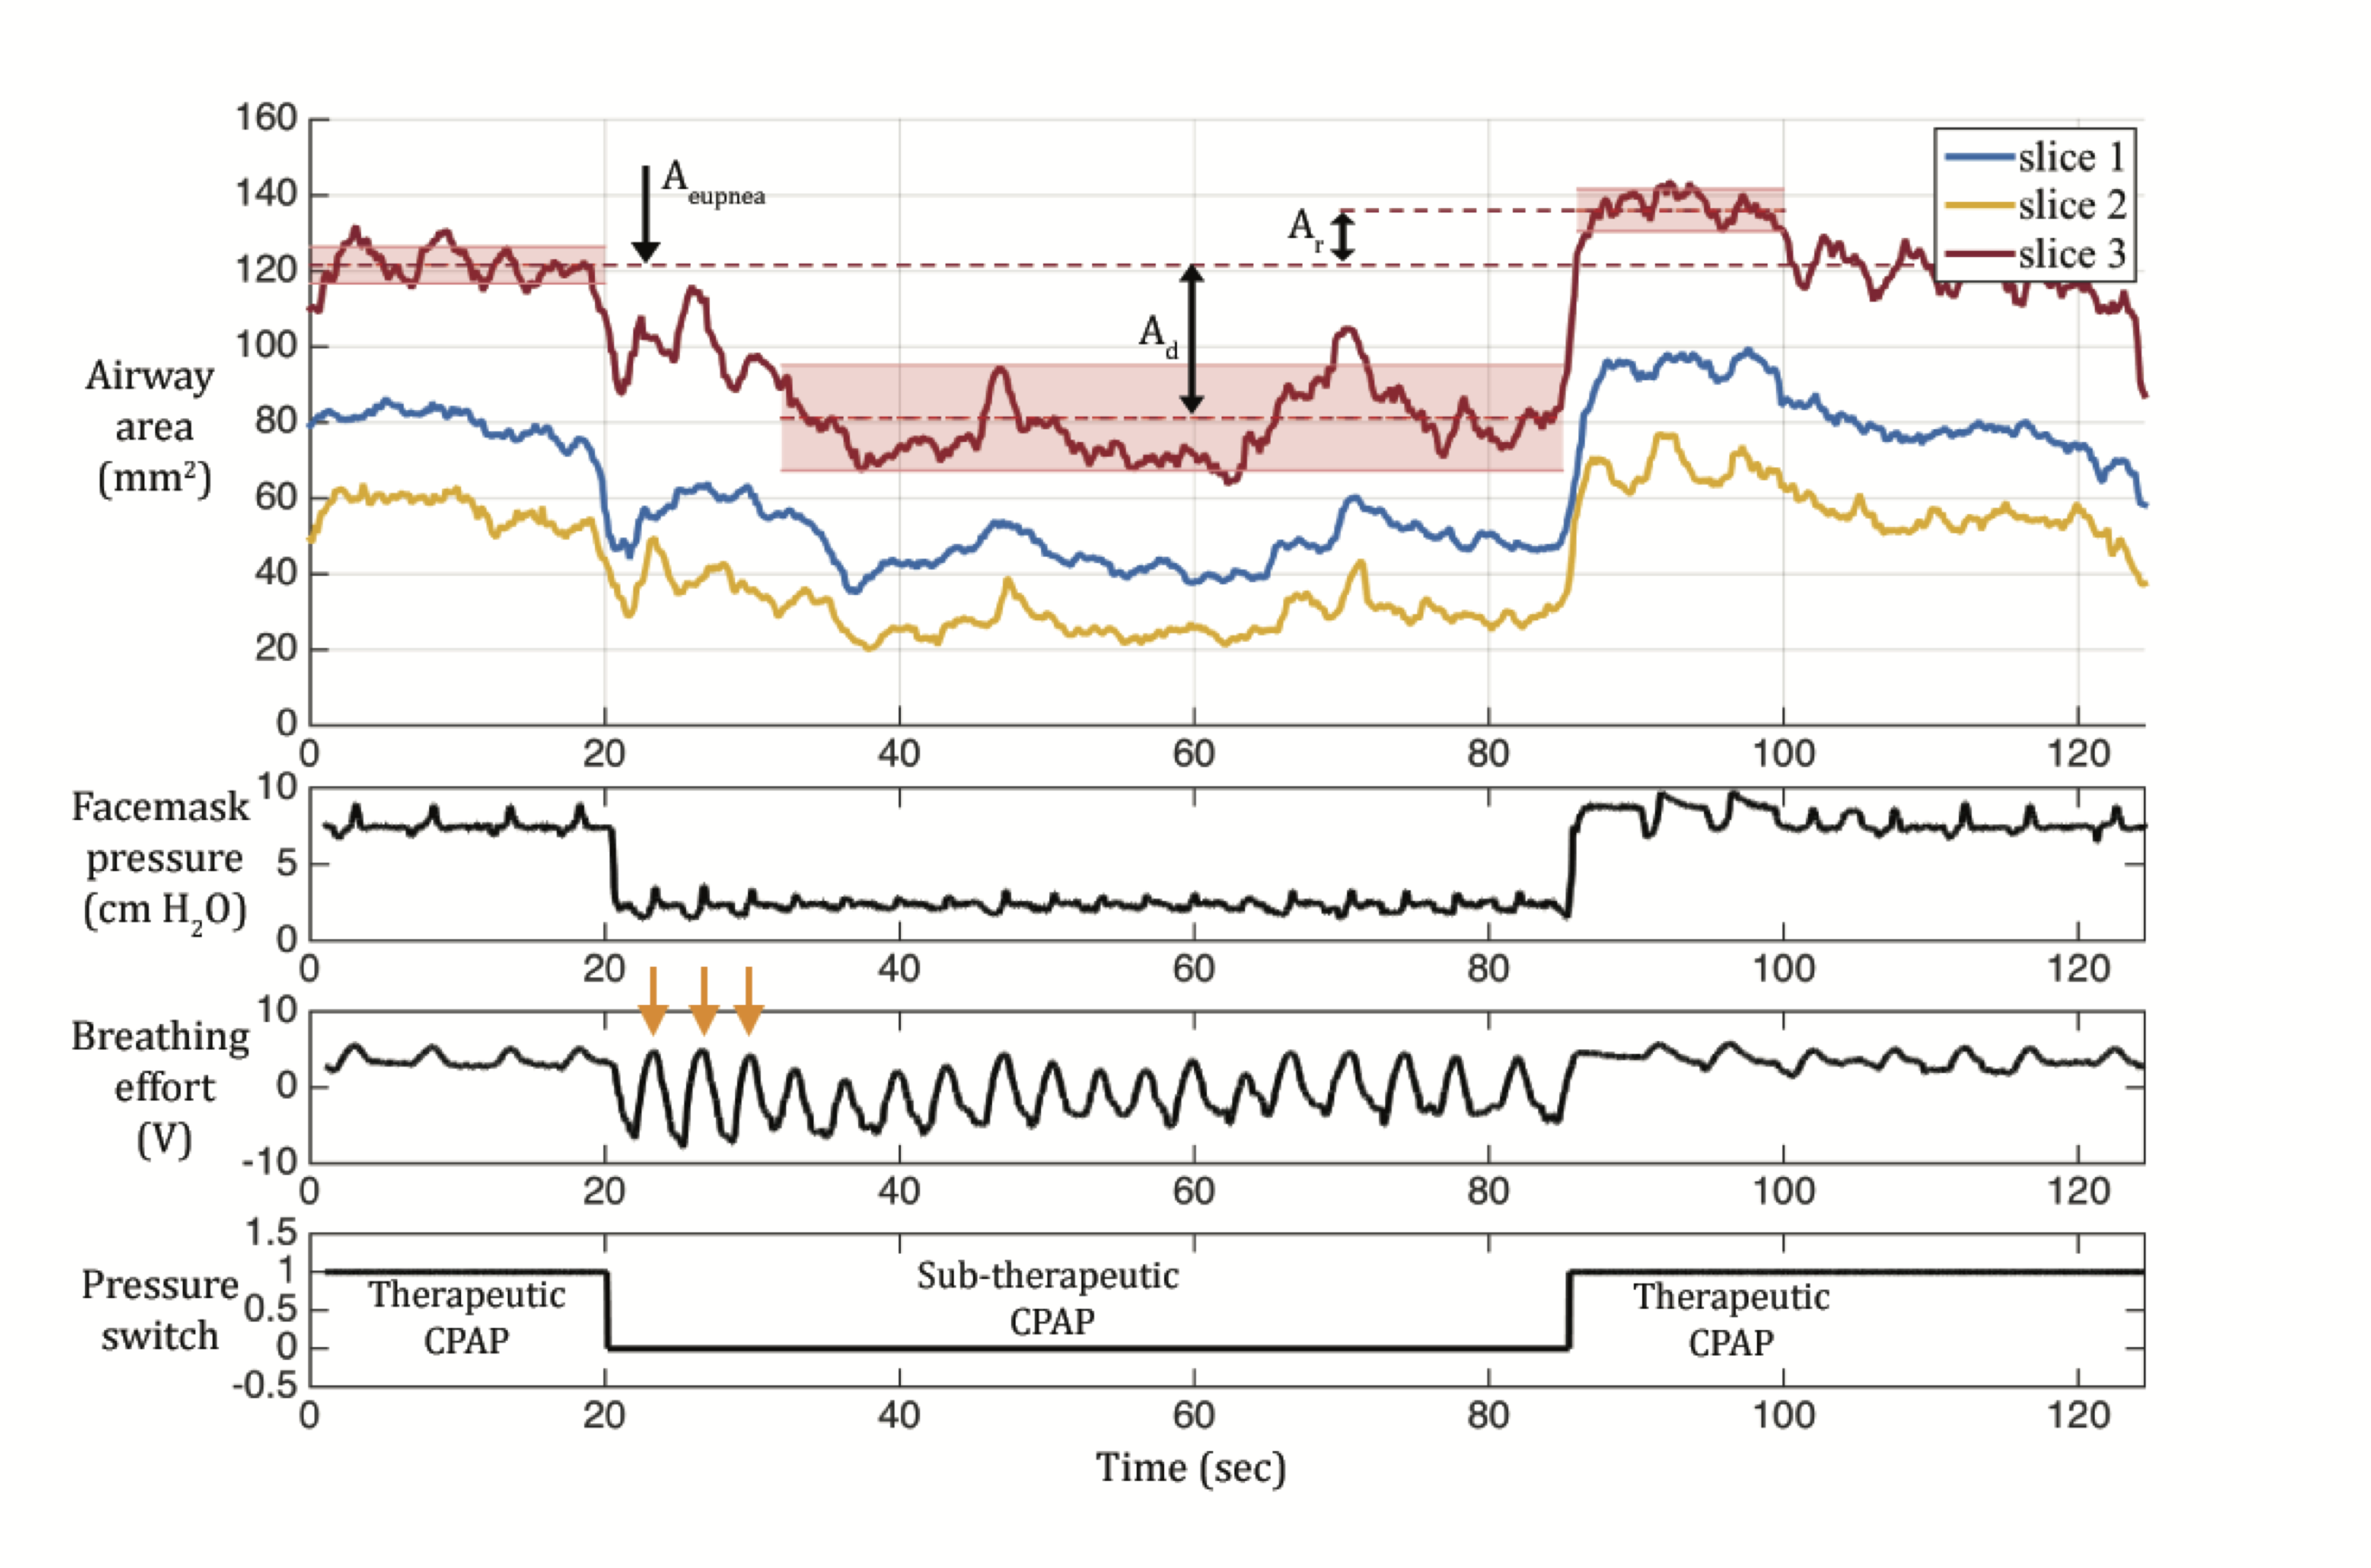
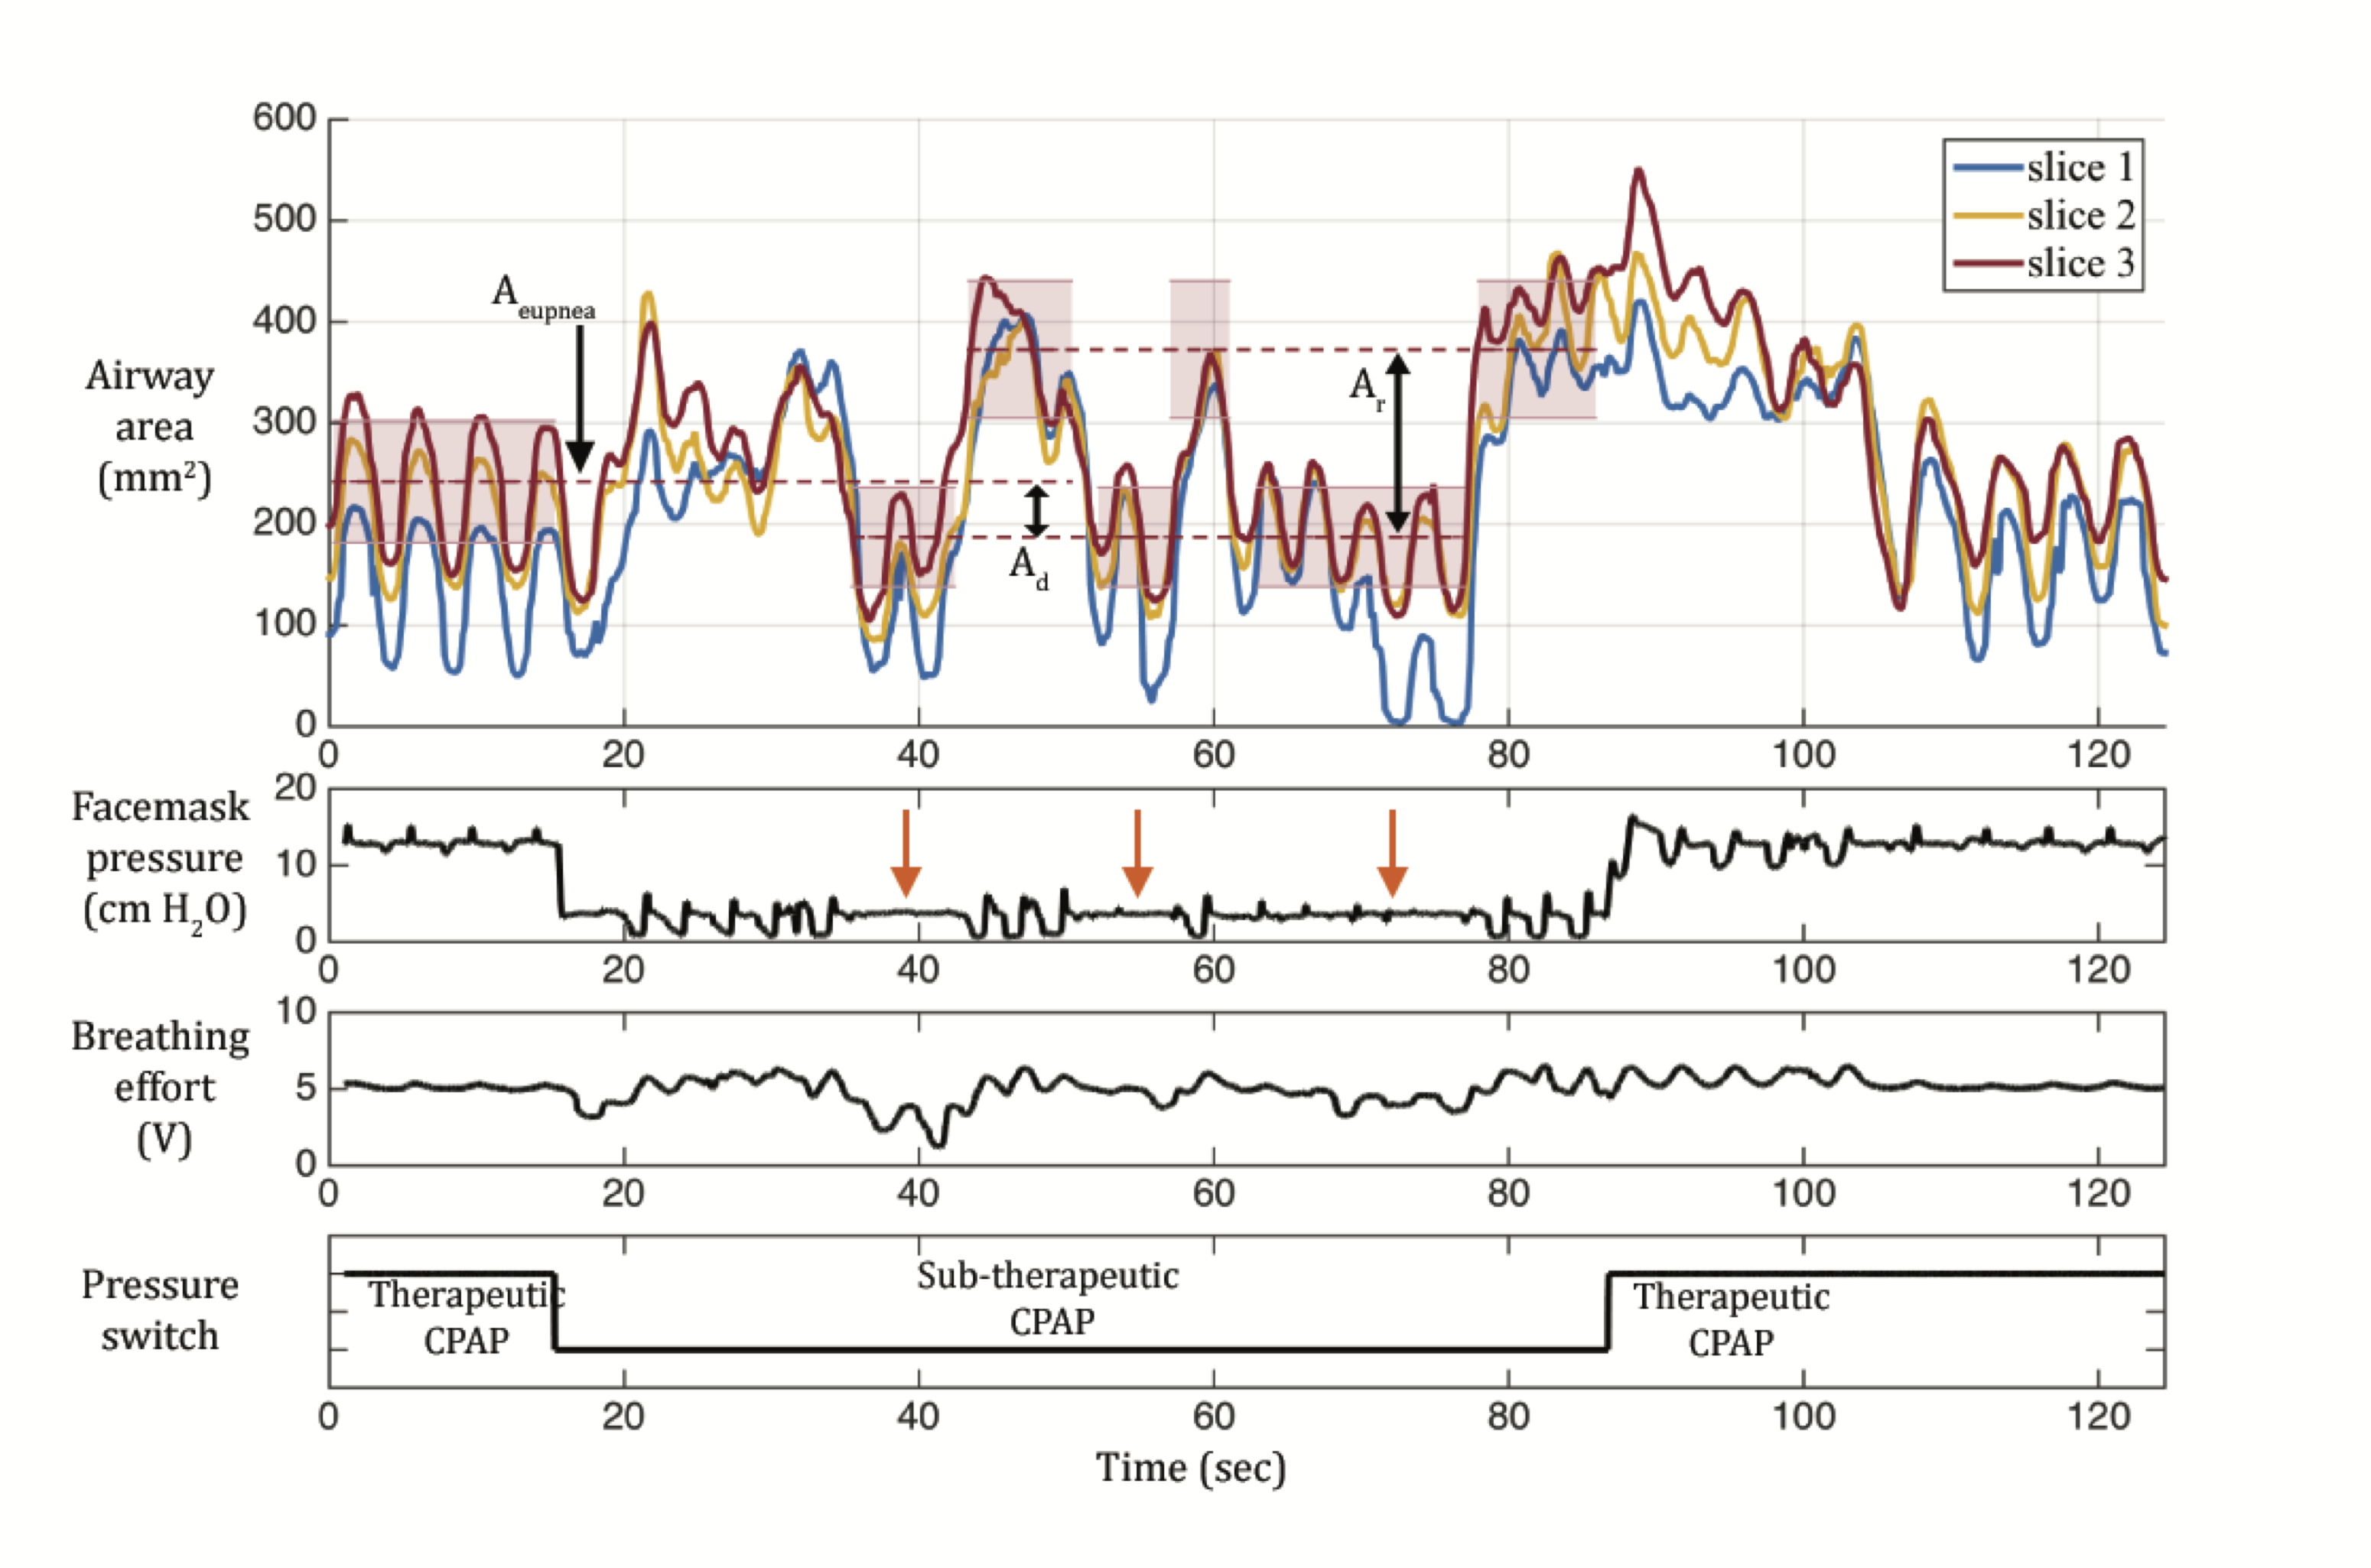
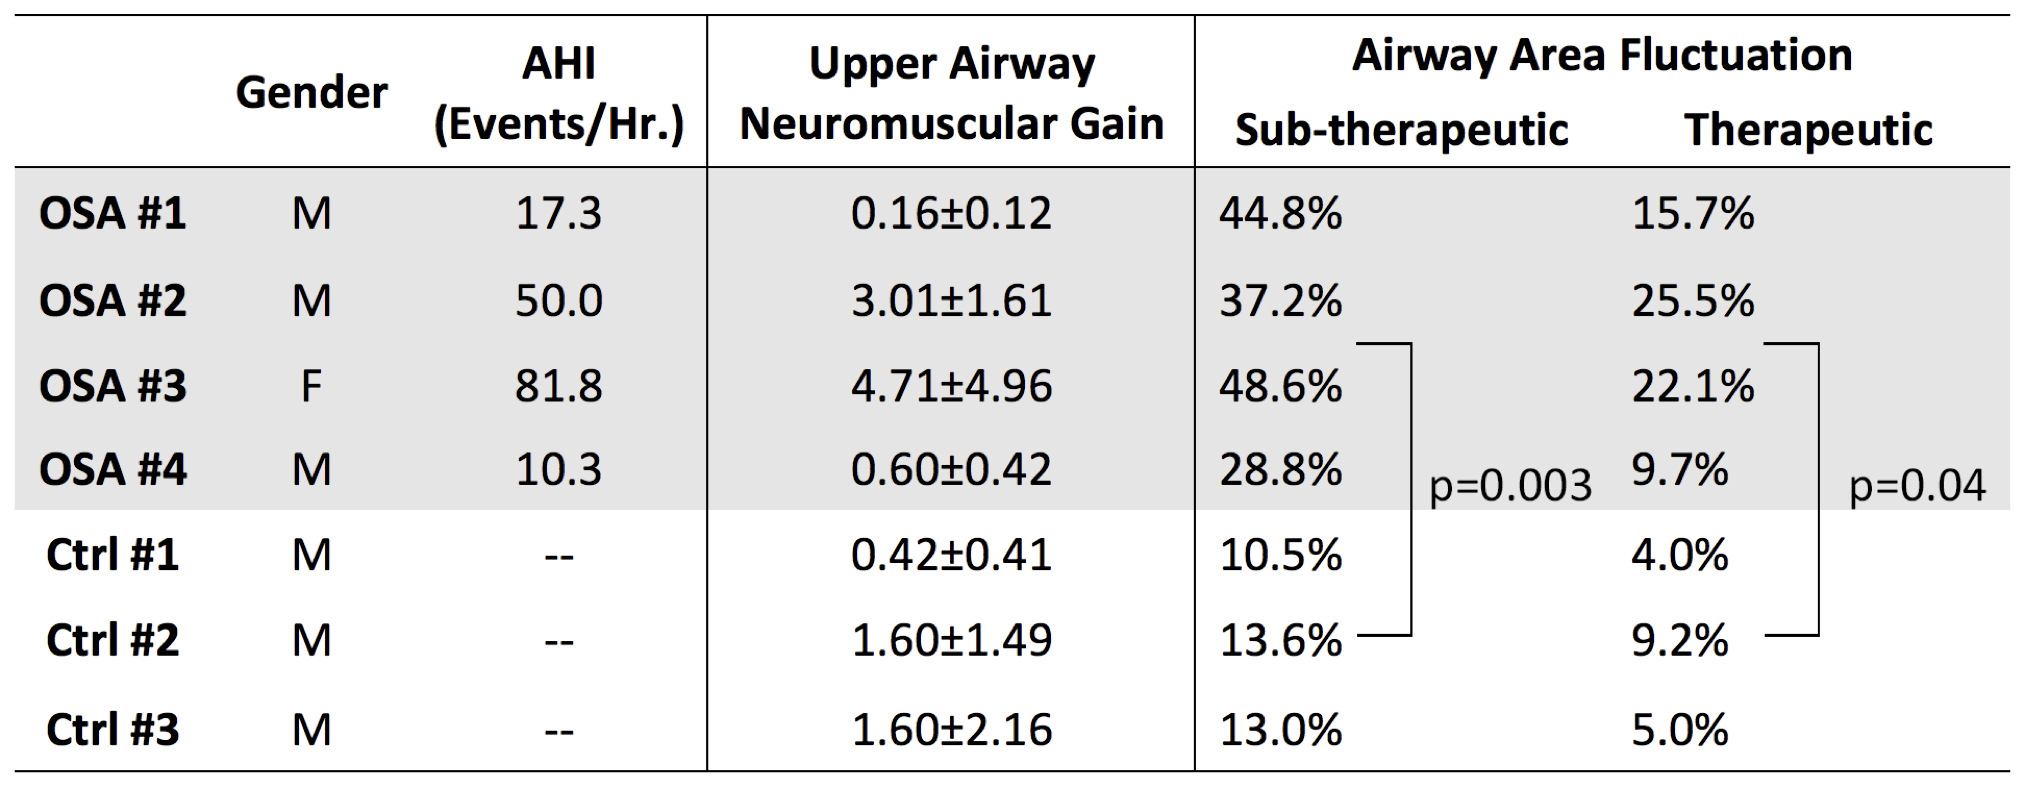
Experiments: Four adolescent OSA patients (3M/1F), and 3 healthy volunteers (3M) were studied. We simultaneously collected physiological signals 7. The facemask was connected to a CPAP machine in the MRI control room. CPAP level was alternated between a pre-titrated therapeutic and a sub-therapeutic level 5,7, as shown in Figure 1. One OSA patient and one healthy volunteer were removed and re-placed into the scanner to test reproducibility.
Acquisition: Experiments were performed on a GE EXCITE HD23 3T clinical scanner with a 6-ch carotid coil. We acquired images with a SMS golden angle radial CAIPIRINHA fast GRE sequence 2,7, providing 1mm in-plane spatial resolution and 3 simultaneous slices, with 96ms temporal resolution.
Data Analysis: We used a semi-automated region growing algorithm to segment the airway. Upper airway neuromuscular gain (UAMG) represents the stability of neuromuscular reflex system to recover from sudden ventilation reduction. UAMG was calculated as the ratio of the reopen Ar to the area drop Ad, marked in Figures 1 and 2. The fluctuation of airway area (FAA) represents the passive collapsibility of upper airway. FAA was calculated as the standard deviation of airway area normalized by the mean value, in therapeutic and sub-therapeutic sections, respectively. We used Student’s t-test to estimate the statistical difference in UAMG and FAA between the 2 groups. Intra-class correlation (ICC) was calculated to estimate the test-retest reproducibility.
Results
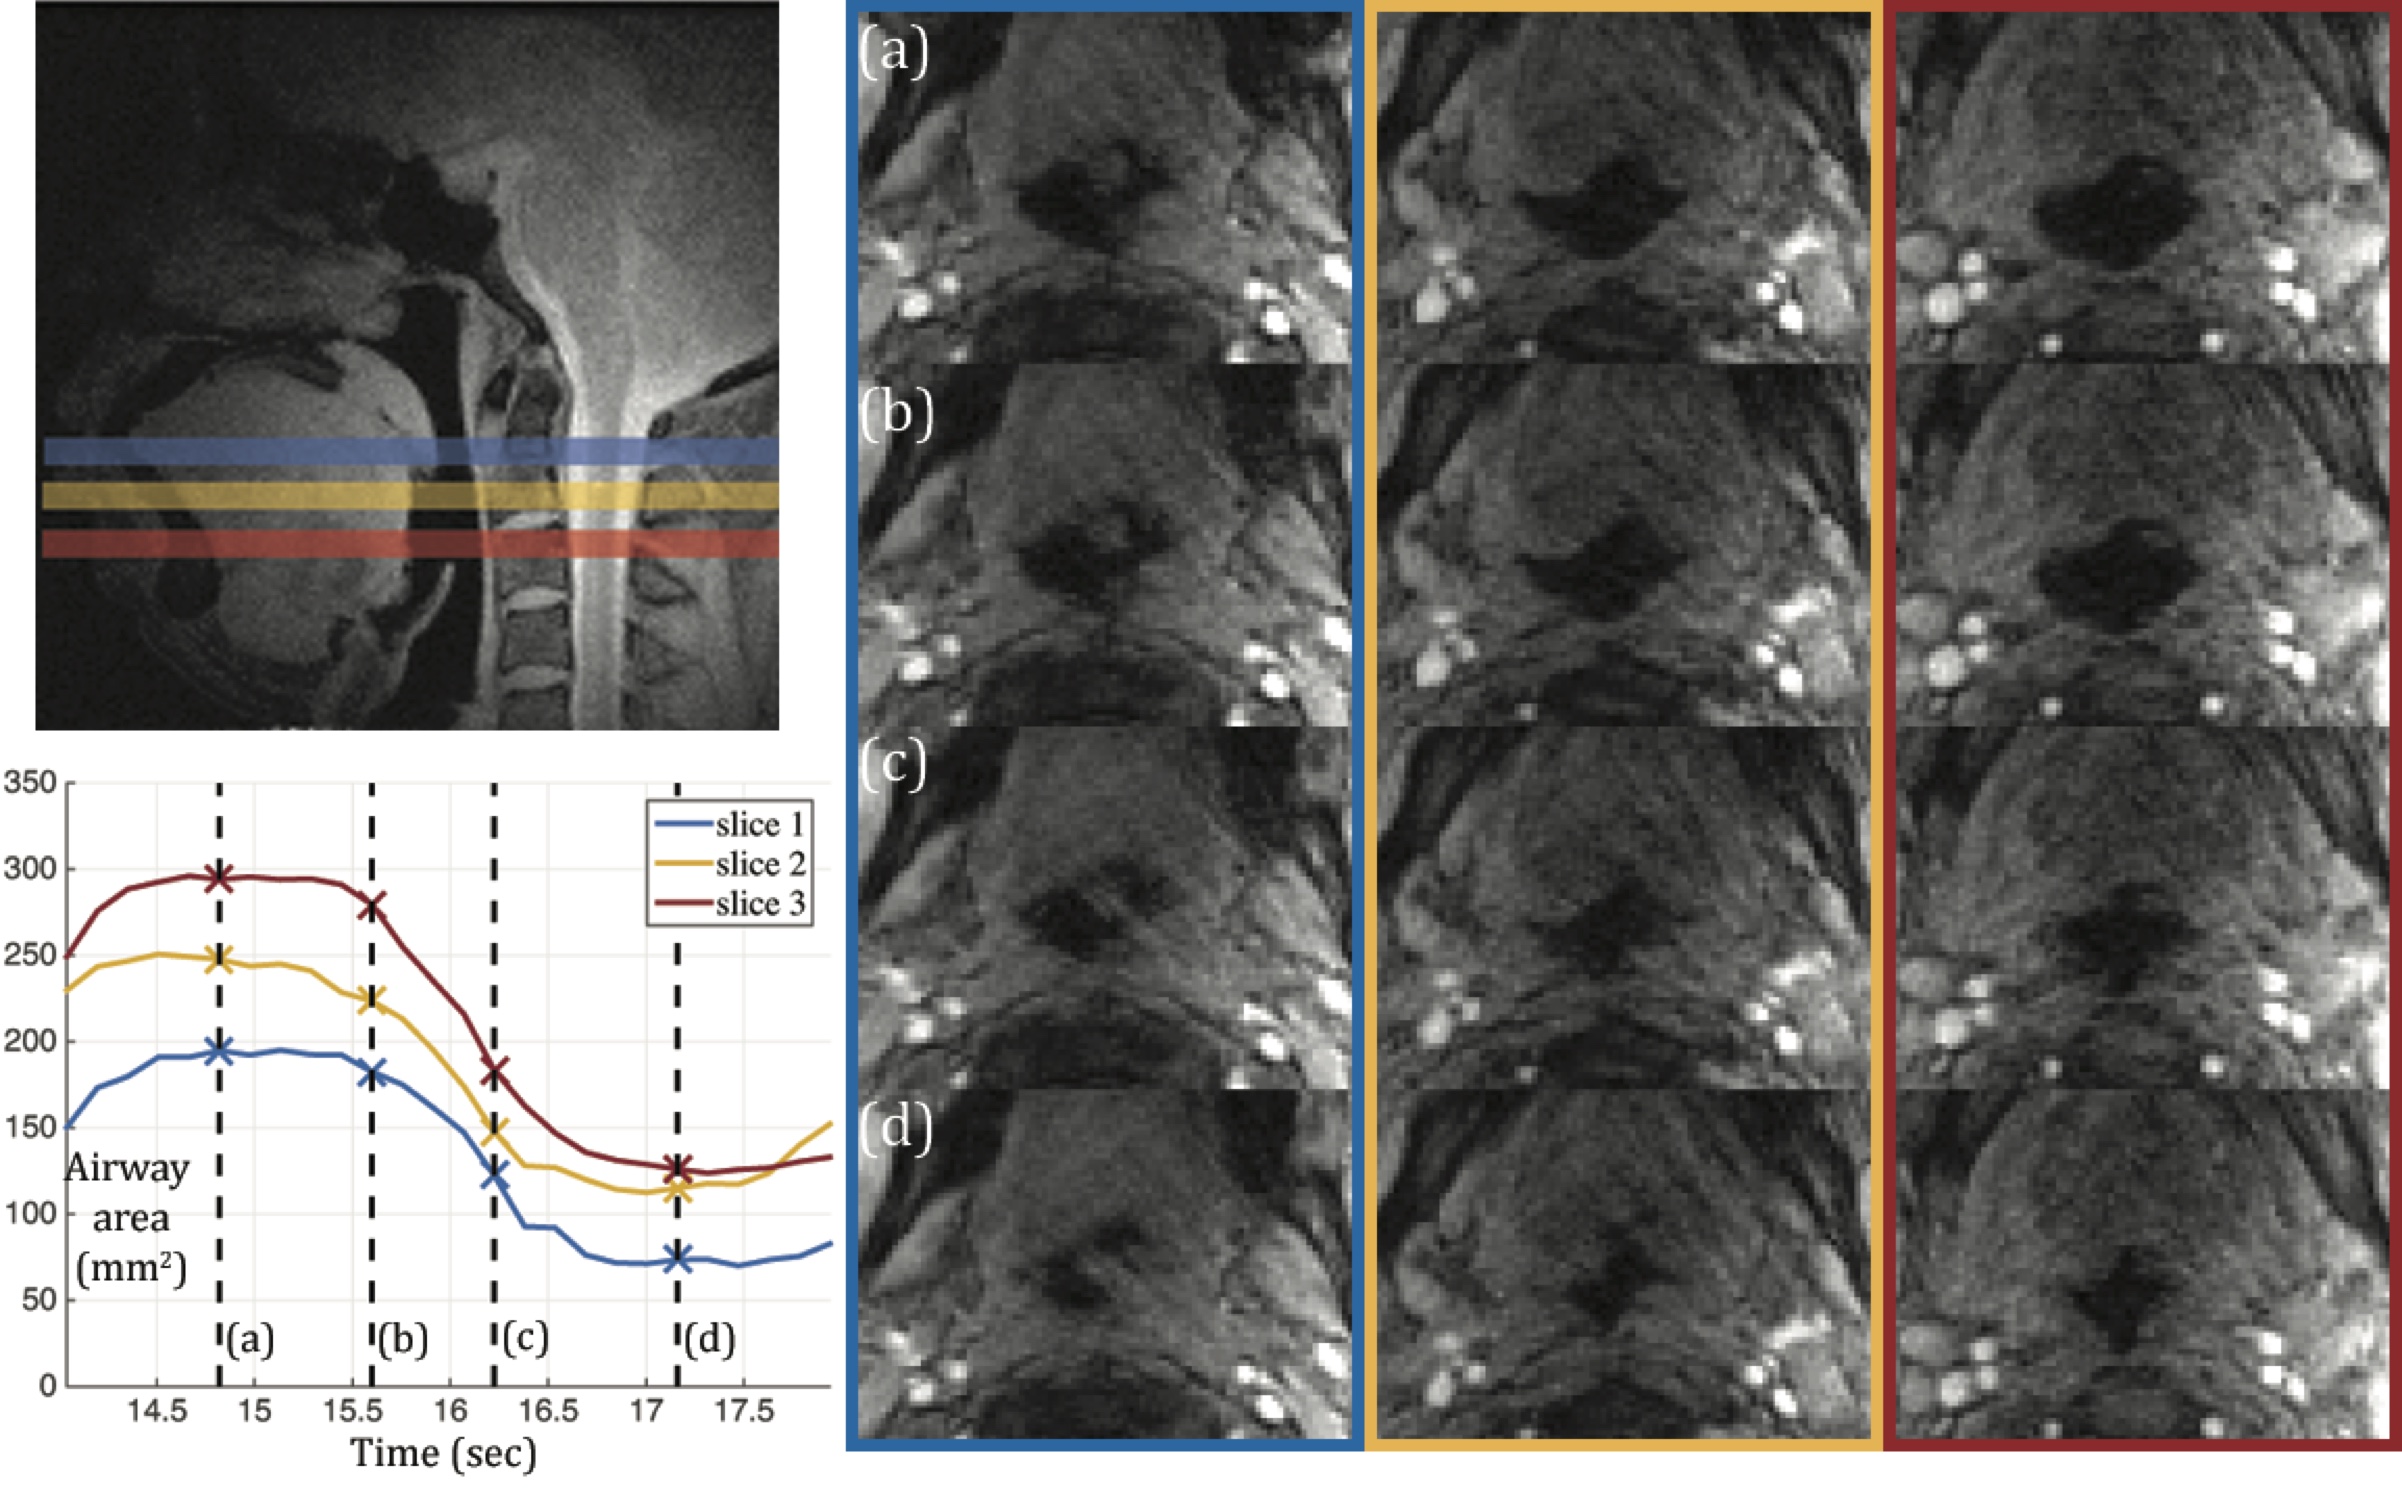
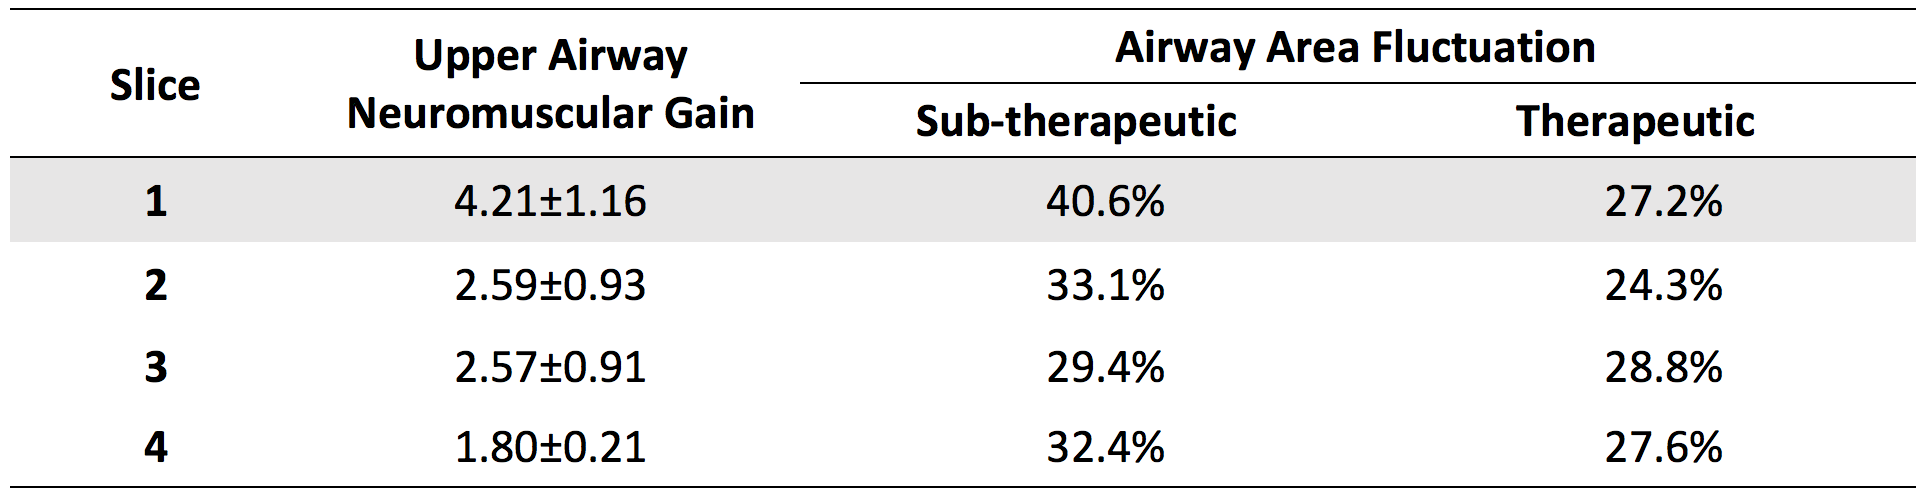
Figures 1 and 2 contain representative results from a control and a patient with OSA (male, AHI 50.0), respectively. Figure 3 shows example dynamic MRI images during a CPAP drop from the same data set in Figure 2. Table 1 lists the UAMG and FAA for all subjects. The OSA group had more severe FAA (P<0.05), compared to that of the control group. This suggests that OSA patients in the cohort possess more passive airways with greater collapsibility. There was no significant difference between the 2 groups for UAMG. Table 2 lists representative results from 4 distinct slices from the OSA patient in Figure 2, and illustrates the variation in both UAMG and FAA among different airway sites. ICC for both UAMG and FAA are larger than 0.7.Discussion
Polysomnography with AHI output 4,5 estimates the severity of OSA, but cannot localize the specific airway sites that are more prone to collapse. The proposed experiment can directly measure active (UAMG) and passive (FAA) traits with specific airway location, and simultaneously visualizing collapse dynamics. OSA 2,3 had 3-8x larger UALG than OSA 1,4, and OSA 1,2,3 had 1.5-3x larger FAA than OSA 4. These large variations may be due the spectrum of OSA. OSA 2,3 may have over-sensitive airway dilator muscles; OSA 1,2,3 may possess more collapsible airways. We observed subjects who remained awake would introduce extra variability for UAMG measurement. We speculate this is due to different neuromuscular mechanisms during wakefulness, stiffer muscle tone and airway motion by swallowing. We observed large intra-subject variation, for examples, OSA 2 slice 1 has the largest value for both UAMG and FAA. This indicates Slice 1 is likely to be the most collapsible site, and therefore has higher priority for treatment. These observations reinforce the need for personalized treatment for OSA patients 8.Conclusion
We demonstrate a novel experiment that simultaneously measures upper airway active and passive traits impacting OSA, potentially enables detailed phenotyping for OSA patients. By performing SMS RT-MRI during CPAP, we demonstrate the proposed experiment can help locate the most collapsible airway sites, with specific possible reasons (anatomical or physiological). This study also confirms that OSA is a heterogeneous disorder.Acknowledgements
GRANT SPONSOR: NIH R01-HL105210.References
1. Eckert, D. J., White, D. P., Jordan, A. S., Malhotra, A. & Wellman, A. Defining phenotypic causes of obstructive sleep apnea: Identification of novel therapeutic targets. Am. J. Respir. Crit. Care Med. 188, 996–1004 (2013).
2. Wu, Z., Chen, W., Khoo, M. C. K., Davidson Ward, S. L. & Nayak, K. S. Evaluation of upper airway collapsibility using real-time MRI. J. Magn. Reson. Imaging 44, 158–167 (2016).
3. Fujita, S. in Obstructive Sleep Apnea Syndrome: Clinical Research and Treatment. (eds. Guilleminault, C. & Partinen, M.) 129–151 (Raven Press, 1990).
4. Semelka, M., Wilson, J. & Floyd, R. Diagnosis and Treatment of Obstructive Sleep Apnea in Adults. Am. Fam. Physician 94, 355–360 (2016).
5. Edwards, B. a et al. Obstructive Sleep Apnea in Older Adults is a Distinctly Different Physiological Phenotype. Sleep 37, 1227–1236 (2014).
6. Chen, W., Wu, Z., Ward, S. L. D., Khoo, M. C. K. & Nayak, K. S. Real-time multi-slice MRI during CPAP reveals dynamic changes in upper airway in response to pressure change. in ISMRM 24th Scientific Sessions 698 (2016).
7. Pack, A. I. Application of Personalized, Predictive, Preventative, and Participatory (P4) Medicine to Obstructive Sleep Apnea. A Roadmap for Improving Care? Ann. Am. Thorac. Soc. 13, 1456–1467 (2016).
Figures