3838
Simultaneous Multislice MRF with Hadamard RF-Encoding1Biomedical Engineering, Case Western Reserve University, Cleveland, OH, United States, 2Radiology, Case Western Reserve University, Cleveland, OH, United States, 3Radiology, Massachusetts General Hospital, Athinoula A. Martinos Center for Biomedical Imaging, Charlestown, MA, United States, 4Radiology, University Hospitals, Cleveland, OH, United States
Synopsis
Relaxation times can be measured efficiently with Magnetic Resonance Fingerprinting (MRF) but further acceleration of MRF is difficult as individual images are already highly undersampled. In this study Hadamard RF-encoding is utilized to acquire four slices simultaneously. It is demonstrated that the proposed method can provide T1 and T2 maps for simultaneously acquired slices at 2mm slice thickness.
Purpose
Magnetic Resonance Fingerprinting (MRF) provides an efficient way to simultaneously quantify multiple parameters, such as T1, T2, off-resonance, and proton density1. The original implementation utilized a 2D slice-selective acquisition. A desirable step forward would be the ability to acquire multiple slices simultaneously in order to reduce scan time. It has been demonstrated that the radio frequency (RF) phase can be designed to help encoding and slice separation2,3,4. The proposed method utilizes Hadamard RF-encoding in the MRF framework to accelerate the acquisition and improve spatial resolution in the slice direction to 2mm, providing quantitative parameter information from multiple slices.Methods
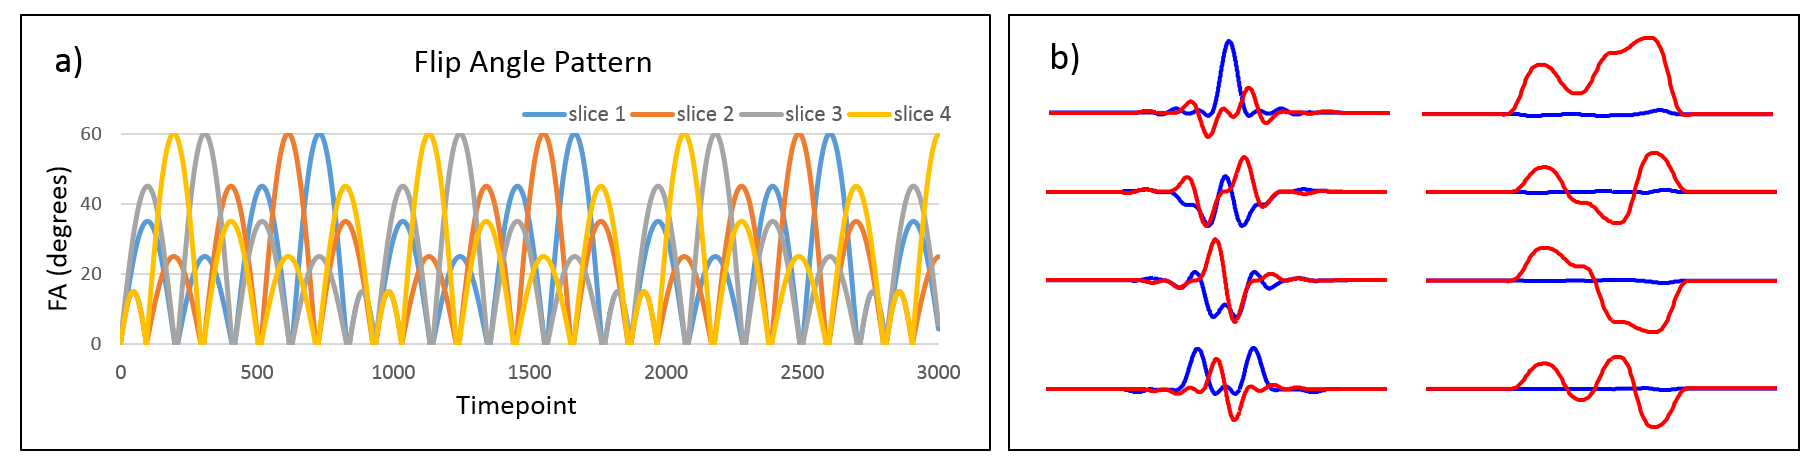
A Fast Imaging with Steady State Precession (FISP)-based MRF sequence was recently demonstrated to be able to provide T1, T2, and proton density (PD) maps5. This sequence was modified for simultaneous multislice experiments with the following parameters: 3000 frames, matrix size 256 x 256, field-of-view (FOV) 300mm. A uniform density spiral trajectory that needs 48 arms to fully sample the k-space is used, with only one spiral arm sampled per frame. A multiband RF pulse was designed to excite four adjacent slices simultaneously with variable flip angles (FA) for each slice at each time point. Flip angles are varied smoothly between 0 and 60 degrees for each slice. They are designed with an interleaved pattern between slices to reduce the peak RF amplitude, which has a maximum flip angle of 120.33 degrees3 (Fig. 1a). TR is kept constant at 10ms. An MRF dictionary was built for each flip angle pattern using Bloch Equation simulations of 5098 T1 and T2 combinations, leading to a dictionary of dimensions 3000 timepoints x 5098 T1 and T2 combinations. In order to separate slices simultaneously acquired, a phase modulation was added to the RF pulse to incorporate Hadamard RF-encoding. An example of these RF pulses and their corresponding slice profiles are shown in Figure 1b.
All experiments were performed on a Siemens Skyra 3T scanner (Siemens AG Healthcare, Erlangen, Germany) with a 16-channel head receiver array. First, to validate relaxometry accuracy and precision, the method was tested on the ISMRM/National Institute of Standards and Technology (NIST) MRI system phantom6,7. Four slices of 2mm thickness were acquired simultaneously on the T2 array layer of the phantom. Applying a Hadamard matrix to the simultaneously acquired data, the four slices’ signals were separated, reconstructed, and matched to the appropriate MRF dictionary, providing T1 and T2 maps. Regions of interest (ROIs) were drawn for the 14 samples in the phantom in all slices. Mean and standard deviation of T1 and T2 values were calculated from the SMS acquisitions.
The method was then applied in vivo in a healthy volunteer after informed consent under an approved IRB protocol. Using the same multiband pulses, 2mm slices are acquired simultaneously with the Hadamard RF-encoding. The slices are separated and matched in the same manner as mentioned above. Regions of interest (ROIs) were drawn for gray matter (GM) and white matter (WM) regions in all slices. Mean and standard deviation of T1 and T2 values were calculated for GM and WM.
Results
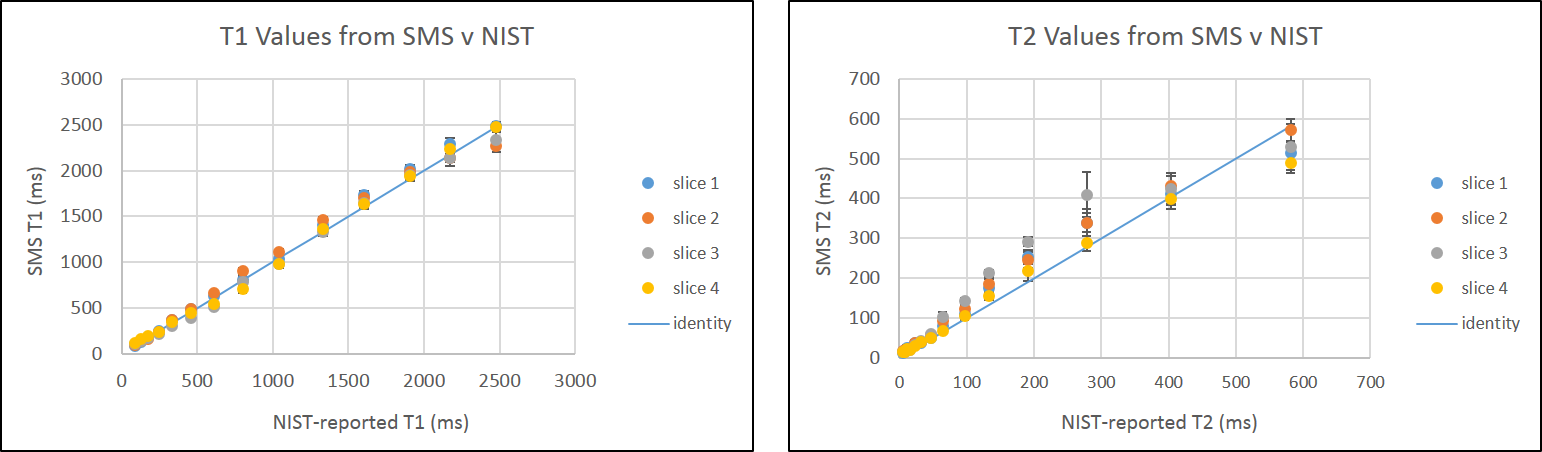
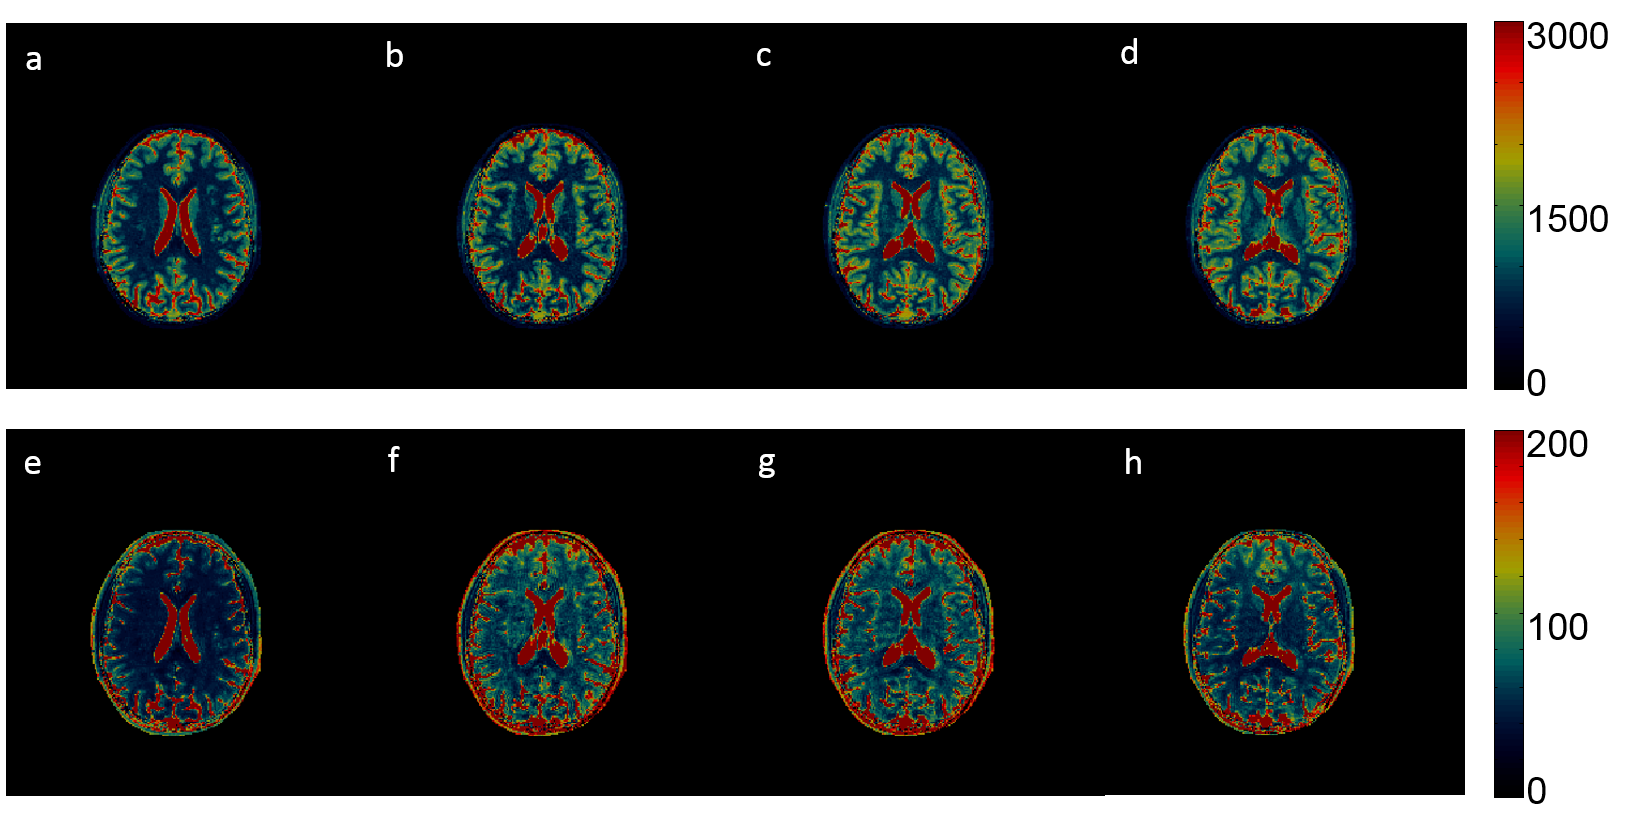
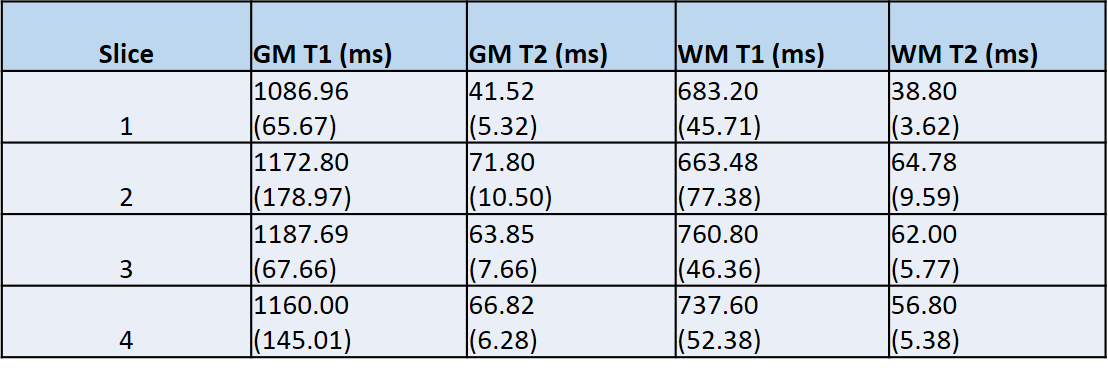
Figure 2 shows the T1 and T2 mean values and standard deviation comparison between those that NIST reported and those acquired using the simultaneous acquisitions. T1 values are in good agreement. T2 values are systematically overestimated, but those in the physiological range are in decent agreement with NIST. Figure 3 shows maps for all four slices acquired from the simultaneous acquisitions. T1 and T2 mean values and standard deviations for GM and WM are reported in Figure 4.Discussion
Hadamard RF-encoding was successfully integrated into an MRF framework. By modulating the RF phase between acquisitions, slice profiles were Hadamard-encoded and signal evolutions from multiple slices could be separated. With 2mm slices, this work approaches near-isotropic resolution as compared to the original MRF-FISP. The in vivo T2 values are slightly lower than those in the literature8. This is thought to be due to slice profile effects. To correct for these, a future step is to simulate the slice profile into the dictionary and correct for it during the matching process. Another goal will be to incorporate iterative reconstruction algorithms to reduce the number of images required without sacrificing map quality. Further acceleration of MRF will also be investigated by condensing Hadamard encoding into two or one acquisitions, rather than four.Acknowledgements
This work is supported by Siemens Healthcare, National Science Foundation Graduate Research Fellowship Program under grant number DGE-1451075, and NIH grants 1R01EB016728-01A1 and 5R01EB017219-02.References
1. Ma et al. Magnetic Resonance Fingerprinting. Nature 2013; 495(7440):187-192.
2. Setsompop et al. Generalized SLIce Dithered Enhanced Resolution Simultaneous MultiSlice (gSlider-SMS) to increase volume encoding, SNR and partition profile fidelity in high-resolution diffusion imaging. In: Proceedings from the International Society for Magnetic Resonance in Medicine; May 7- May 13, 2016; Singapore. Abstract 0607.
3. Jiang et al. Use of pattern recognition for unaliasing simultaneously acquired slices in Simultaneous MultiSlice Magnetic Resonance Fingerprinting. In: Proceedings from the International Society for Magnetic Resonance in Medicine; May 30- June 5, 2015; Toronto, CA. Abstract 0105.
4. Souza et al. SIMA: simultaneous multislice acquisition of MR images by Hadamard-encoded excitation. Journal of Computer Assisted Tomography. 1988; 12(6): 1036-30.
5. Jiang et al. MR Fingerprinting using Fast Imaging with Steady State Precession (FISP) with Spiral Readout. Magnetic Resonance in Medicine. 2015; 74(6):1621-31.
6. Russek SE, et al. Characterization of NIST/ISMRM MRI System Phantom. In: Proceedings of the International Society for Magnetic Resonance in Medicine; May 5- May 11, 2012; Melbourne. Abstract 2456.
7. Kathryn E Keenan et al. Multi-site, multi-vendor comparison of T1 measurement using ISMRM/NIST system phantom. In: Proceedings of the International Society for Magnetic Resonance in Medicine; May 7- May 13, 2016; Singapore. Abstract 3290.
8. Wansapura JP et al. NMR relaxation times in the human brain at 3.0 tesla. Journal of Magnetic Resonance Imaging. 1999; 9(4): 531-8.
Figures