3835
Quantitative Susceptibility Mapping Using 2D Simultaneous Multi-slice Gradient-echo Imaging at 7T1Department of Radiology, Stanford University, Stanford, CA, United States, 2Department of Electrical Engineering, Stanford University, Stanford, CA, United States, 3Department of Neurology and Neurological Sciences, Stanford University, Stanford, CA, United States, 4Department of Radiology, Weill Cornell Medical College, New York, NY
Synopsis
A 2D multi-echo simultaneous multi-slice (SMS) gradient-echo imaging sequence was implemented for simultaneous anatomical imaging, R2* mapping and quantitative susceptibility mapping (QSM). Imaging acceleration in the slice direction speeds up the sequence to clinical scan times while using a longer TR and larger flip angle compared to 3D imaging. Evaluation from both healthy and multiple sclerosis subjects showed that, using the same acquisition time and imaging resolution as a 3D sequence, the proposed sequence improved tissue susceptibility contrast, suggesting 2D SMS GRE imaging may be a viable alternative for clinical applications of susceptibility-based imaging.
Introduction
Quantitative susceptibility mapping (QSM) is a useful tool for tissue susceptibility measurement. Its superior sensitivity to myelin and iron makes it useful in the evaluation of brain diseases such as multiple sclerosis (MS)1. Although QSM is often performed with 3D imaging to achieve small pixel size with high signal to noise ratio (SNR) while accelerating in the slice direction, 2D imaging also produces excellent gray-white contrast on magnitude and QSM images2. This is because that interleaved multi-planar acquisition in 2D imaging allows a much longer TR and flip angle than 3D imaging. With the advent of simultaneous multi-slice (SMS) imaging, 2D imaging can be accelerated through slice as well by exciting multiple slices simultaneously. The purpose of this study is to implement a 2D multi-echo SMS gradient-echo sequence to perform high-resolution magnitude imaging, R2* mapping, and QSM, and compare it to a 3D sequence.Methods
Subjects: Eight healthy volunteers (age 30.6±4.8) and one MS patient (age 29) were scanned in accordance with IRB and HIPAA.
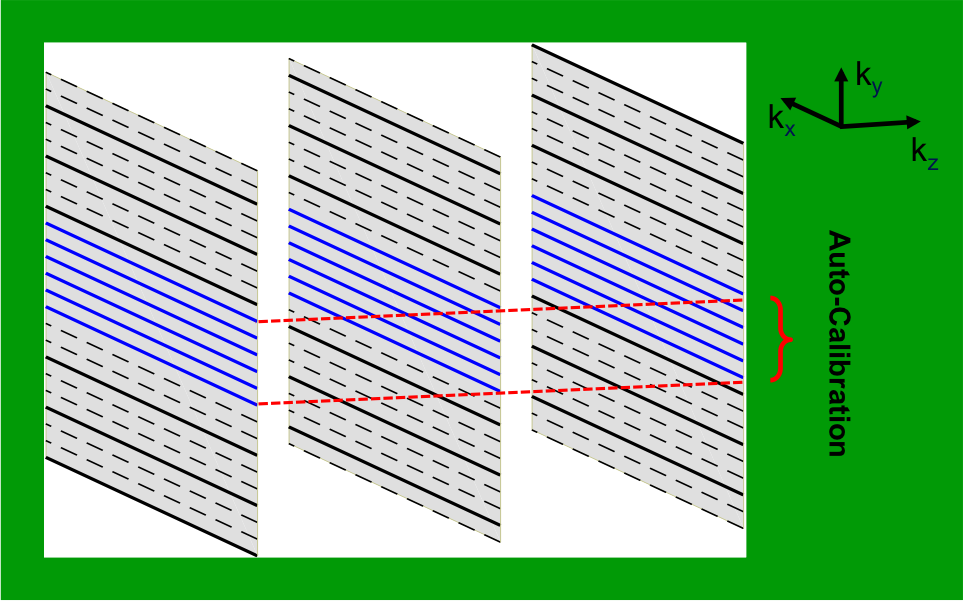
MR Imaging: a VERSE RF pulse was phase modulated and combined to excite multiple slices simultaneously for 2D SMS imaging3. The sampling scheme of the sequence is shown in Figure 1. For the 3D comparison, a product multi-echo 3D gradient-echo sequence was used. All imaging was performed on a GE 7T scanner with a 32-channel coil. Both the 2D SMS and 3D imaging were axially acquired using the same following parameters: FOV=22cm, resolution=0.5x0.5x1.5mm3, slice number=72, bandwidth=41.7KHz, and echo number=4. The TEs, TR and flip angle of the 2D imaging were 8.2/15.5/22.7/30ms, 1000ms, and 60°, while those of 3D were 5.9/12.9/19.9/26.9ms, 32ms, and 15°. Three slices were simultaneously excited in the SMS imaging with in-plane GRAPPA acceleration factor of 2. The 3D imaging was accelerated by in-plane ASSET factor of 2.75 and 70% partial Fourier through slice. The total acquisition time was 4.5 minutes for both 2D and 3D imaging.
Image processing: SMS images were reconstructed using a Slice-GRAPPA algorithm4. The raw phase images from each coil were Laplacian unwrapped and then background removed using PDF5, finally combining by magnitude weighting for each echo. For 3D imaging, the raw phase images from each coil were combined by the scanner console, and unwrapped and background removed as above. The phase images from all echoes were averaged (weighted by TE) for QSM reconstruction using MEDI6. R2* maps were generated by linearly fitting magnitude image signal from each echo after log transformation. The magnitude images were combined from all echoes using root mean square.
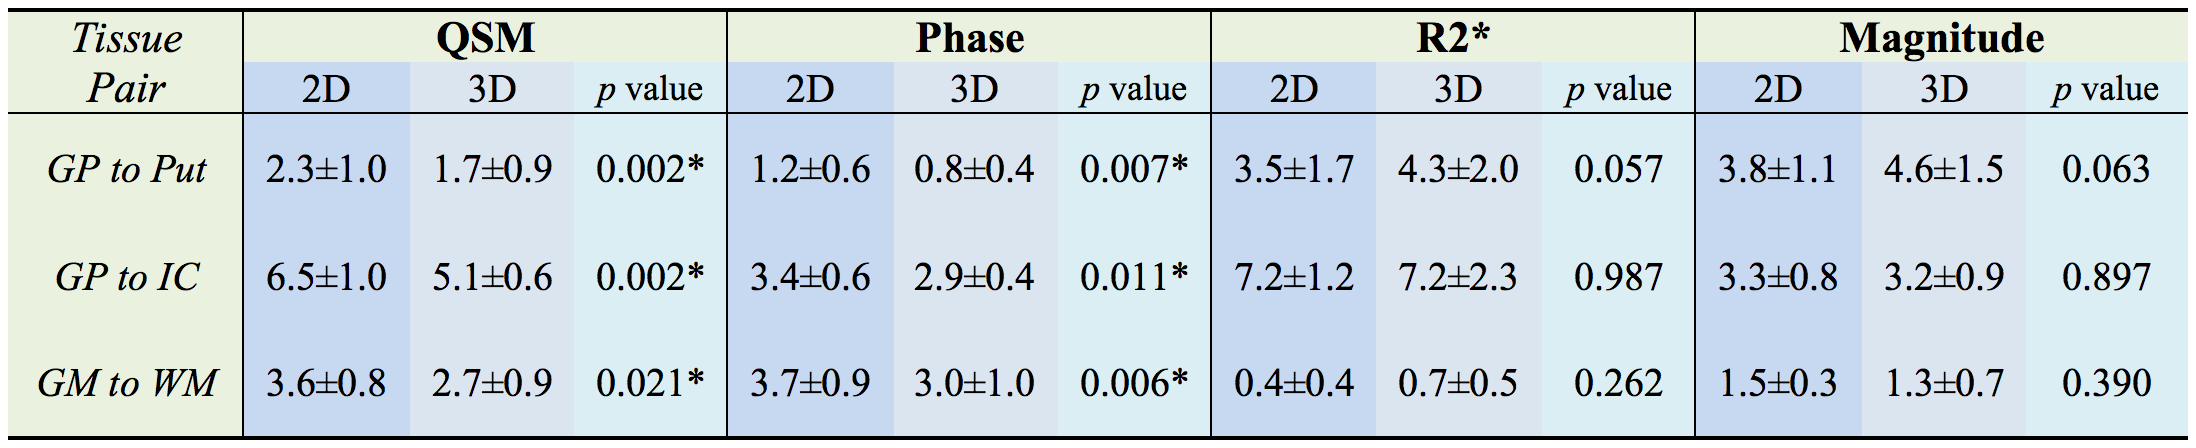
Data Analysis: The regions of interest (ROI) were manually defined for all volunteers on phase images (Figure 3). The CNRs of the Globus Pallidus/Putamen to Internal Capsule and the cortical gray to white matter (along the superior frontal sulcus) were calculated by dividing the difference in mean values between the two ROIs by the standard deviation of the latter. CNRs between the 2D and 3D were compared by a paired t-test.
Results
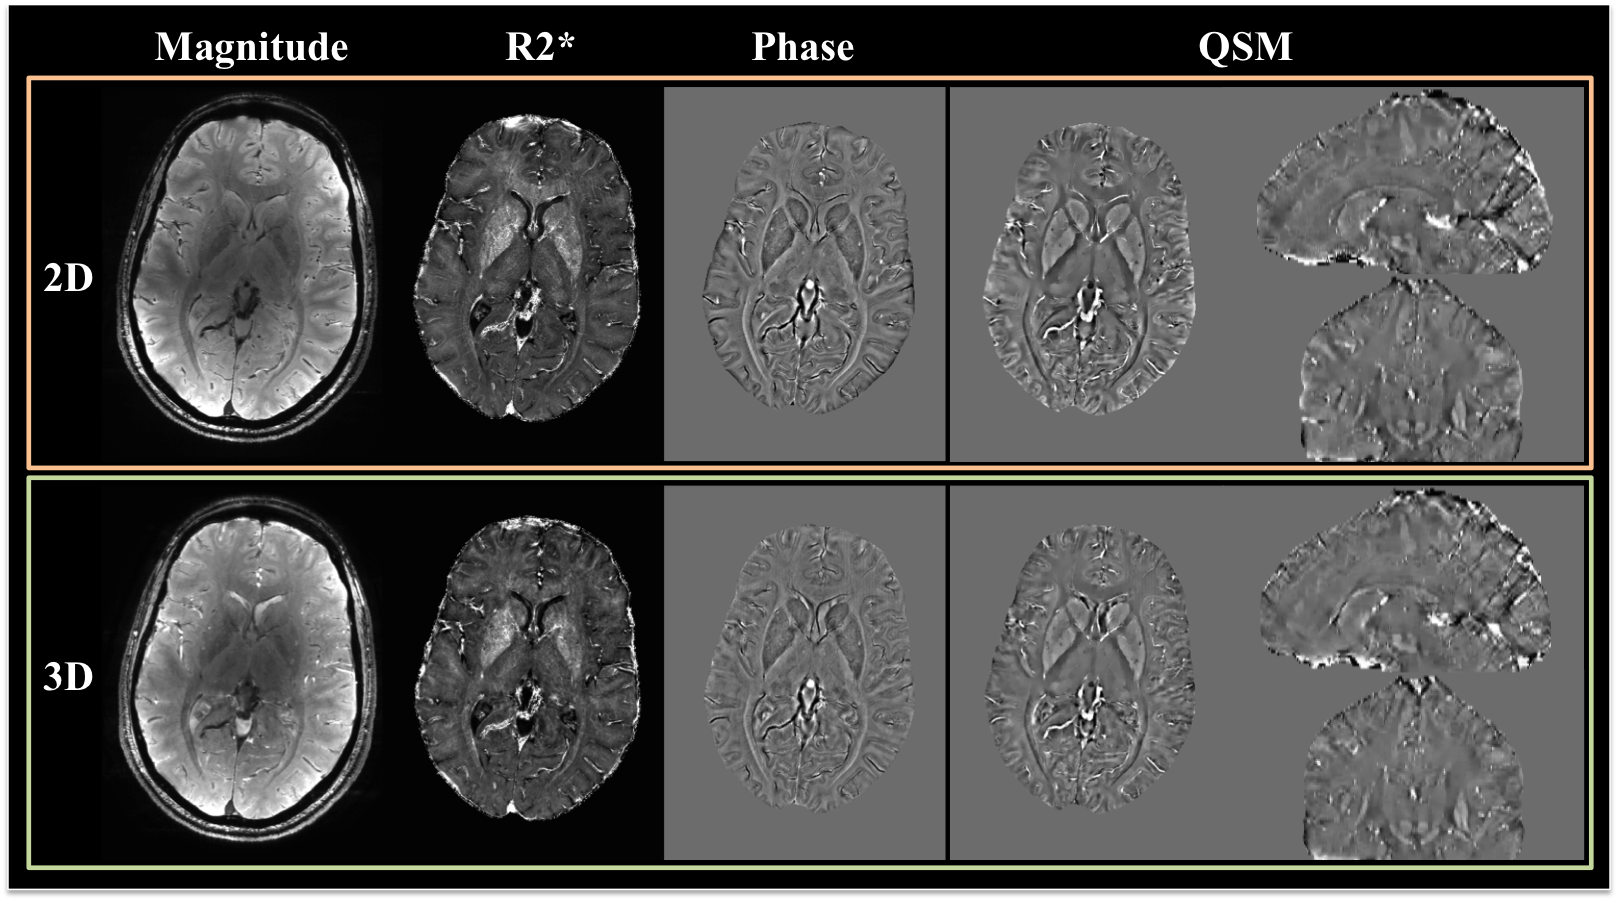
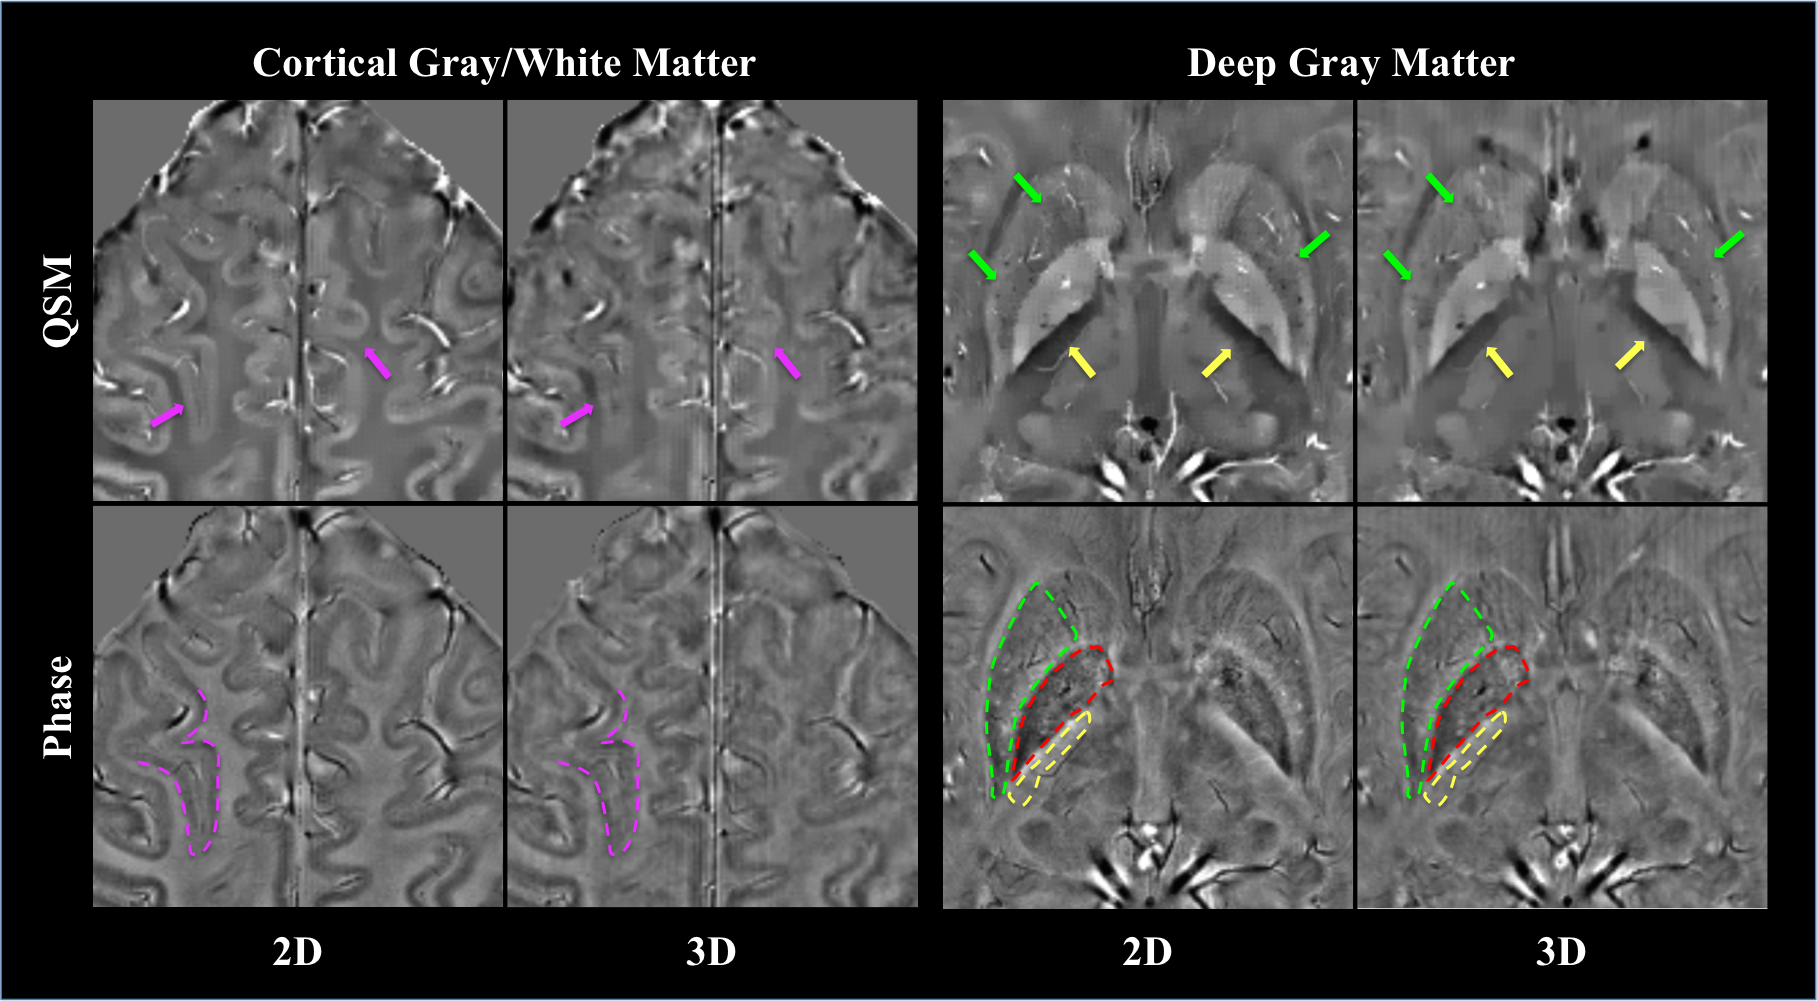
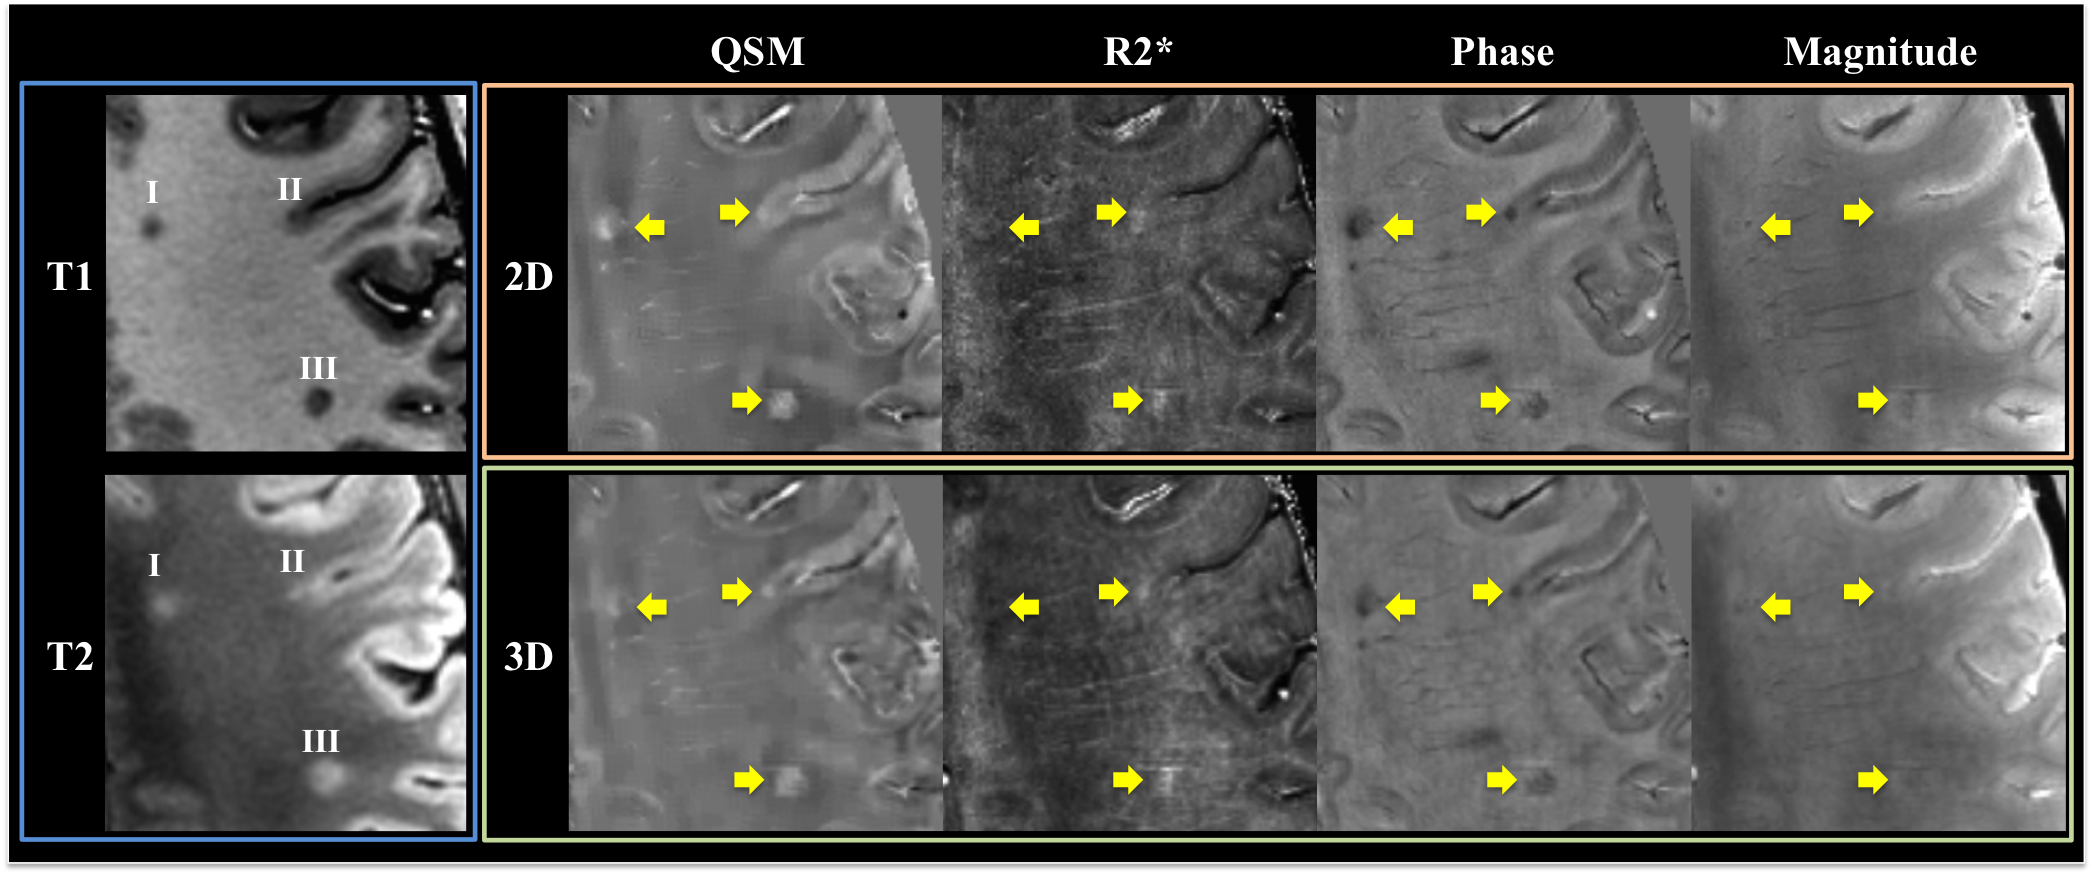
Overall the 2D SMS imaging achieved better image quality than the 3D imaging (Figure 2). Paired t-tests also showed significantly improved CNR on both phase and QSM images from healthy volunteers using the 2D imaging (Figure 3). Visual inspection of images yielded the same conclusion as the quantitative analysis (Figure 4). The improved CNR was also applied to lesions in a MS patient (Figure 5), revealing one cortical and two white matter lesions with altered susceptibility and R2*.Discussion
With the same imaging resolution and coverage, our 2D SMS gradient-echo sequence could perform QSM as fast as optimized-product 3D with improved contrast of QSM images. Although in theory the susceptibility contrast should not depend on TR and flip angle, in practice discretized imaging results in different MR signal properties in voxels having multiple microscopic compartments7, making the contrast TR and flip angle dependent. Thus, the improved CNR may be due to the dramatically different TR and flip angle in 2D imaging. With SMS imaging, this advantage of 2D imaging can be maintained and utilized without a cost in imaging time. Accelerated 2D QSM imaging is also possible using EPI, but it results in image distortions and low imaging resolution that compromise the ability to contrast small structures. The ability of our sequence to contrast small tissues such as cortical gray and white matter could be very useful in characterizing MS cortical lesions, which have different pathology and higher impact on patient disability8.Conclusion
2D SMS imaging is a viable method to perform fast high-resolution simultaneous imaging for magnitude, R2*, and QSM in clinical applications.Acknowledgements
The authors acknowledge research support from the NIH (P41 EB015891, 1 S10 RR026351-01A1) and GE Healthcare.References
1. Wang Y and Liu T. Quantitative susceptibility mapping (QSM): Decoding MRI data for a tissue magnetic biomarker. Magn Reson Med. 2015;73:82-101
2. Bian W, Tranvinh E, and Tourdias T, et al. In Vivo 7T MR Quantitative Susceptibility Mapping Reveals Opposite Susceptibility Contrast between Cortical and White Matter Lesions in Multiple Sclerosis. AJNR AM J Neuroradiol 2016;17:1808-15
3. Kerr AB, Zhu K, and Middione M, et al. Delay-Insensitive Variable-Rate Selective Excitation (DIVERSE). Proc Intl Soc Mag Reson Med. 2015; 23: 921.
4. Setsompop K, Gagoski BA, Polimeni J, et al. Blipped-Controlled Aliasing in Parallel Imaging (blipped-CAIPI) for simultaneous multi-slice EPI with reduced g-factor penalty. Magn. Reson. Med. 2012;67:1210–24.
5. Liu T, Khalidov I, de Rochefort L, et al. A novel background field removal method for MRI using projection onto dipole fields (PDF). NMR Biomed. 2011;24:1129–36.
6. Liu J, Liu T, de Rochefort L, et al. Morphology enabled dipole inversion for quantitative susceptibility mapping using structural consistency between the magnitude image and the susceptibility map. Neuroimage. 2012; 59: 2560-8.
7. Li W, Han H, and Guidon A, et al. Dependence of gradient echo phase contrast on the differential signal decay in subcellular compartments. Proc Intl Soc Mag Reson Med. 2013; 21: 161.
8. Calabrese M, Filippi M and Gallo P. Cortical lesions in multiple sclerosis. Nat Rev Neurol. 2010; 6: 438-44.
Figures