3832
Using a Novel Multiband Multi-Echo Simultaneous ASL/BOLD Sequence to Measure Cerebrovascular Reactivity1Radiology, Medical College of Wisconsin, Milwaukee, WI, United States
Synopsis
A multiband, multi-echo simultaneous ASL/BOLD sequence was developed and used to estimate cerebrovascular reactivity (CVR) using a breath hold (BH) task. In addition, both the BOLD and ASL data were denoised using multi-echo independent component analysis (ME-ICA). ICA was used to extract the BH activation component from the data, which was then correlated with the whole brain. CVR was estimated as the percent signal change from the BH task. Denoising resulted in increased BH activation and more robust CVR maps. Furthermore, the data-driven approach used here eliminates the need to model for the complicated BH response.
Purpose
Simultaneous ASL/BOLD sequences are limited by the short T1-relaxation of the tagged blood, reducing the signal-to-noise ratio (SNR) and restricting the total number of slices that can be acquired. Here, we have developed a novel approach combining multiband, multiecho, pCASL and BOLD sequences (MBME ASL/BOLD) to enable the acquisition of whole-brain simultaneous ASL/BOLD data with reduced T1 decay. Four total echoes were acquired allowing for multi-echo independent component analysis (MEICA) denoising to be used to denoise both the BOLD and ASL data. This study was aimed to test this sequence using a breath hold (BH) task to estimate cerebrovascular reactivity (CVR).Methods
Three subjects were imaged on a GE 3T MR750 system. A high-resolution MPRAGE anatomical image was collected for co-registration with the functional images. Each subject underwent a BH MBME ASL scan, which utilized an unbalanced pCASL labeling scheme with labeling time=1.5s and post-labeling delay (PLD)=1.5s. In-plane acceleration was used with R=2. Additional parameters for the MBME ASL/BOLD run were: TE=9.1,25,39.6,54.3ms, TR=4.0s, MB-factor=4, number of excitations=9 (total slices=9×4=36), FOV=240mm, resolution=3×3×3mm3, FA=90°. Scans lasted 6 minutes. Subjects performed a breath hold task during the MBME ASL/BOLD scans. Scans began with 44 s of paced breathing, followed by four cycles of a 20s BH on expiration, 16s self-paced recovery breathing, and 24s paced breathing.
Data preprocessing included volume registration and skull-stripping of the each of the four echoes separately. All datasets were registered to MNI space. Echo combination was performed using AFNI. Echoes were combined using the T2*-weighted approach1,2. Data was then denoised using the automated ME-ICA technique in AFNI and the meica.py function3-5. This technique classifies independent components as BOLD or non-BOLD based on whether or not their amplitudes are linearly dependent on TE3-5. Non-BOLD components were regressed from the data.
To denoise the perfusion weighted (PW) images, the ME-ICA algorithm was further modified. Label/control oscillations were removed from each echo prior to MEICA by applying a lowpass filter with a frequency cutoff just below the label/control oscillation frequency. Components were classified as BOLD, artifactual non-BOLD and R2*-weighted, and indeterminate by the ME-ICA algorithm. The artifactual and BOLD components were then removed from the original, unfiltered first echo data. PW and PWDN time-series were generated by surround subtracting label and control images from the original and denoised first-echo data.
The preceding procedure resulted in four datasets for each scan that underwent further processing for BH analyses: single echo (E2, TE=25ms), multi-echo combined, denoised (MECDN), PW, and PW denoised (PWDN) timeseries. A data-driven approach was used to determine BH-related activation. ICA was implemented using FSL’s melodic plug-in and used to manually extract the activation component from the data. This component was correlated with the whole-brain using Pearson’s correlation. CVR was computed by dividing the BH fit coefficient by the mean signal intensity to extract the percent signal change related to the BH task. Finally, mean signal was extracted from all datasets in voxels with correlation values>0.5.
Results
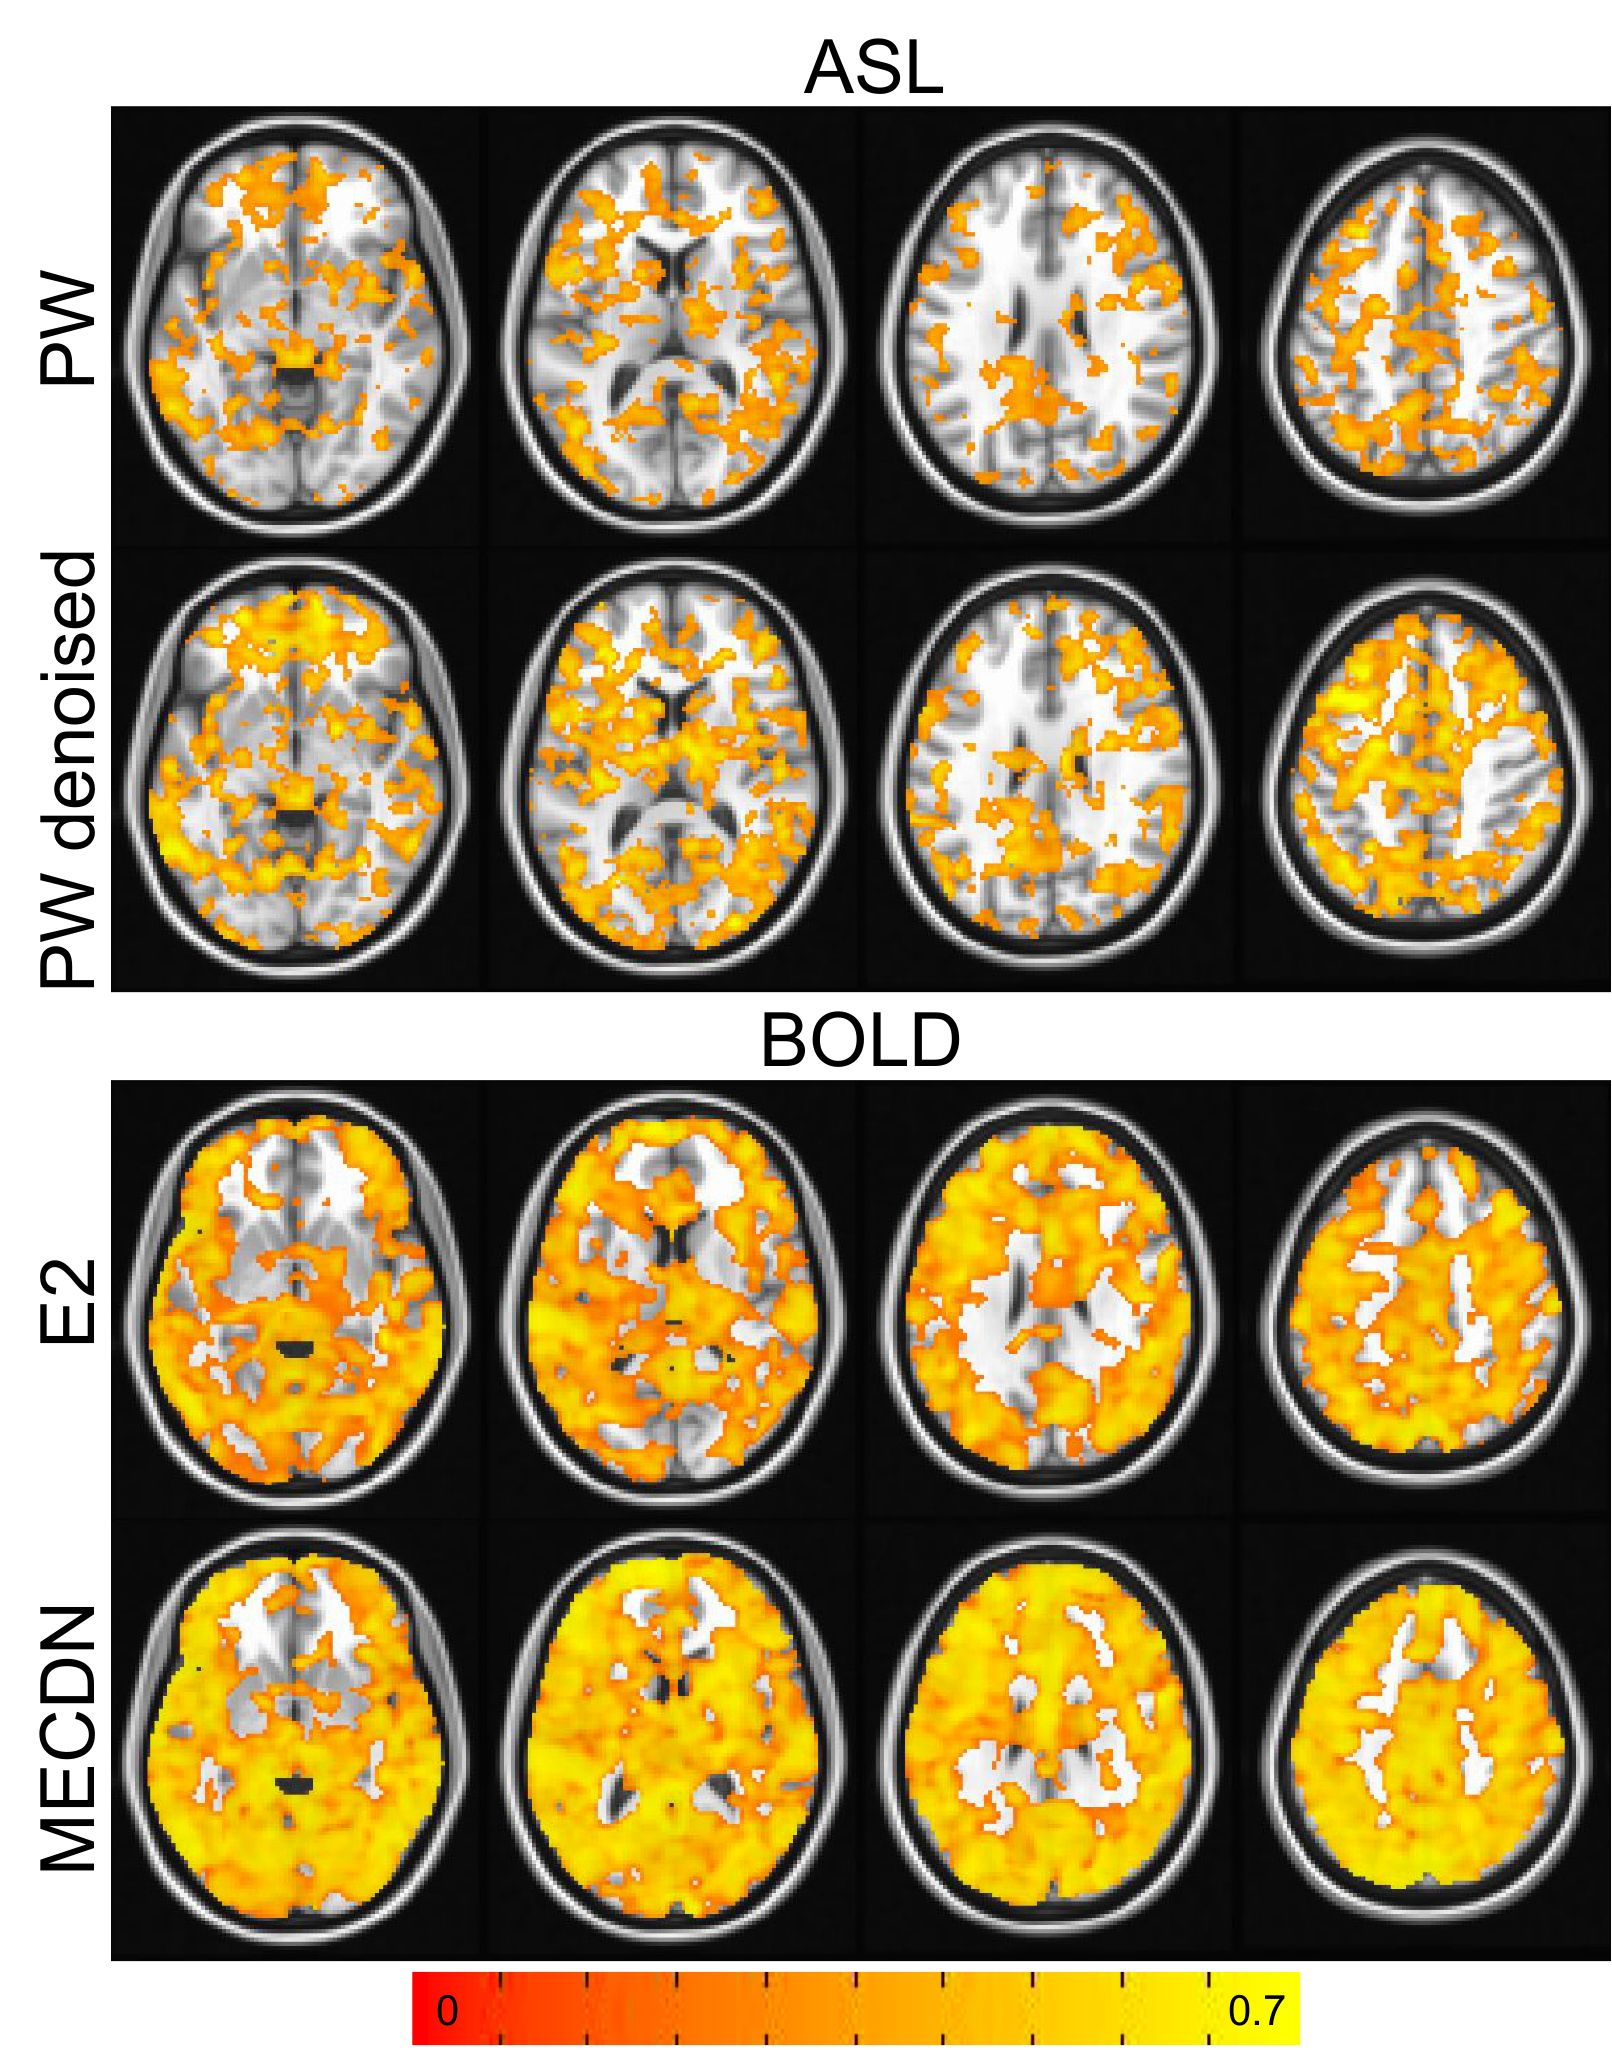
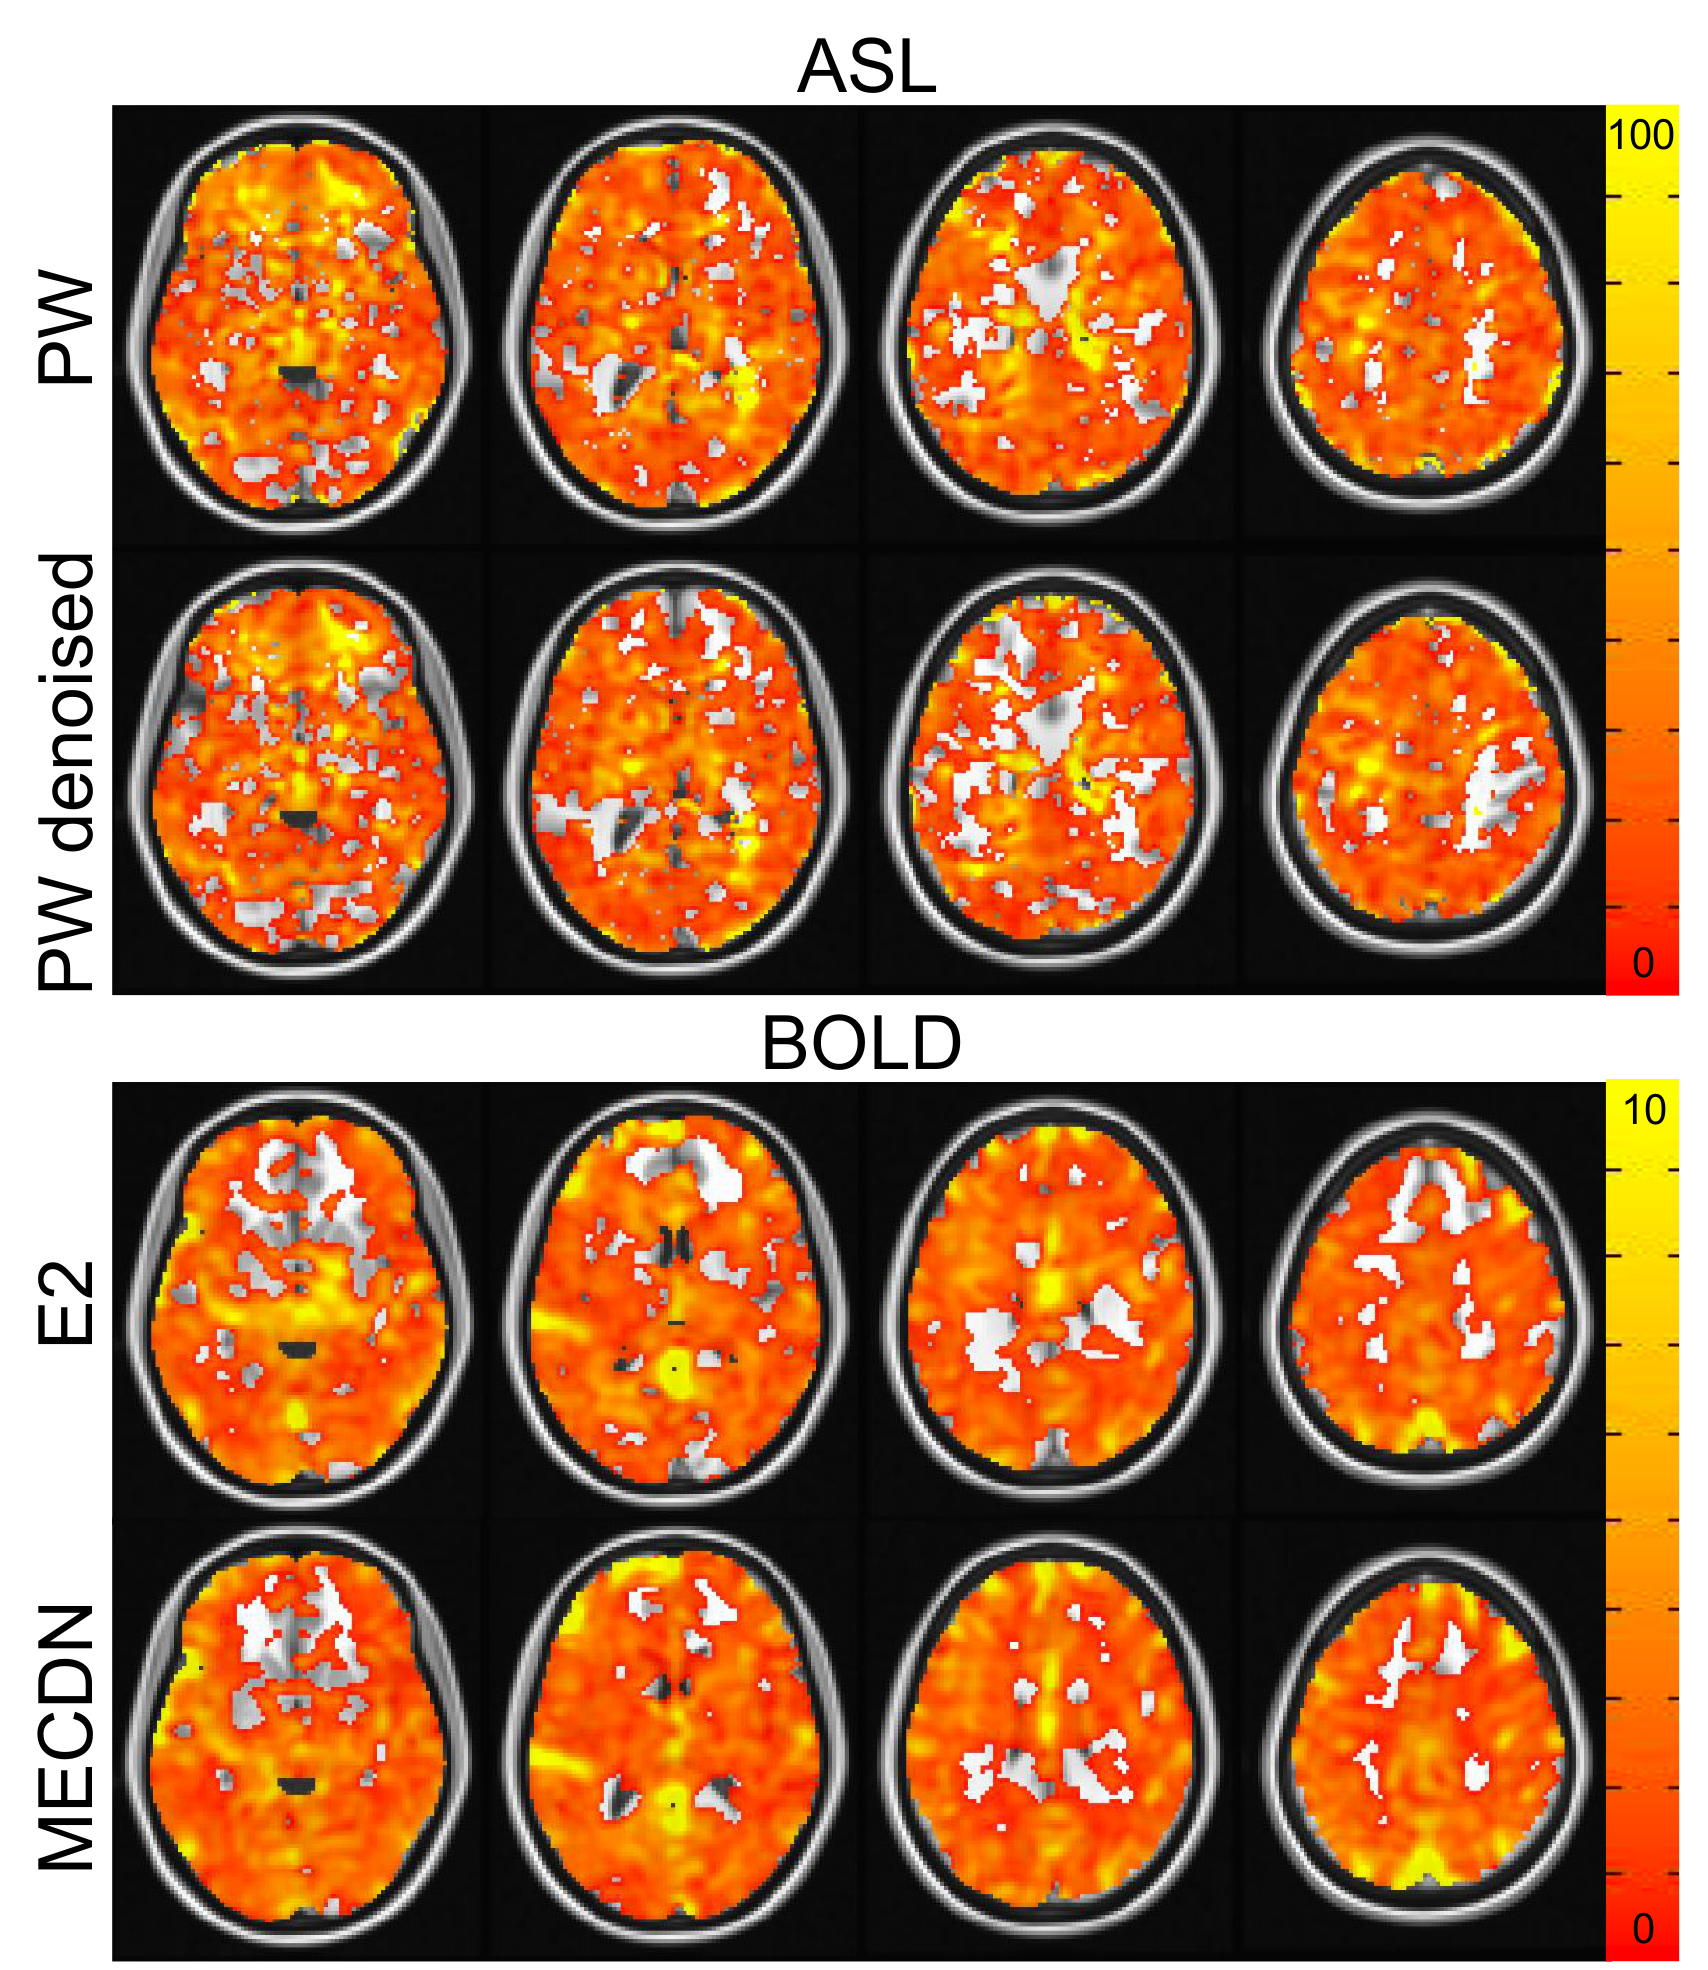
Figure 1 shows the correlation of the ideal BH activation timeseries with the whole-brain in one subject. Increased activation strength and volume can be seen for the PWDN vs. PW data, and the MECDN vs. E2 data. For the BOLD data, this translated to more robust CVR maps (Figure 2) for the denoised data with less negative values. Despite increased activation for the PWDN data, CVR data quality was similar between the PWDN and PW data with denoised data showing a slight increase in negative values. Figure 3 shows mean signal in active voxels for PW and BOLD datasets. In both cases, the denoised signal is cleaner with less variance than the non-denoised signal.Discussion/Conclusions
The BH BOLD response pattern is complex. The BH response is more delayed than typical activation responses, and arterial CO2 increases over time causing complicated BOLD responses6,7. This study used ICA to extract an ideal BH activation timeseries on a per-subject basis eliminating the need for BH response model. ASL is known to be a low SNR, long TR technique. By collecting four total echoes, MEICA denoising could be implemented for the BOLD and ASL data to automatically denoise the data. This led to higher quality data for both BOLD and ASL. The filtering procedure for denoising ASL was applied to prevent label/control oscillations from being present across components and regressed out of the data at later steps. One additional application of this sequence is calibrated fMRI, which can be used to normalize data across subjects. Whereas CVR can be calculated using BOLD and ASL individually, calibrated fMRI requires both.Acknowledgements
This work was partially supported by a grant from the Daniel M. Soref Charitable Trust. We thank Ajit Shankaranarayanan and Matt Middione from GE Healthcare for providing source code of the GE multiband sequence.
References
1. Poser BA, Versluis MJ, Hoogduin JM, Norris DG. BOLD contrast sensitivity enhancement and artifact reduction with multiecho EPI: parallel-acquired inhomogeneity-desensitized fMRI. Magn Reson Med 2006;55(6):1227-1235.
2. Posse S, Wiese S, Gembris D, Mathiak K, Kessler C, Grosse-Ruyken ML, Elghahwagi B, Richards T, Dager SR, Kiselev VG. Enhancement of BOLD-contrast sensitivity by single-shot multi-echo functional MR imaging. Magn Reson Med 1999;42(1):87-97.
3. Kundu P, Brenowitz ND, Voon V, Worbe Y, Vertes PE, Inati SJ, Saad ZS, Bandettini PA, Bullmore ET. Integrated strategy for improving functional connectivity mapping using multiecho fMRI. Proc Natl Acad Sci U S A 2013;110(40):16187-16192.
4. Kundu P, Inati SJ, Evans JW, Luh WM, Bandettini PA. Differentiating BOLD and non-BOLD signals in fMRI time series using multi-echo EPI. Neuroimage 2012;60(3):1759-1770.
5. Evans JW, Kundu P, Horovitz SG, Bandettini PA. Separating slow BOLD from non-BOLD baseline drifts using multi-echo fMRI. NeuroImage 2015;105:189-197.
6. Murphy K, Harris AD, Wise RG. Robustly measuring vascular reactivity differences with breath-hold: normalising stimulus-evoked and resting state BOLD fMRI data. NeuroImage 2011;54(1):369-379.
7. Bright MG, Murphy K. Reliable quantification of BOLD fMRI cerebrovascular reactivity despite poor breath-hold performance. NeuroImage 2013;83:559-568.
Figures