3831
MR Fingerprinting ASL: multi-slice acquisition, sequence optimization, and validation with DSC1Russell H. Morgan Department of Radiology and Radiological Science, Johns Hopkins University, Baltimore, MD, United States, 2Graduate School of Biomedical Sciences, The University of Texas Southwestern Medical Center, Dallas, TX, United States, 3F.M. Kirby Research Center for Functional Brain Imaging, Kennedy Krieger Institute, Baltimore, MD, United States
Synopsis
MR Fingerprinting (MRF) based Arterial Spin Labeling (ASL) has been recently proposed as a new approach to measure multiple hemodynamic parameters in a single scan. However, the previous implementation of MRF-ASL has several limitations, including a single-slice-only acquisition, incomplete optimization of the sequence, and an absence of comparison with existing techniques such as Look-Locker ASL and dynamic-susceptibility-contrast (DSC) MRI. In this work, we conducted a series of six studies to fill these technical gaps: we optimized several key imaging parameters in MRF-ASL and compared the results to existing methods.
Purpose
MR Fingerprinting (MRF)-based Arterial-Spin-Labeling (ASL) has been recently proposed as a new approach to measure multiple hemodynamic parameters in a single scan1,2. Sensitivity of this technique in detecting hemodynamic alterations has been tested using hypercapnia challenge and clinical utility has been examined in patients with cerebrovascular diseases2,3. However, the previous implementation of MRF-ASL has several limitations, including a single-slice-only acquisition, incomplete optimization of the sequence, and an absence of comparison with existing techniques such as Look-Locker ASL and dynamic-susceptibility-contrast (DSC) MRI. Therefore, in this work, we conducted a series of six studies to fill these technical gaps: 1) examining the effect of flip-angle on MRF-ASL results; 2) comparing MRF-ASL to Look-Locker multi-delay ASL (LL-ASL); 3) studying the effect of crusher gradient on MRF-ASL; 4) examining the dependence of MRF-ASL results on TR sequence pattern; 5) comparing MRF-ASL results between single-slice and multi-slice acquisitions; 6) validating MRF-ASL derived bolus arrival time (BAT) using Gadolinium-based DSC MRI.Methods
All studies were performed on a 3T MRI (Philips), and informed consent was obtained using IRB-approved protocol for all subjects.
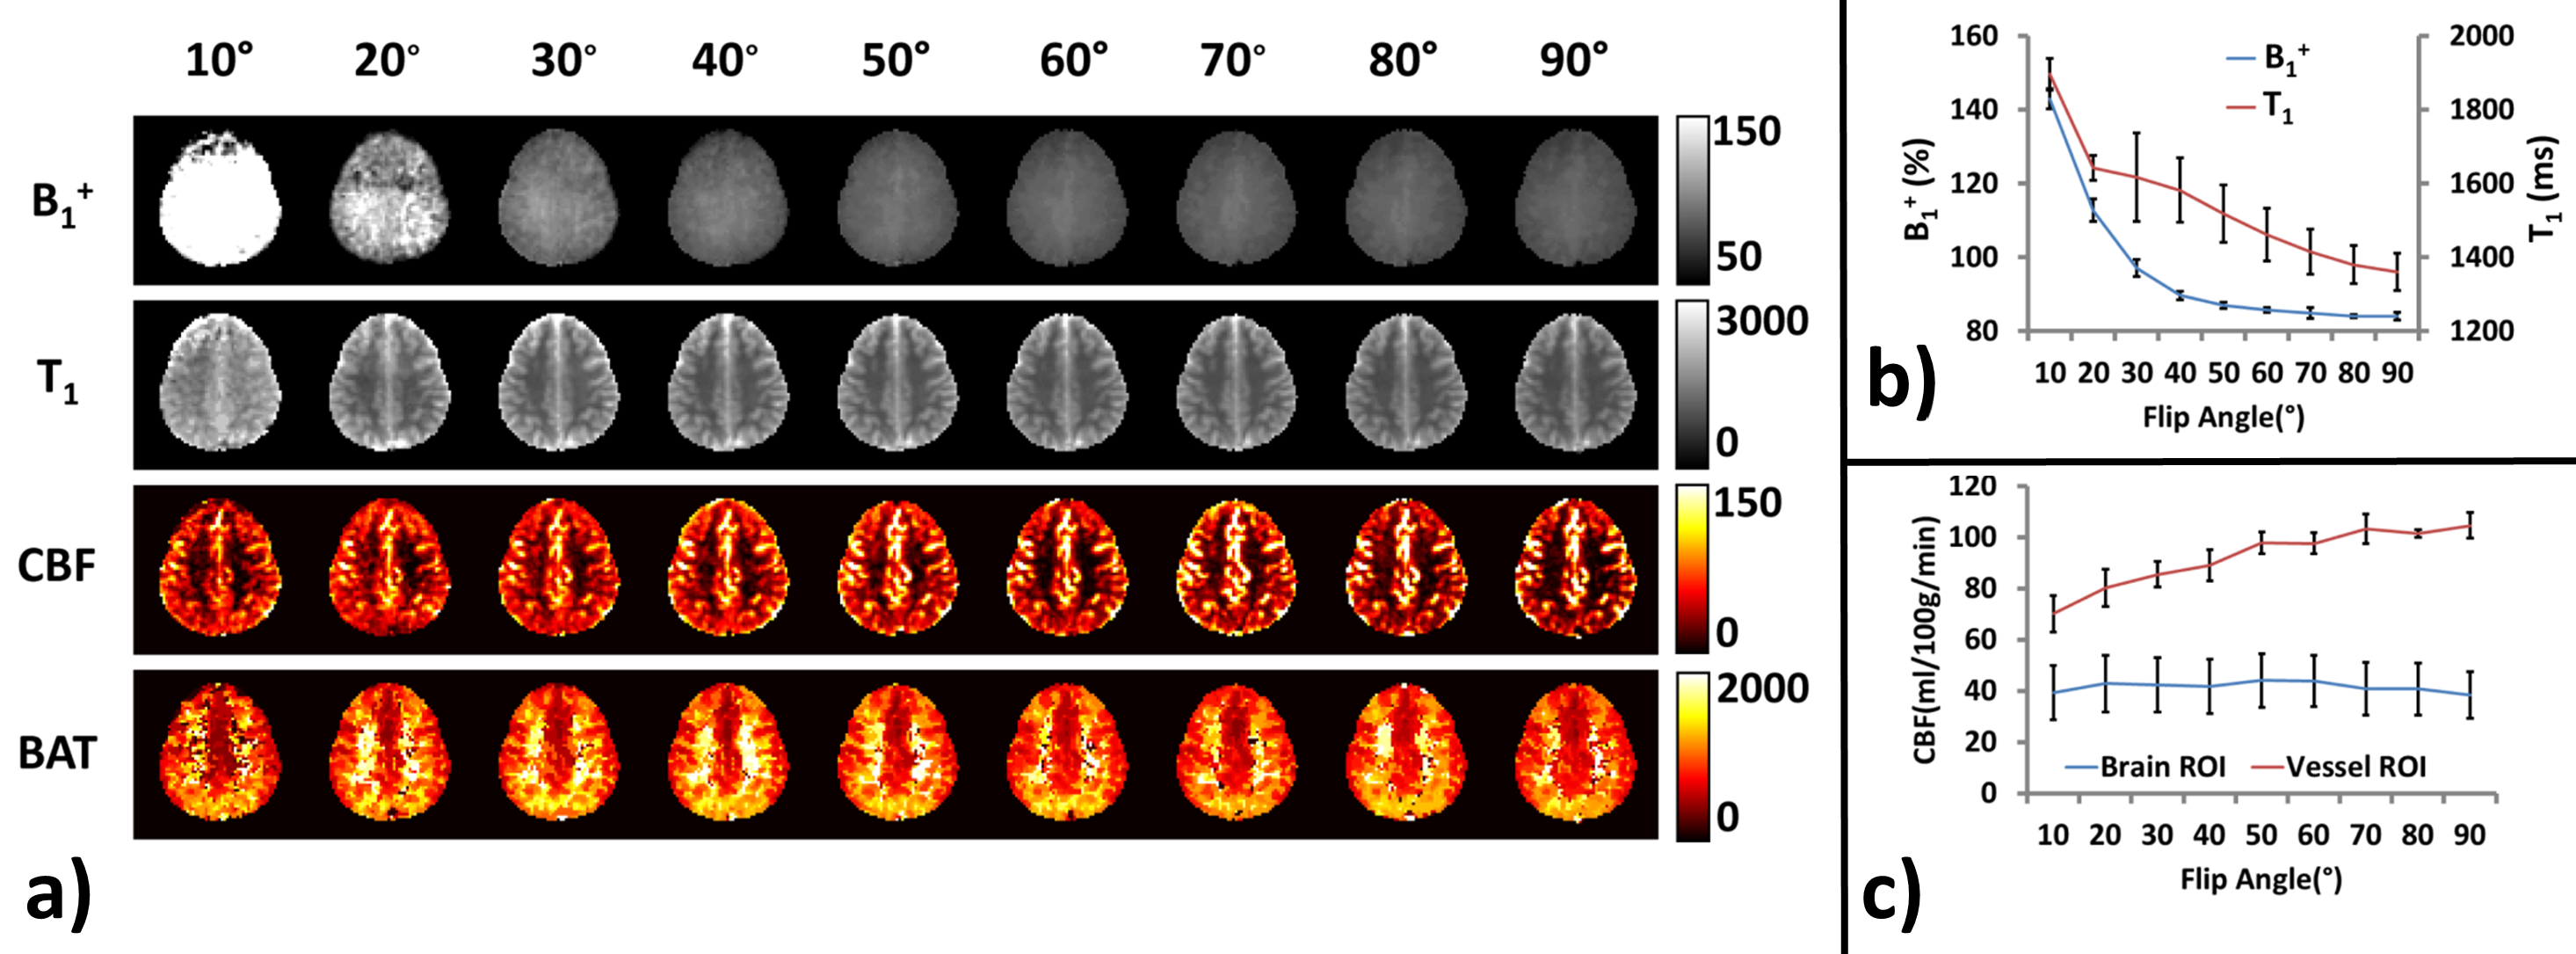
Flip angle dependence: Each participant (N=5) received 9 MRF-ASL scans with the excitation flip angle ranging from 10 to 90°. Other imaging parameters were: single-slice, voxel size 2.8x2.8x10mm, 500 TRs, scan duration 3.2min.
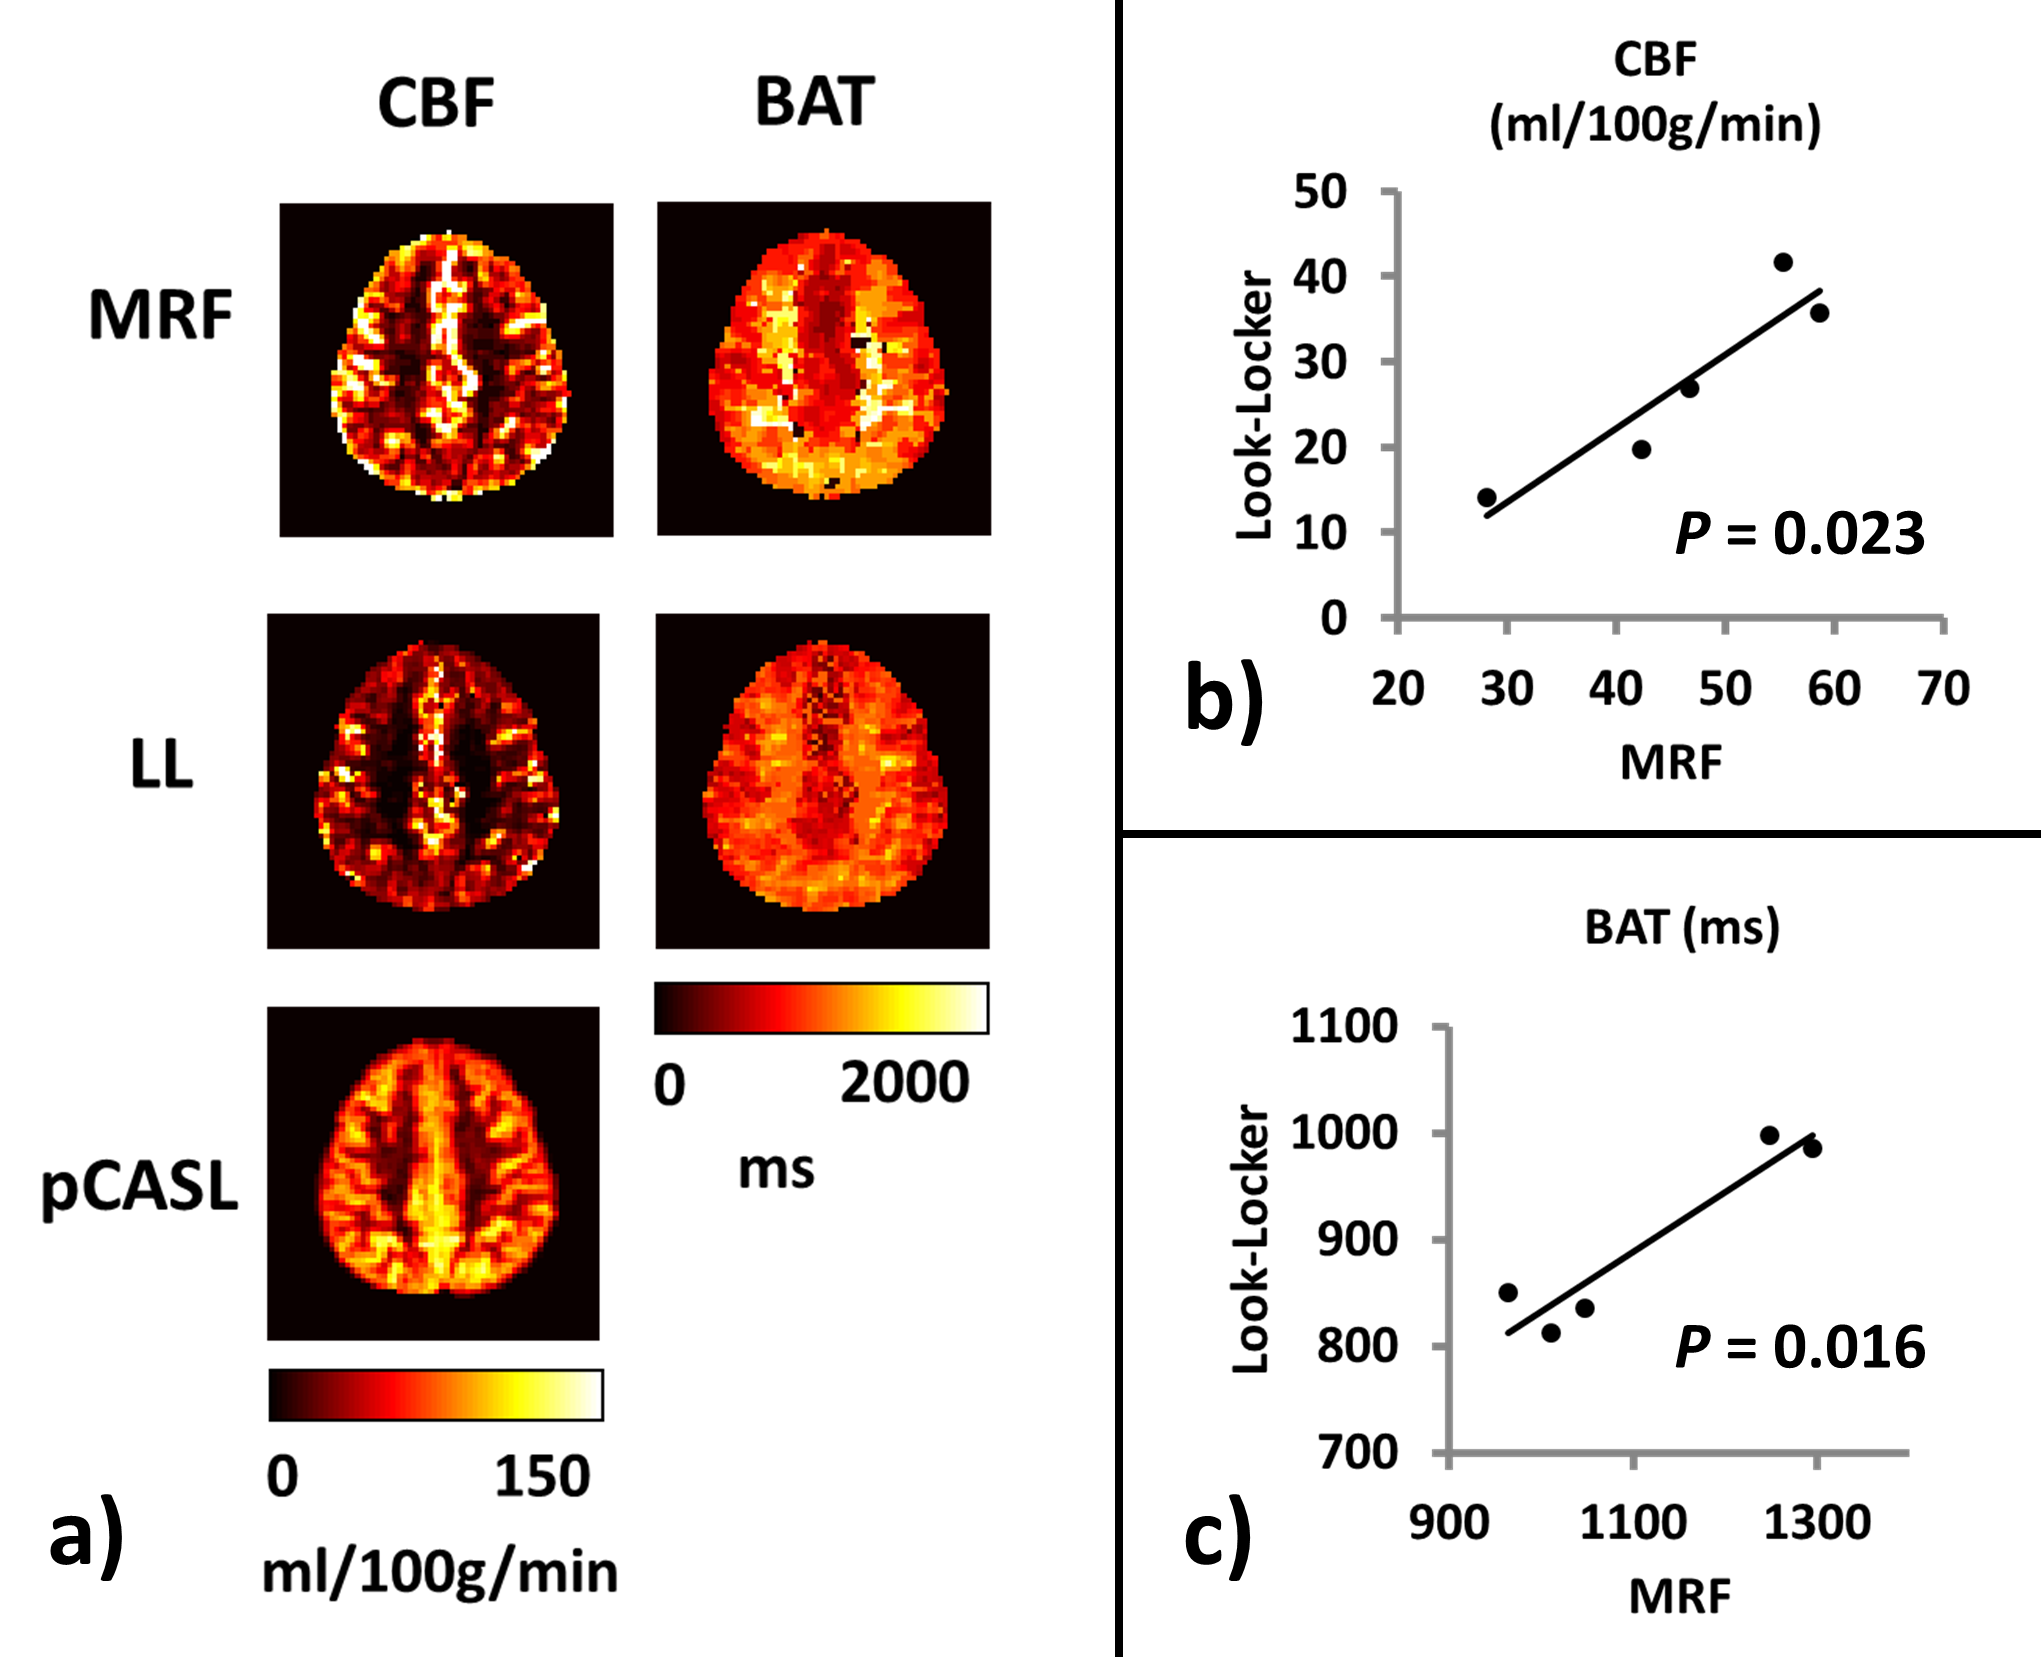
Comparison of MRF-ASL with Look-Locker-ASL: We performed a pulsed LL-ASL4 in which the sequence used a QUASAR5,6 labeling scheme and an acquisition times of initial TI=40ms, interval=300ms, 13 TIs, flip angle=35°, 24 averages, scan duration=3.2min. An MRF-ASL and a single-delay pCASL were also performed.
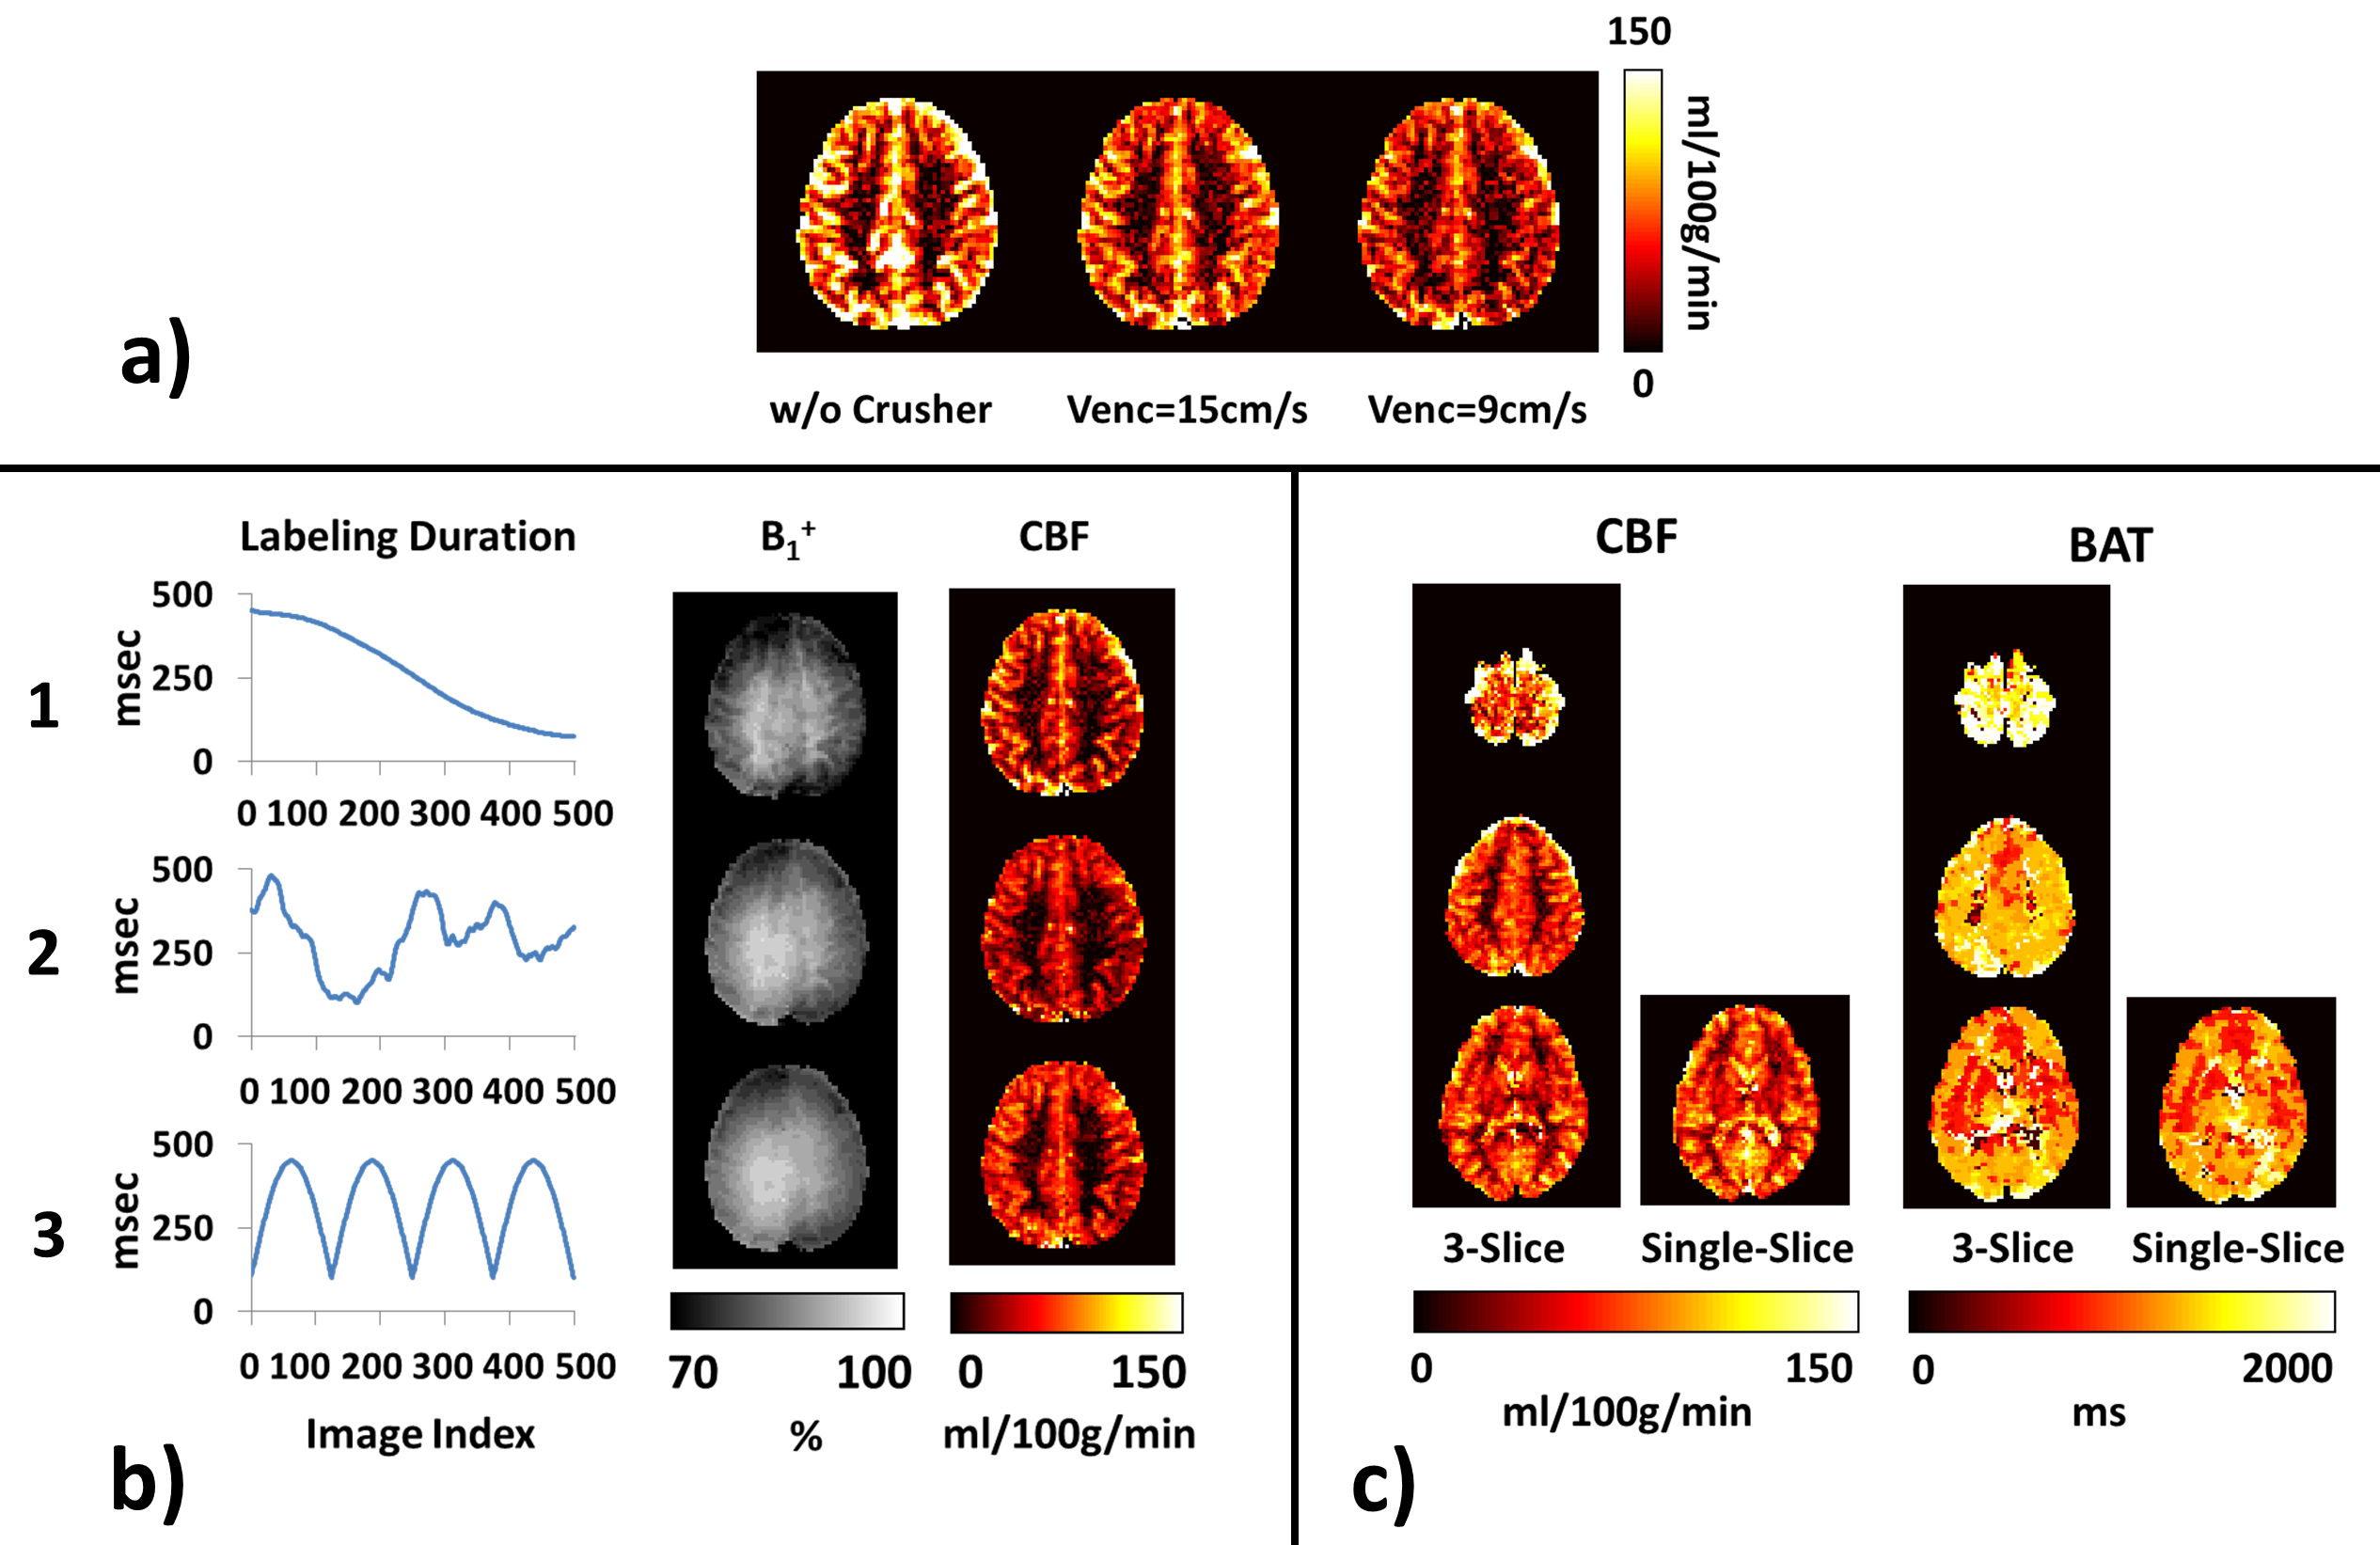
Effect of crusher gradient: MRF-ASL was performed with a range of Venc from ∞ to 9 cm/s (N=3). TE was fixed at 14ms for all Venc scans.
TR sequence pattern in MRF: We tested three different TR sequence patterns (corresponding to different labeling duration time series): the first two were based on Perlin function, the last one was based on sinusoid function (Figure 3b).
Feasibility of multi-slice MRF-ASL: A potential obstacle in multi-slice acquisition of MRF-ASL is that the RF pulses applied during acquisition of other slices could alter the magnetization of the current slice. To test this effect, we compared a 3-slice MRF-ASL with a single-slice MRF-ASL, in which the single-slice location matches that of the bottom slice of the 3-slice acquisition.
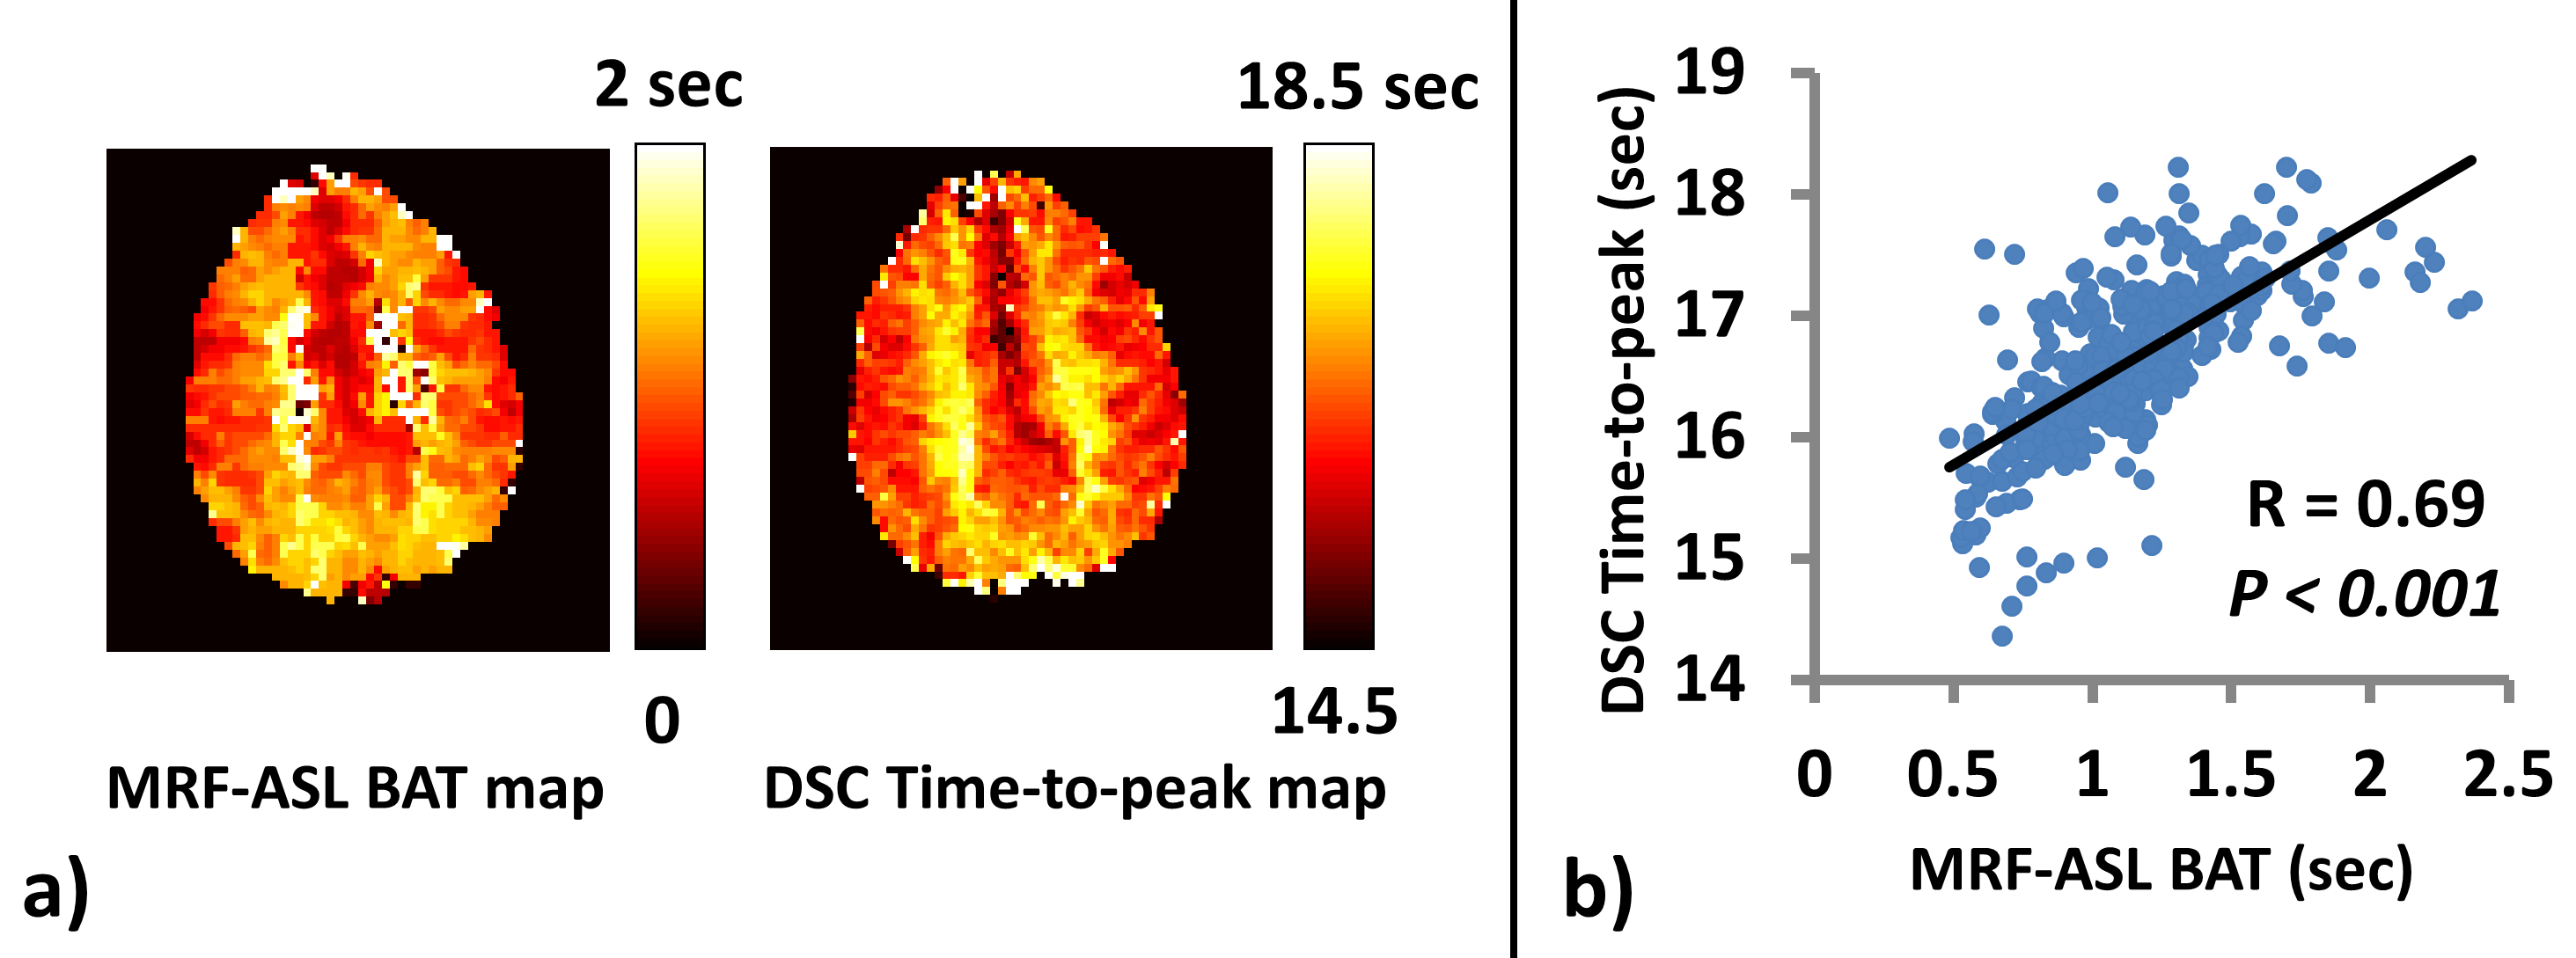
Validation of MRF-ASL BAT with DSC MRI: One participant was scanned with both MRF-ASL sequence and DSC (TR=1800ms, TE=45ms) Gd-perfusion MRI.
Results and Discussion
Flip angle dependence: Figure 1a shows MRF-ASL results as a function of flip angles. Quantitative results (Figure 1b) reveal that flip angles of <70° contain over-estimation in B1+ and T1. On the other hand, Figure 1c shows that large flip angles tend to over-emphasize large vessel signals, causing CBF over-estimation. Therefore, as a tradeoff, a flip angle of 70° was used in the remaining studies.
Comparison with Look-Locker-ASL: Figure 2a shows that both MRF-ASL and Look-Locker-ASL were able to provide simultaneous estimations of CBF and BAT. CBF obtained by MRF-ASL yielded higher CBF values. MRF-ASL also showed a larger dynamic range of BAT. Figure 2b&c show scatter plots of CBF and BAT, respectively, between these two methods, revealing that results are strongly correlated across subjects.
Crusher gradient effect: Figure 3a shows the effect of crusher gradient on CBF map. Hyperintensive artifacts due to large vessels are clearly visible without crusher, while such artifacts were considerably attenuated with crusher gradient. Thus, Venc=9cm/s was used in the remaining studies.
TR sequence pattern: Figure 3b shows MRF-ASL results using three different TR sequence patterns. Pattern 1 is the one used in above studies. Patterns 2 and 3 are new ones tested. Although we only tested three patterns (there are infinite number of possible patterns), among them, Pattern 3 seems to provide B1+ map that contains minimal structural boundaries (as a B1+ map should be) and CBF map that has fewer vascular artifacts. Pattern 3 was thus used in the remaining study.
Multi-slice MRF-ASL: Figure 3c shows CBF and BAT maps estimated with MRF-ASL utilizing a 3-slice acquisition. For comparison, results of single-slice acquisition are also shown. As can be seen, the results using single-slice and multi-slice acquisitions are comparable.
Validation of MRF-ASL BAT with DSC: Figure 4a shows comparison between MRF-ASL BAT and DSC Time-to-peak (TTP) maps. Compared to DSC map, MRF BAT map has a smaller dynamic range, presumably due to less bolus dispersion effects. Scatter plot (Figure 4b) shows that results of these two methods are strongly correlated.
Conclusion
This study optimized several key imaging parameters in MRF-ASL and compared the results to existing methods.Acknowledgements
No acknowledgement found.References
1. Wright KL, Ma D, Jiang Y, Gulani V, Griswold MA, Hernandez-Garcia L. Theoretical Framework for MR Fingerprinting with ASL: Simultaneous Quantification of CBF, Transit Time, and T1. In: Proceedings of the 22th annual meeting of ISMRM 2014:0417.
2. Su P, Mao D, Liu P, Li Y, Welch BG, Lu H. Arterial Spin Labeling without control/label pairing and post-labeling delay: an MR fingerprinting implementation. In: Proceedings of the 23th annual meeting of ISMRM 2015:0276.
3. Su P, Mao D, Liu P, Li Y, Qiao Y, Lu H. Multi-parametric estimation of brain hemodynamics with Fingerprinting ASL. In: Proceedings of the 24th annual meeting of ISMRM 2015:0807.
4. Gunther M, Bock M, Schad LR. Arterial spin labeling in combination with a look-locker sampling strategy: inflow turbo-sampling EPI-FAIR (ITS-FAIR). Magn Reson Med 2001;46:974-984.
5. Petersen ET, Lim T, Golay X. Model-free arterial spin labeling quantification approach for perfusion MRI. Magn Reson Med 2006;55:219-232.
6. Petersen ET, Mouridsen K, Golay X. The QUASAR reproducibility study, Part II: Results from a multi-center Arterial Spin Labeling test-retest study. Neuroimage 2010;49:104-113.
Figures