3828
Implementation of a Dual Parameter Segmentation Tool for Identification of Brown Adipose Tissue on Magnetic Resonance Imaging1Radiology, UT Southwestern Medical Center, Dallas, TX, United States, 2Radiology, Division of Nuclear Medicine, UT Southwestern Medical Center, Dallas, TX, United States, 3Advanced Imaging Research Center, UT Southwestern Medical Center, Dallas, TX, United States, 4Department of Developmental Biology, UT Southwestern Medical Center, Dallas, TX, United States, 5Radiology, Advanced Imaging Research Center, UT Southwestern Medical Center, Dallas, TX, United States
Synopsis
Defining regions of brown adipose tissue (BAT) on MRI remains challenging. Dissemination of existing methods is complicated by propriety algorithms, variability between institutions, and the need for time consuming manual segmentation. In this pilot imaging study, we implemented an online segmentation tool for the open-source OsiriX DICOM viewer platform (Pixmeo, Geneva) that can be used to identify regions of BAT on MRI through simultaneous fat fraction and T2* thresholding automatic segmentation. Since an OsiriX plugin is easily distributable and usable across different centers, our tool may facilitate future research studies of BAT using MRI.
Introduction
Brown adipose tissue (BAT) is a special type of adipose tissue that has the ability to burn calories to generate heat. Mounting evidence suggests that BAT may play an important role in the pathogenesis of diabetes and obesity[1-6]. Unfortunately, monitoring human BAT and its response to interventions remains challenging. Positron emission tomography computed tomography (PET-CT) with Fludeoxyglucose (FDG) remains the most commonly used method, though Magnetic Resonance Imaging (MRI) has shown promise as well [4, 7-19]. Prior MRI studies have primarily focused on detecting and segmenting regions of suspected BAT (sBAT). Various investigational methods have been proposed, based on fat weighted images, fat fraction images, and T2* or R2* maps[9-19]. Methods for defining regions of sBAT on these images vary widely and include a mix of computer segmentation, machine learning algorithms, and manual segmentation[12, 17, 20]. Despite some success, the widespread application of these methods is limited by the fact that the algorithms are either propriety, widely variable between institutions, or rely on time-consuming manual segmentation by experienced operators. This study tries to address these issues through the implementation of a new dual parameter segmentation plugin software for open-source OsiriX DICOM viewer platform (Pixmeo, Geneva). Regions of sBAT isolated with help of this software were then compared with regions of metabolically active BAT detected on FDG PET CT in the same subjects.Methods
In this IRB-approved, HIPAA-compliant prospective pilot study, four young (age 19), thin (BMI 19-23), male healthy volunteer subjects underwent FDG PET CT and MRI exams separated by 5-28 days. The scanning sessions utilized a body cooling protocol using a water-circulating cooling suit similar to that used in prior studies[3, 11, 21]. Regions of BAT were identified on PET CT as areas of supraclavicular adipose tissue (H.U. -1 to -200) with increased FDG uptake (lean SUV > 2.0)[21].
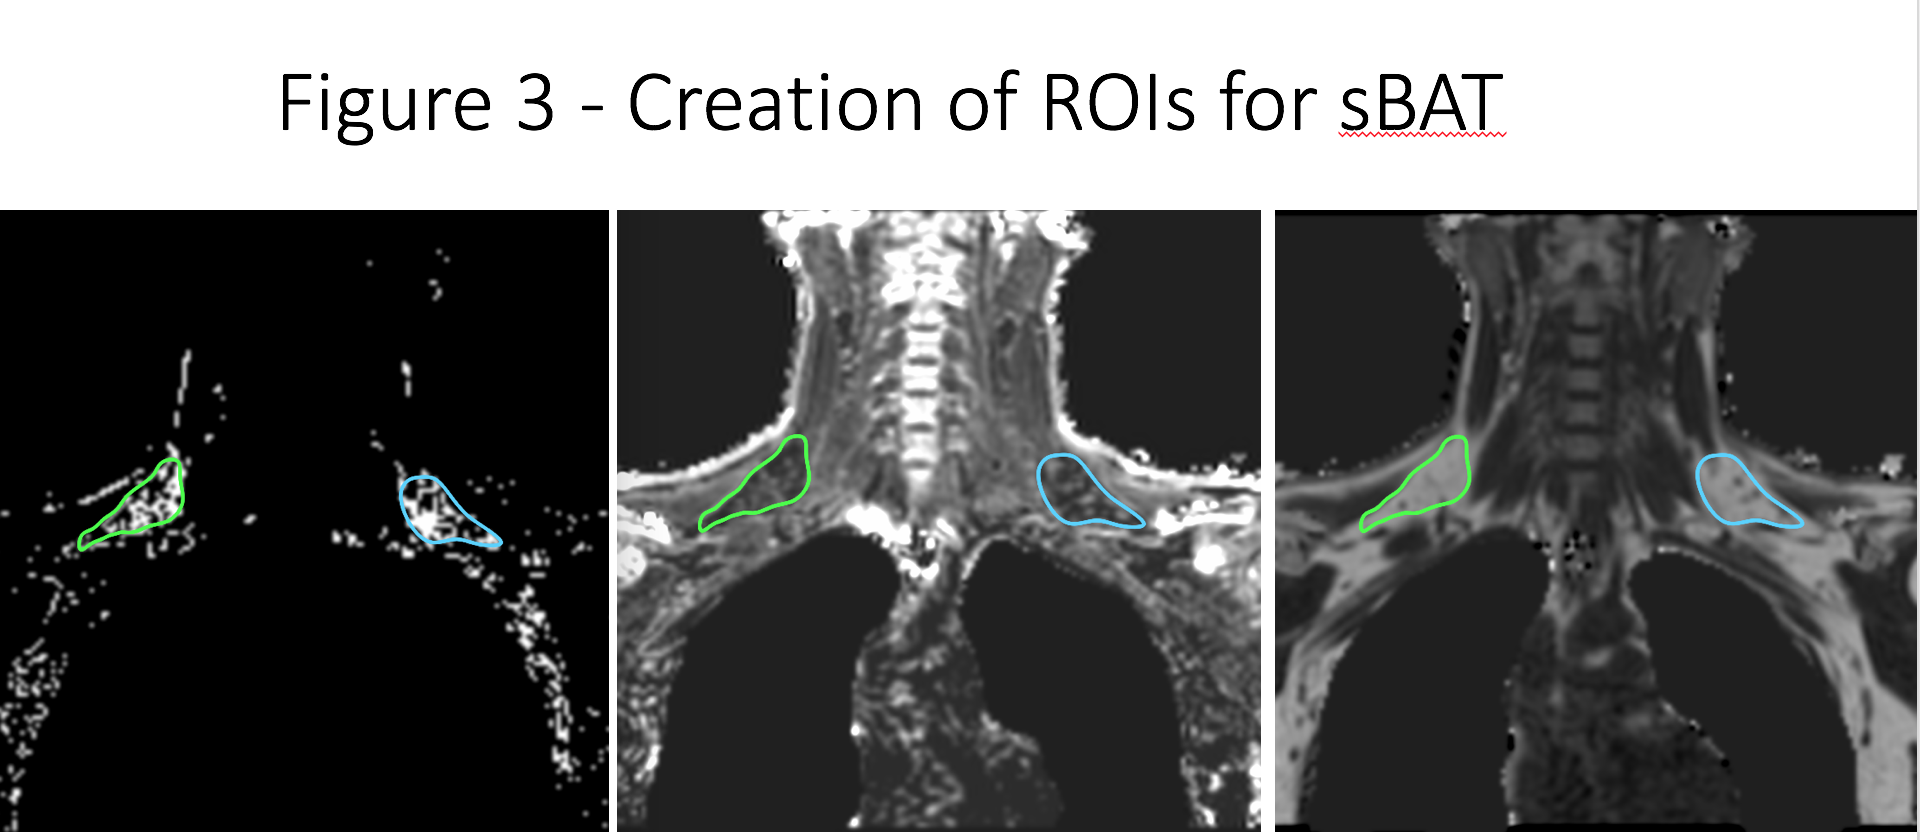
MRI exams were conducted on a 3T whole body scanner (Philips Achieva, Einthoven, Netherlands). A six-echo spoiled gradient echo imaging (mDIXON quant) was performed in the coronal plane in the upper thoracic region before and after a 90-minute body cooling protocol. Fat fraction (FF) values and a T2* map were automatically generated online. Blood oxygen level dependent (BOLD) images were continuously acquired during the body cooling protocol. FF and T2* images were processed using a dual parameter segmentation plugin created for OsiriX (Figure 1). Previous studies have demonstrated that BAT has characteristic FF (40-80%) and T2* (1-50 ms) values [12, 15, 17, 18]. Regions of sBAT were identified by simultaneous application of FF = 40-80% and T2* = 1-50 ms thresholds (Figure 2). Regions of interest (ROIs) were then manually drawn using the dual segmentation software mask as a guide (Figure 3). Dual segmentation masks were also projected over anatomic MRI data and qualitatively compared with regions of BAT identified on FDG PET CT in the same subjects
Results
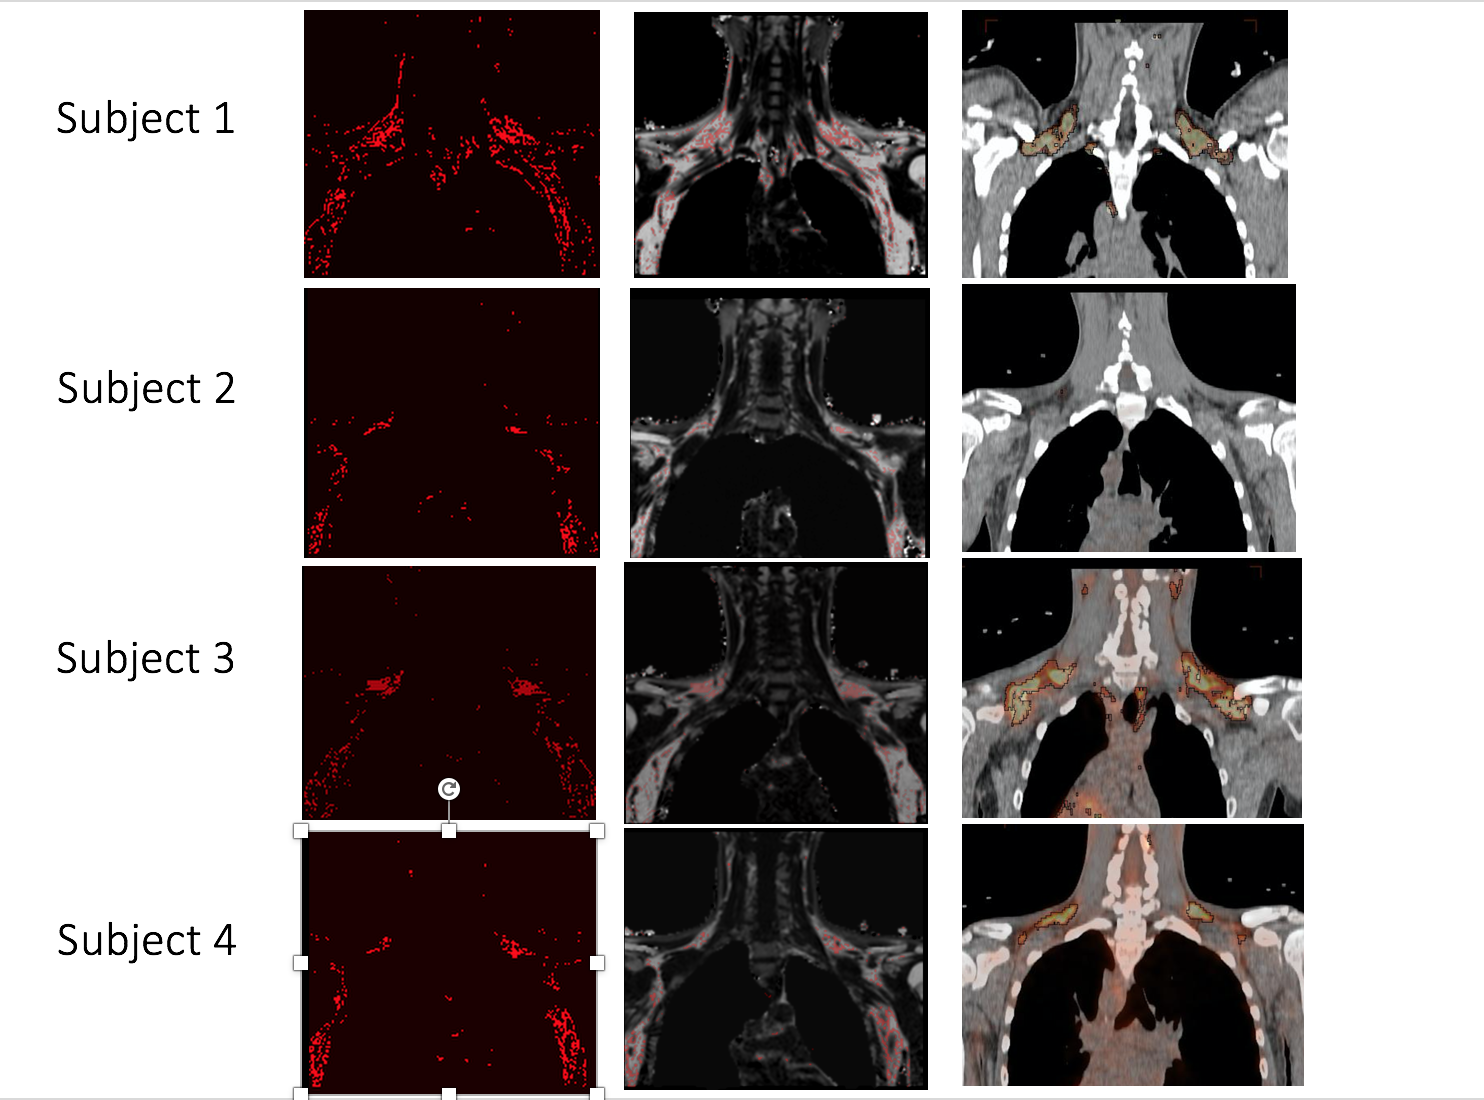
The dual segmentation software identified regions of sBAT based on MRI’s FF and T2* maps that correctly co-localized with regions of metabolically-active BAT detected by FDG PET CT in the same subjects (Figure 4). Of note, the one subject who had no appreciable metabolically-active BAT on FDG PET CT also had the smallest region of sBAT identified by MRI (Figure 4).Discussion/Conclusion
In this pilot study, we implemented an online segmentation tool for the open-source OsiriX DICOM viewer platform that can be used for identification of regions of BAT on MRI through simultaneous FF and T2* thresholding automatic segmentation. Since an OsiriX plugin is easily distributable and usable across different centers, our tool may facilitate future research studies of BAT using MRI. We are currently processing fat fraction and T2* data for sBAT ROIs acquired before and after the body cooling protocol. Functional MRI data acquired during the body cooling protocol is also being evaluated.Acknowledgements
We would like to the thank the UT Southwestern Center for Translational Medicine. Research reported in this publication was supported by the National Center for Advancing Translational Sciences of the National Institutes of Health under award Number UL1TR001105. The content is solely the responsibility of the authors and does not necessarily represent the official views of the NIH.References
1. Liu, X., et al., Brown Adipose Tissue Transplantation Reverses Obesity in Ob/Ob Mice. Endocrinology, 2015. 156(7): p. 2461-9.
2. Gunawardana, S.C. and D.W. Piston, Insulin-independent reversal of type 1 diabetes in nonobese diabetic mice with brown adipose tissue transplant. Am J Physiol Endocrinol Metab, 2015. 308(12): p. E1043-55.
3. Yoneshiro, T., et al., Recruited brown adipose tissue as an antiobesity agent in humans. J Clin Invest, 2013. 123(8): p. 3404-8.
4. Blondin, D.P., et al., Increased brown adipose tissue oxidative capacity in cold-acclimated humans. J Clin Endocrinol Metab, 2014: p. jc20133901.
5. Villarroya, F., et al., Brown adipose tissue as a secretory organ. Nat Rev Endocrinol, 2016.
6. Schlein, C. and J. Heeren, Implications of thermogenic adipose tissues for metabolic health. Best Pract Res Clin Endocrinol Metab, 2016. 30(4): p. 487-496.
7. van Marken Lichtenbelt, W.D., et al., Cold-activated brown adipose tissue in healthy men. N Engl J Med, 2009. 360(15): p. 1500-8.
8. Virtanen, K.A., et al., Functional brown adipose tissue in healthy adults. N Engl J Med, 2009. 360(15): p. 1518-25.
9. Rasmussen, J.M., et al., Brown adipose tissue quantification in human neonates using water-fat separated MRI. PLoS One, 2013. 8(10): p. e77907.
10. Reddy, N.L., et al., Identification of brown adipose tissue using MR imaging in a human adult with histological and immunohistochemical confirmation. J Clin Endocrinol Metab, 2014. 99(1): p. E117-21.
11. Chen, Y.C., et al., Measurement of human brown adipose tissue volume and activity using anatomic MR imaging and functional MR imaging. J Nucl Med, 2013. 54(9): p. 1584-7.
12. Hu, H.H., et al., Characterization of human brown adipose tissue by chemical-shift water-fat MRI. AJR Am J Roentgenol, 2013. 200(1): p. 177-83.
13. van Rooijen, B.D., et al., Imaging cold-activated brown adipose tissue using dynamic T2*-weighted magnetic resonance imaging and 2-deoxy-2-[18F]fluoro-D-glucose positron emission tomography. Invest Radiol, 2013. 48(10): p. 708-14.
14. Borga, M., et al., Brown adipose tissue in humans: detection and functional analysis using PET (positron emission tomography), MRI (magnetic resonance imaging), and DECT (dual energy computed tomography). Methods Enzymol, 2014. 537: p. 141-59.
15. Deng, J., et al., MRI characterization of brown adipose tissue in obese and normal-weight children. Pediatr Radiol, 2015. 45(11): p. 1682-9.
16. Franz, D., et al., Discrimination Between Brown and White Adipose Tissue Using a 2-Point Dixon Water-Fat Separation Method in Simultaneous PET/MRI. J Nucl Med, 2015. 56(11): p. 1742-7.
17. Gifford, A., et al., Human brown adipose tissue depots automatically segmented by positron emission tomography/computed tomography and registered magnetic resonance images. J Vis Exp, 2015(96).
18. Lundstrom, E., et al., Magnetic resonance imaging cooling-reheating protocol indicates decreased fat fraction via lipid consumption in suspected brown adipose tissue. PLoS One, 2015. 10(4): p. e0126705.
19. Romu, T., et al., Characterization of brown adipose tissue by water-fat separated magnetic resonance imaging. J Magn Reson Imaging, 2015. 42(6): p. 1639-45.
20. Bhanu Prakash, K.N., et al., A method for the automatic segmentation of brown adipose tissue. MAGMA, 2016. 29(2): p. 287-99.
21. Chen, K.Y., et al., Brown Adipose Reporting Criteria in Imaging STudies (BARCIST 1.0): Recommendations for Standardized FDG-PET/CT Experiments in Humans. Cell Metab, 2016. 24(2): p. 210-22.
Figures
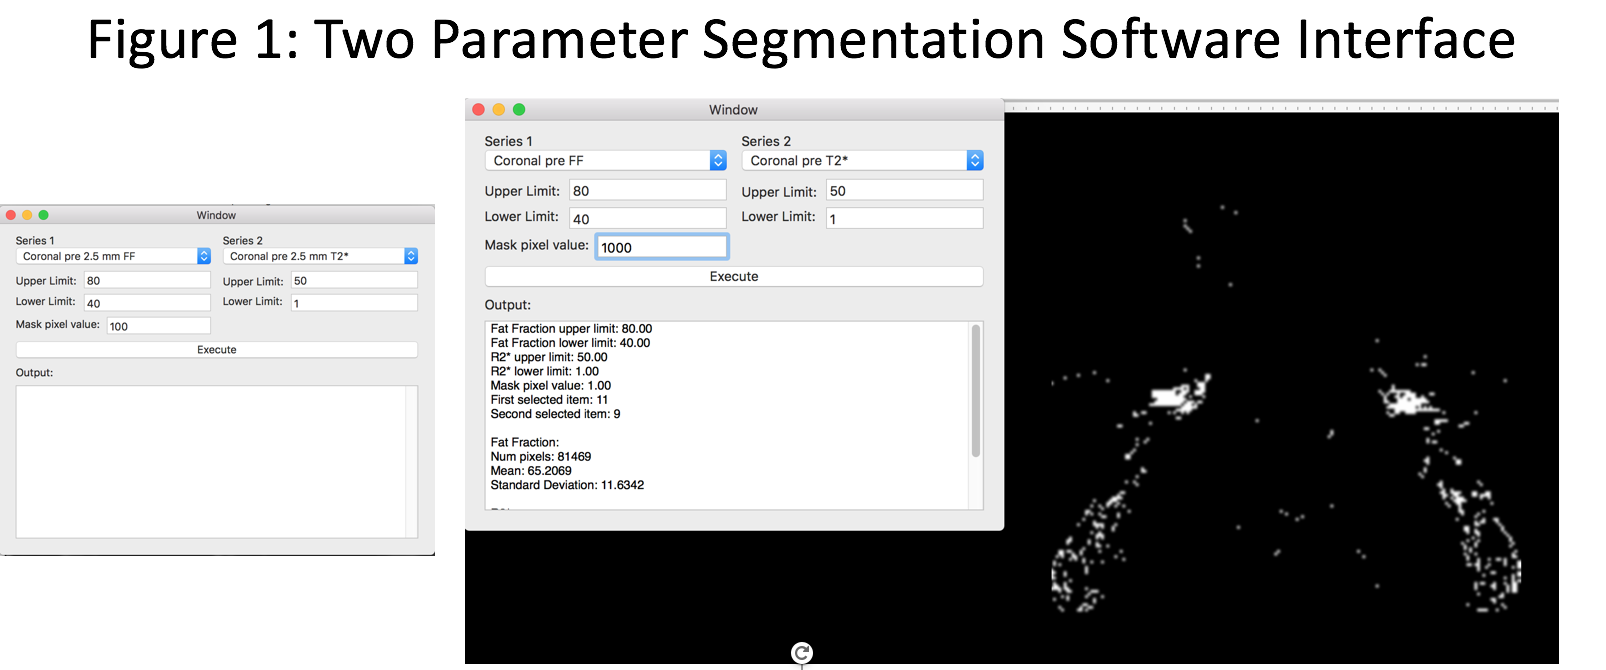
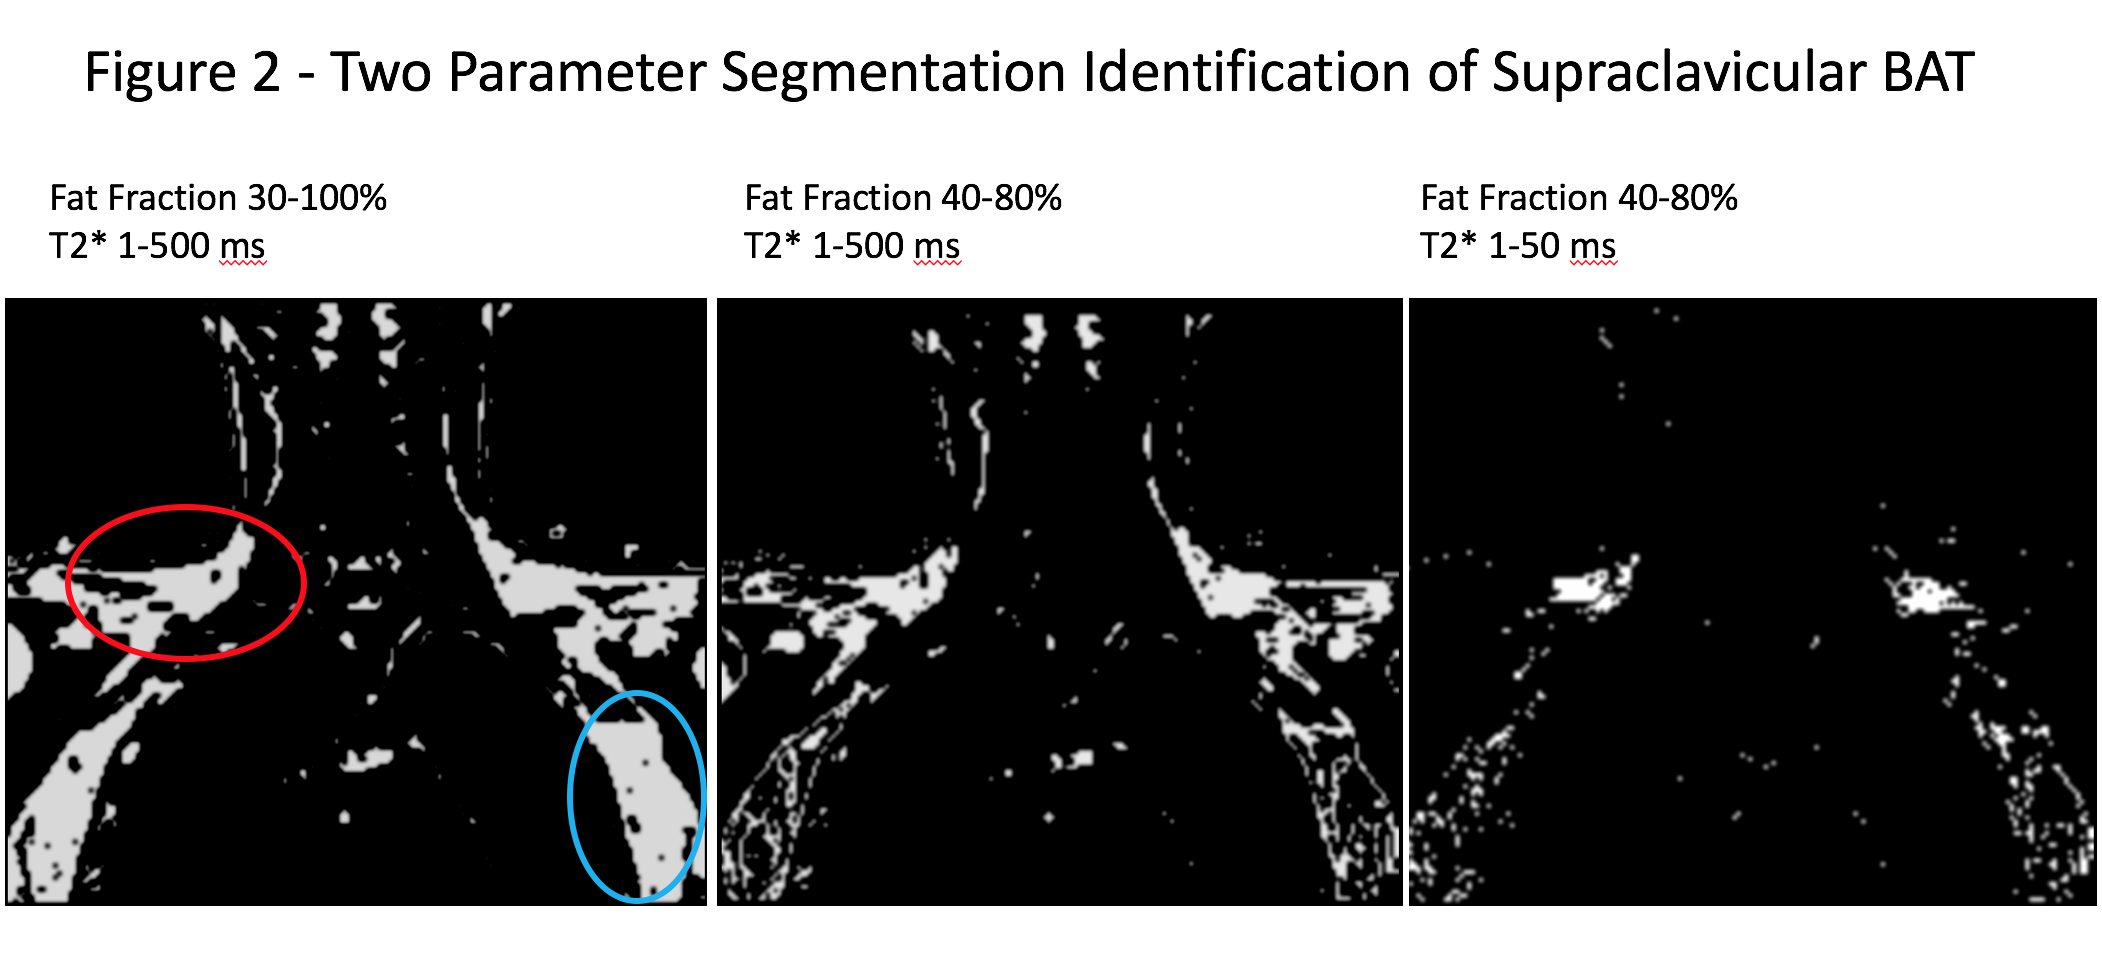
Figure 2: Demonstration of two parameter segmentation of supraclavicular BAT. The left image, with fat fraction (FF) range 30-100% and a wide range of T2* values, creates a mask of all fat voxels, including regions of possible supraclavicular BAT (red circle) and regions of axillary fat (blue circle). The middle image selects FF values of 40-80%, increasing specify for BAT by excluding much of the subcutaneous and axillary fat. A narrow range of T2* values in the right image results in greater voxel enrichment in the expected region of supraclavicular BAT.
*Lungs manually excluded to reduce artifact in this region.