3827
Development of 3D UTE Reconstruction Software Using Python Language1Utah Center for Advanced Imaging Research, University of Utah, Salt Lake City, UT, United States, 2Radiology and Imaging Sciences, University of Utah, Salt Lake City, UT, United States, 3Biomedical Engineering, University of Utah, Salt Lake City, UT, United States, 4Physics and Astronomy, University of Utah, Salt Lake City, United States
Synopsis
3D radial, such as ultra-short TE (UTE) MRI, is receiving a growing attention, because of its unique features, which include free of motion artifact and imaging of short T2* species. However, reconstruction of UTE data is very challenging, therefore, only a handful research institutes possess the reconstruction capability. We developed a GUI-based software to construct UTE images using Python and C++ languages. We will present details about the development of this software using Python, which includes difficulties.
Introduction
3D radial ultra-short TE (UTE) MRI technique is receiving a growing attention for various measurement, particularly for imaging of short T2* species such as lung, tendon, ligament, and myelin. However, image construction is very challenging, because of the need to regrid the data to Cartesian grid and large data size. The biggest obstacle of UTE imaging is its complex reconstruction procedure. We developed a UTE reconstruction software using Python and C++ languages.Methods
We developed an Image Construction Software with a user-friendly Graphic-User-Interface (GUI) front-end, using C++ and Anaconda Python (Continuum Analytics, Austin, TX, USA), which is specially packaged for science and engineering application. GUI was programmed using TkInter, which provides various GUI widgets. Numpy [1] and Scipy [2] packages were heavily used for all array processing. For plotting and displaying data, matplotlib [3] and pyqtgraph (http://www.pyqtgraph.org) are used in current software. Current software runs under Linux, and Mac OS with appropriate binary file for regridding. The package ctypes is used to load and pass the pointers of the input and output data between the Python and the regridding C++ function. Threaded processing is used when possible, particularly during the regridding and Fourier-transformation. The Kaiser-Bessel or sinc regridding kernel is used with user defined kernel width [4]. In the threaded regridding, the radial k-space data is split to 2, 4, 8, 16, or 32 blocks, depending on the number of available threads. The software is capable to apply various density-compensated-functions.
Reconstruction of 3D radial MRI, particularly using multi-channel receive-only RF coil, produces a raw data with large size, which requires a computer with large memory. Therefore, intermediate data objects and all acquisition and reconstruction parameters, which can selectively include radial, regridded Cartesian, and image data, are saved to a local harddisk drive using the package "pickle". In case of memory shortage, the software is relaunched and the saved object is loaded for further processing. Constructed images, including magnitude and/or phase images, can be saved to a local harddisk drive in DICOM format using pydicom module.
Results
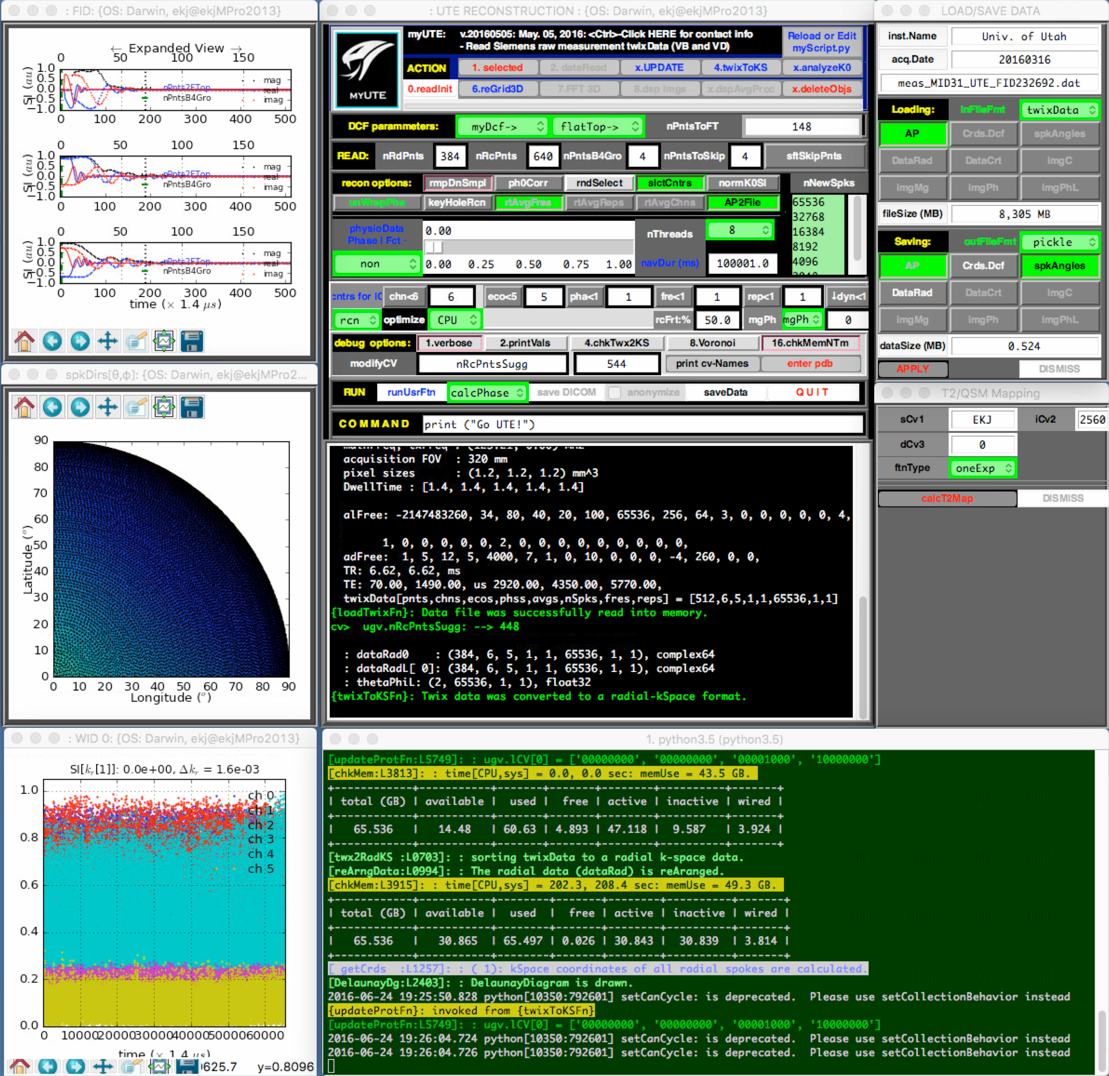
The Fig. 1 illustrates the GUI front-end with selected user variables, which are needed to control the reconstruction process. On the left column, selected FIDs and the distribution of the spoke directions on a Delaunay diagram are shown. User interacts the program at a UNIX shell. User has access to all variables and objects via the debugging module. Images in Fig. 2 were constructed from the same raw data with different density-compensation function. These images demonstrated that as the dcf weighs higher at the outer k-space data, the contrast increases with expense of increased noise.Discussions
The major advantages using Python language include its large online community for help, availability of various packages, and free from commercial license. A disadvantage is its slow performance in reconstructing images on the large data, such as 3D radial MRI, compared with C/C++, which is a common problem using any interpreting language, such as matlab (Mathwork, Natick, MA). Our current software is capable to read only Siemens raw MRI data. To read other vender's raw data, one must have access to the detailed information of the raw file structure of a specific vendor’s raw data. Recently, ISMRM community proposed a common raw MRI data format (ismrmrd), which is a cross-vender raw data format. The community developed tools to convert major MRI vender's raw data to ismrmrd format (https://github.com/ismrmrd/ismrmrd). It has been very beneficial using this home-made reconstruction software for the image construction of the 3D radial raw data. The software can process partial data with selected loop counters for a quick testing purpose.Acknowledgements
This work is supported by VA Merit Review Grant and NMSS Research Grant (RG 5233-A-2).References
[1]. E. Jones, T. Oliphant, P. Peterson, et al., Scipy: Open source scienti_c tools for Python,"Comput. Sci. Eng. 9; 10 (2011).
[2]. S. van der Walt, S. Colbert, and G. Varoquaux, The numpy array: A structure for efficient numerical computation, computing in science & engineering," Comput. Sci. Eng. 3; 22 (2011).
[3]. J. D. Hunter, Matplotlib: A 2D graphics environment," Computing In Science & Engineering 9; 90 (2007).
[4]. Nielles-Vallespin, M.-A. Weber, M. Bock, A. Bongers, P. Speier, S. E. Combs, J. Wohrle, F. Lehmann-Horn, M. Essig, and L. R. Schad, 3D radial projection technique with ultrashort echo times for sodium mri: clinical applications in human brain and skeletal muscle," MRM 57, 74{81 (2007).
Figures