3822
Cerebra-QSM: An Application for Exploring Quantitative Susceptibility Mapping Algorithms1Calgary Image Processing and Analysis Centre, Foothills Medical Centre, Calgary, AB, Canada, 2Departments of Radiology and Clinical Neurosciences, Hotchkiss Brain Institute, University of Calgary, Calgary, AB, Canada, 3Seaman Family Research MR Centre, Foothills Medical Centre, Calgary, AB, Canada
Synopsis
Cerebra-QSM is a modular C++ application for quantitative susceptibility mapping that logs the inputs and results from each stage of the QSM processing pipeline. It provides a user interface for analysis, review and process validation, as well as a scripting interface for batch processing. It is flexible and intuitive, allowing rapid evaluation of algorithms and training of end-users on the specifics of QSM estimates. It has been adopted by multiple researchers, facilitating independent work. Cerebra-QSM provides a robust, simple and scalable framework for evaluation of processing pipelines.
Purpose
Quantitative susceptibility mapping (QSM) is a rapidly advancing technique that seeks to reveal the underlying magnetic susceptibility distribution in tissue from magnetic resonance (MR) phase images. QSM is currently employed to better understand neurodegenerative and inflammatory diseases, measure iron distribution in gray matter, intracerebral hemorrhage volumes and their time-progression and changes in myelin content in white matter.1,2 A large research effort is focused on improving the QSM processing techniques by addressing the challenges found in the process of extracting a quantitative measure of tissue susceptibility from the MR images. As these efforts remain active, the researchers are in need of a platform that allows for rapid implementation, comparison and evaluation of new algorithms and processing steps presented in the state-of-the-art literature. Our objective was to design a software application called Cerebra-QSM to validate and compare new processing QSM pipelines. The application was built as a modular tool with a unified interface, where at each step of the processing pipeline the specific algorithms can be substituted to implement a variant. Cerebra-QSM is intended to be a versatile tool that allows for evaluation of new processing pipelines while imposing traceability and reproducibility of results.Methods
Cerebra-QSM is a program written in C++ using open-source libraries. Starting with the complex-valued GRE (gradient-recalled echo) images in DICOM format: 1) a brain mask is automatically generated, 2) the phase data is unwrapped, 3) the magnetic field is computed, 4) the background field is removed, and 5) regularized dipole deconvolution is used to generate the QSM image. Each step is performed either within the C++ code of the application itself or by calling an external executable; in both cases all interface parameters and data files are logged. The application can re-read the log file to review, or to modify and re-perform any stage of the analysis, or to compute statistics in atlas-generated regions-of-interest, and is capable of performing these operations in batch mode. This functionality was validated by performing eight QSM imaging acquisitions in ten healthy (i.e., no known neurological or psychiatric disorders) female subjects (age 39.2 ± 4.7 y, mean ± std). Between each QSM acquisition, the subjects were removed from the scanner and then repositioned prior to the next imaging acquisition. All images were acquired on a 3T MR scanner (Discovery 750; General Electric Healthcare; Waukesha, WI). QSM images were acquired using an eight-echo GRE sequence (TE1 = 2.1 ms; ΔTE = 2.4 ms; TR = 22 ms; voxel size = 1 mm3; and acquisition matrix = 256 × 256 × 128, parallel imaging with acceleration factor of R = 2)3. The images were then processed using the Cerebra-QSM application and QSM values were obtained in six structures (putamen, P; internal and external globus pallidus, iGP, eGP; caudate, CN; white matter, WM; and cerebrospinal fluid, CSF).Results and Discussion
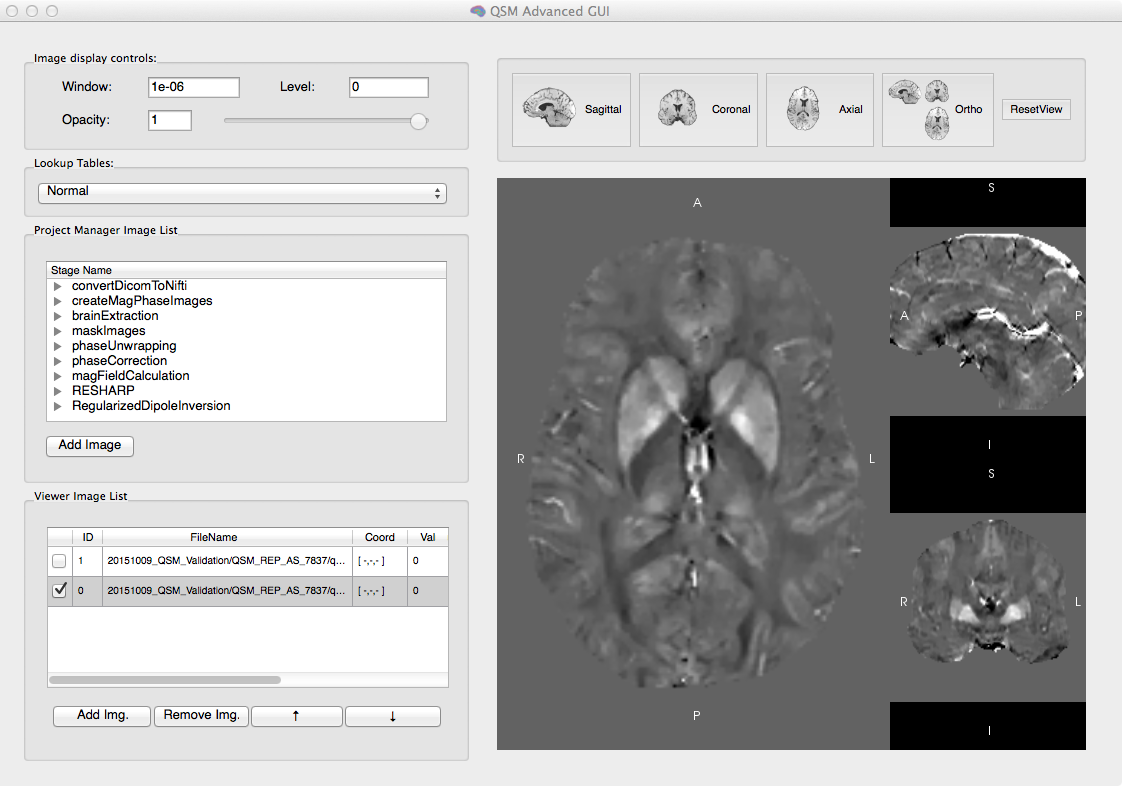
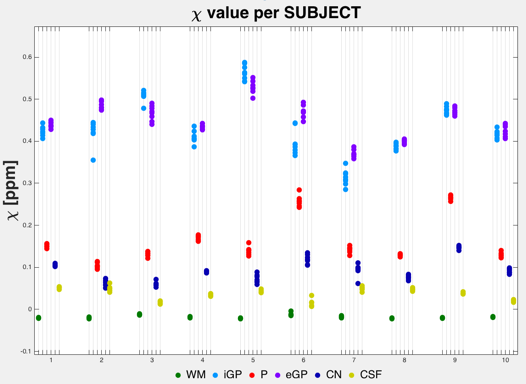
Cerebra-QSM (Fig. 1) was developed from concept to research use in eight months. Its command-line interface (CLI) was used to efficiently process the data for this study on a cluster. The graphical-unit interface (GUI) was used to review the results of each processing stage and the analysis parameters. The GUI also allowed the end-users to easily change processing algorithms and/or adjust parameters at each step of the pipeline. Simple interactive tools, such colour mapping and transparency, facilitated inspecting of the results at each processing step, identifying the source of artefacts and tracing the propagation of inaccuracies in the processing pipeline. The application is self-contained and a useful interactive tool for training. It has been adopted by different research groups, showing it to be both robust and intuitive. Its flexibility has allowed it to accommodate the different imaging data types (pediatric vs adult, healthy vs unhealthy) and specific processing algorithms. Cerebra-QSM’s performance, evaluated using imaging from healthy subjects, showed repeatability of the susceptibility estimates (χ, Fig. 2) with the sources of variability being tissue and subject. Processing of imaging sets multiple times produced equivalent QSM maps.Conclusions
Cerebra-QSM was developed with the purpose of evaluating different methods for estimating QSM and to provide a platform for investigating new QSM processing techniques. The application is robust and easy to use, and provides the ability to trace and review the imaging processing done at a site. Given its flexible design, researchers will be able to perform rapid evaluation of variants of their processing pipeline, facilitating the refinement of their QSM estimates in a shorter amount of time than would have been possible without the tool.Acknowledgements
The development of Cerebra-QSM was funded by an award from Alberta Innovates-Health Solutions as part of the Alberta/Pfizer Translational Research Fund Opportunity. Operational support for this research was provided by the Canadian Institutes for Health Research and the Hopewell Professorship in Brain Imaging. Infrastructure in the Calgary Image Processing and Analysis Centre was partially developed with funding provided by the Canada Foundation for Innovation and the Government of Alberta.References
[1]
Chang et al., Quantitative
susceptibility mapping of intracerebral hemorrhages at various stages. J. Magn.
Reson. Imaging 2016;44:420-425.
[2] Liu et al., Susceptibility-weighted imaging and quantitative susceptibility mapping
in the brain. J. Magn. Reson. Imaging 2015;42:23-41.
[3] Lauzon et
al., Quantitative
susceptibility mapping at 3 T: comparison of acquisition methodologies. NMR Biomed. 2016 [in press].
Figures