3817
A Matlab-based graphical user interface for processing dynamic CEST-MRI data1CMROI, University of Pennsylvania, Philadelphia, PA, United States
Synopsis
A graphical user interface was designed in Matlab to process dynamic CEST-MRI experiments. Field corrections due to B0 and B1 inhomogeneities are applied, ROIs are taken, CEST signal is fitted, and high quality figures are produced with minimal user input. Data is presented for an exercise-induced skeletal muscle creatine elevation experiment though the GUI is highly customizable.
Purpose
CEST-MRI is an emerging technique for indirectly observing metabolism through chemical exchange.1 It has higher sensitivity than direct measurement with MRS, and therefore, high resolution CEST maps can be generated relatively quickly, making CEST-MRI useful for measuring dynamic metabolic changes. For instance, it has been shown that plantar flexion exercise induces muscle-dependent changes in creatine that can be charted using CEST.2
A major impediment to widespread application of CEST-MRI is the required corrections that must be applied in postprocessing in order to get reliable results.3 In particular, field mapping must be done to correct for spatial variation in the relative frequency of saturation as only few offsets are typically acquired. Also, B1+ maps should be acquired as the metabolic-specific exchange efficiency is dependent on the saturation pulse power.4
Here, we present a graphical user interface (GUI) designed in Matlab to organize and process the data from an entire dynamic CEST-MRI experiment quickly with minimal user intervention.
Methods
The first task of the GUI is to organize all the scans that encompass the experiment by selecting the experimental directory in which each scan subdirectory exists. These subdirectories include a series of CEST-weighted images with saturation acquired symmetrically around 0 ppm, a series used to generate field maps, a series used to generate B1+ maps, and a reference series with no saturation. Each series of scans is acquired both before (for baseline) and after a metabolism-changing event. The individual scan subdirectories are automatically organized and populated.
A single button push reads in all the dicoms into matrices, applies the appropriate field map corrections, and then calculates both raw and corrected CEST maps using asymmetry analysis. B0 field maps can be acquired using the WASSR saturation-based method,5 multiple echo GRE, or a dedicated sequence that produces a dicom of the field map with no further processing. B0 correction is applied by interpolating a partial z-spectrum of the CEST-weighted images, shifting the interpolated spectrum based on the measured inhomogeneity, and evaluating at the desired offset. B1+ field maps are acquired using a fast, magnetization prepared method.6 B1 inhomogeneity can then be normalized either with user-provided calibration parameters or assuming a linear dependence.
A second button allows the user to manually draw ROIs on the references images and evaluates the mean and standard deviation of the CEST asymmetry in each before fitting those values as a time series. The model function is provided by the user on initial setup and is customizable.
Descriptive, high quality images can be generated and saved in a variety of formats for publication as well as intermediate images such as B0/B1 field maps and the CEST-weighted images organized symmetrically.
Results
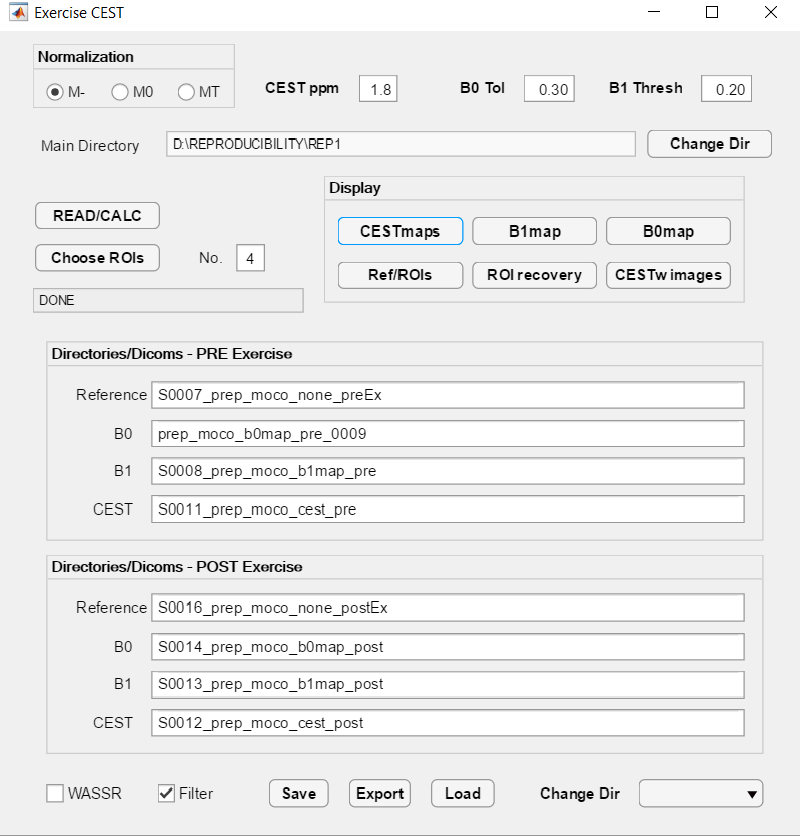
The GUI is illustrated here applied to exercise-induced changes in creatine in skeletal muscle experiments similar to those described in [2]. Figure 1 shows the layout of GUI with user-determined parameters for the type of normalization, number of ROIs, tolerance to field inhomogeneity, etc. after the experimental directory has been selected and the scan subdirectories have been filled. A check box is given that allows the user to quickly switch between WASSR-based or GRE-based B0 field mapping.
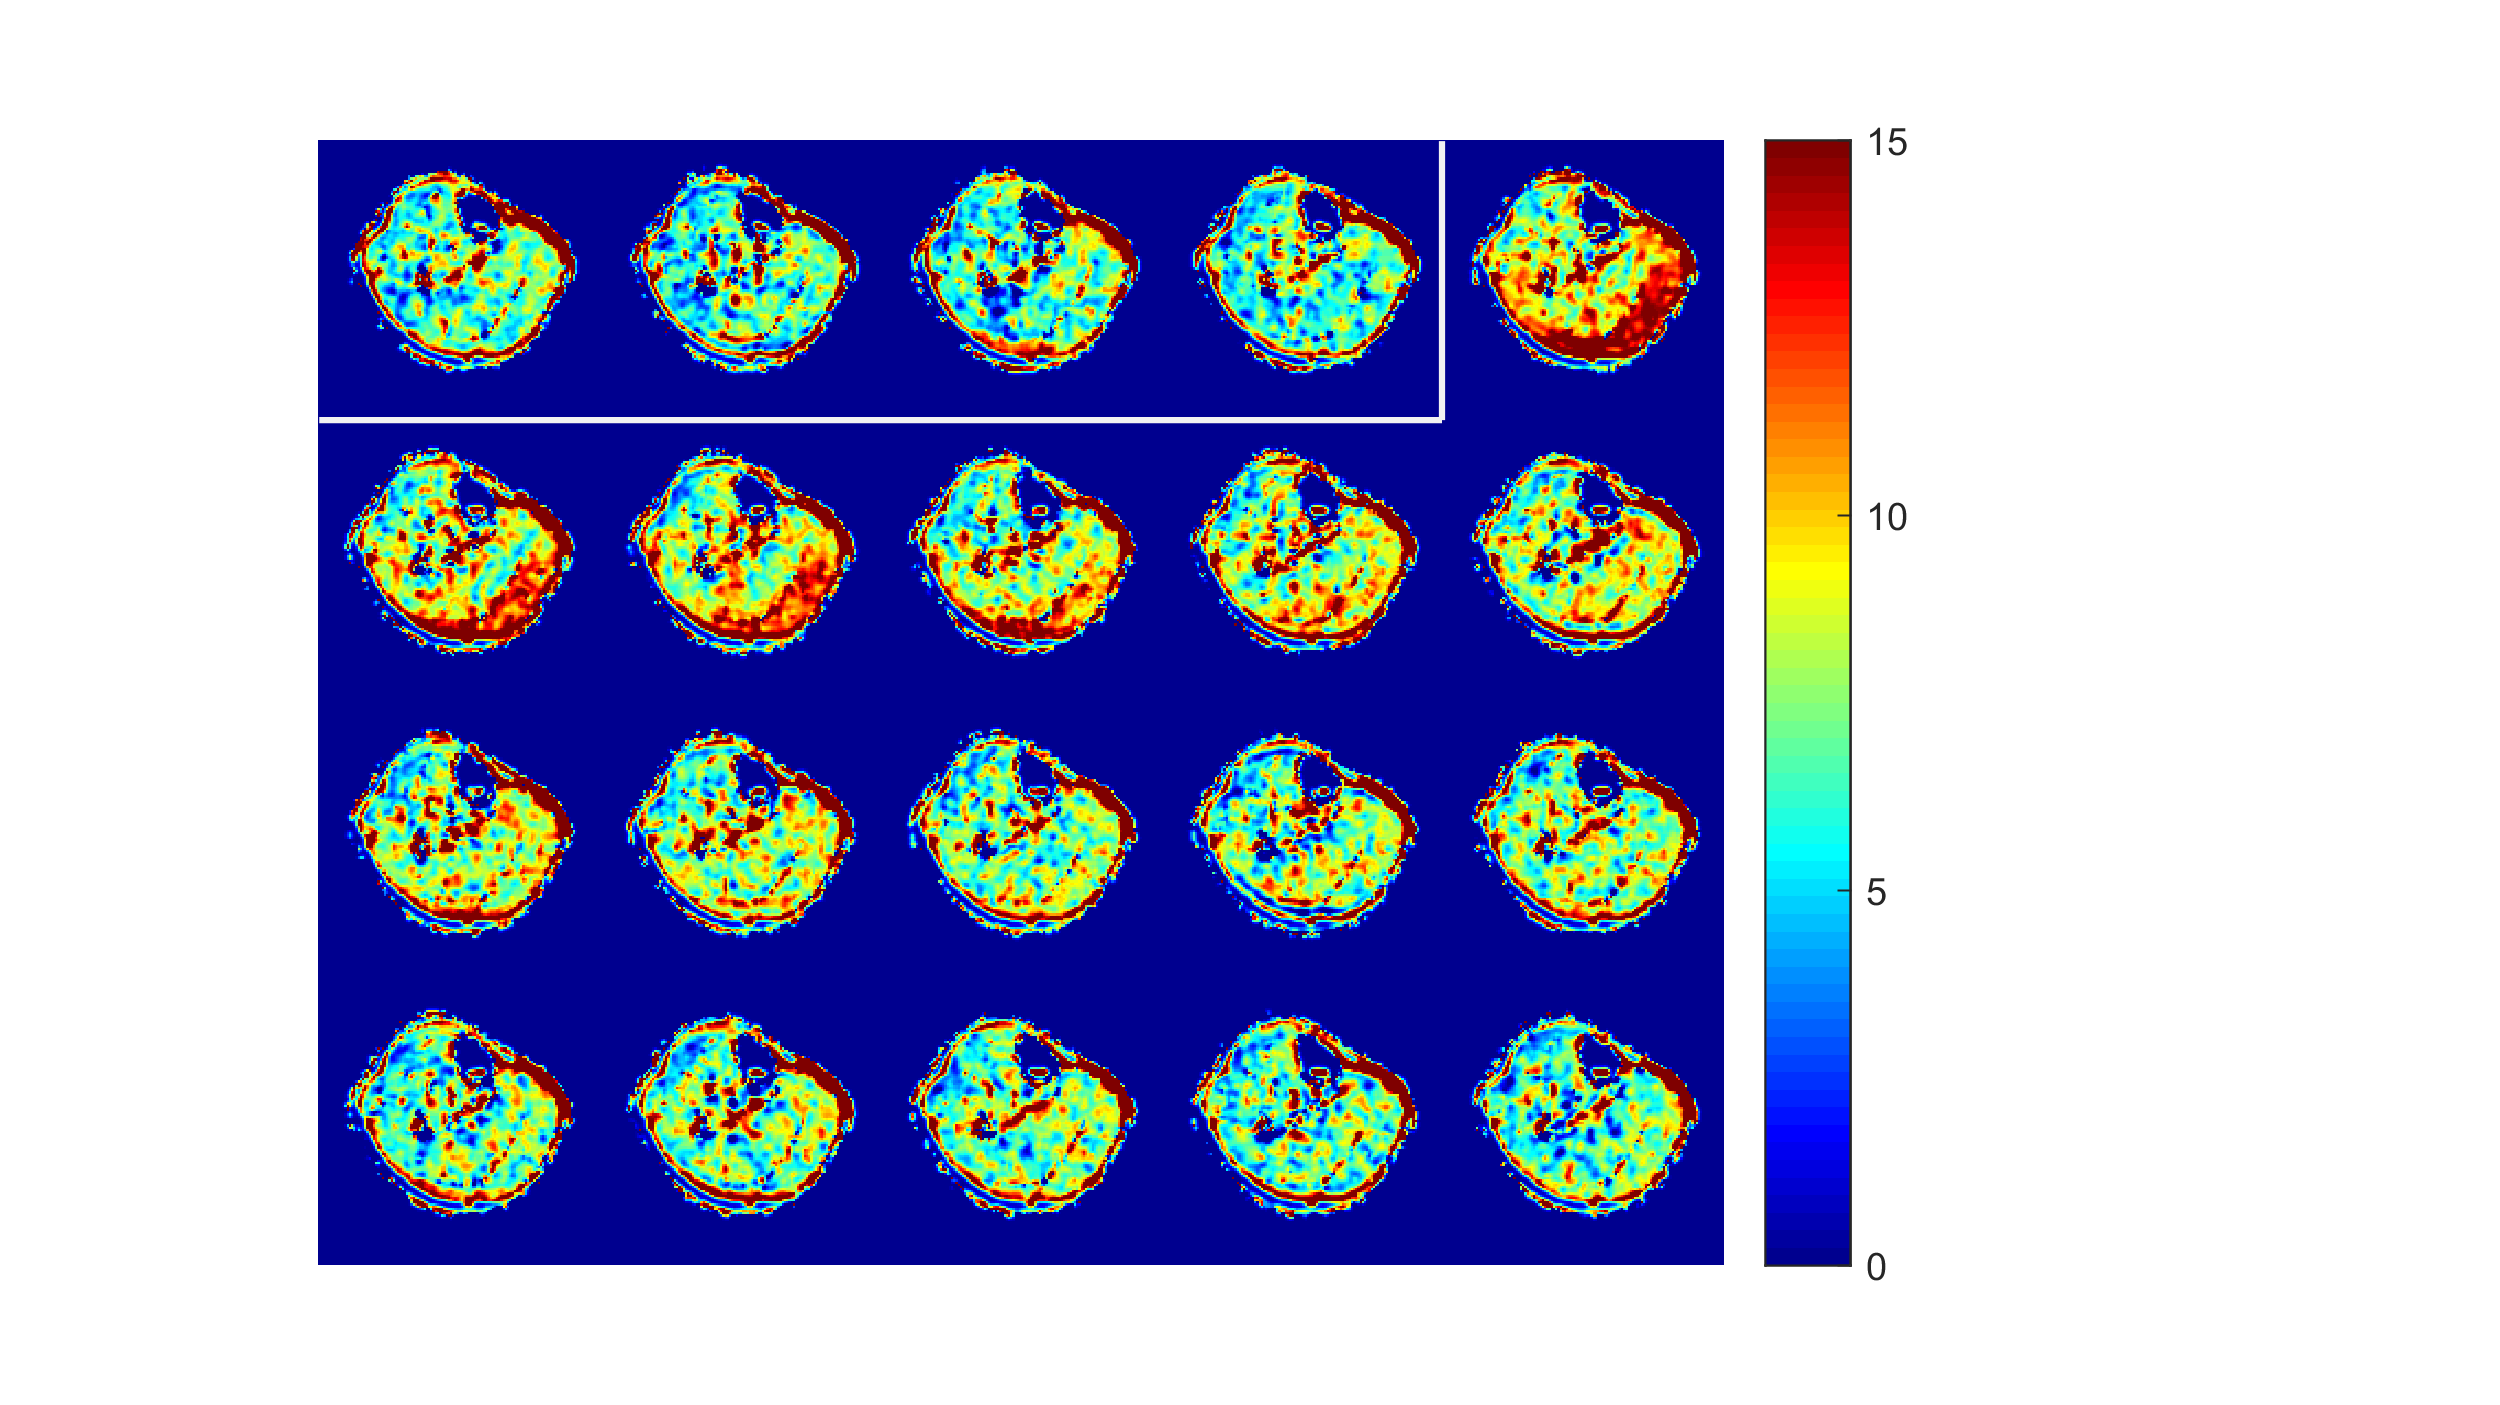
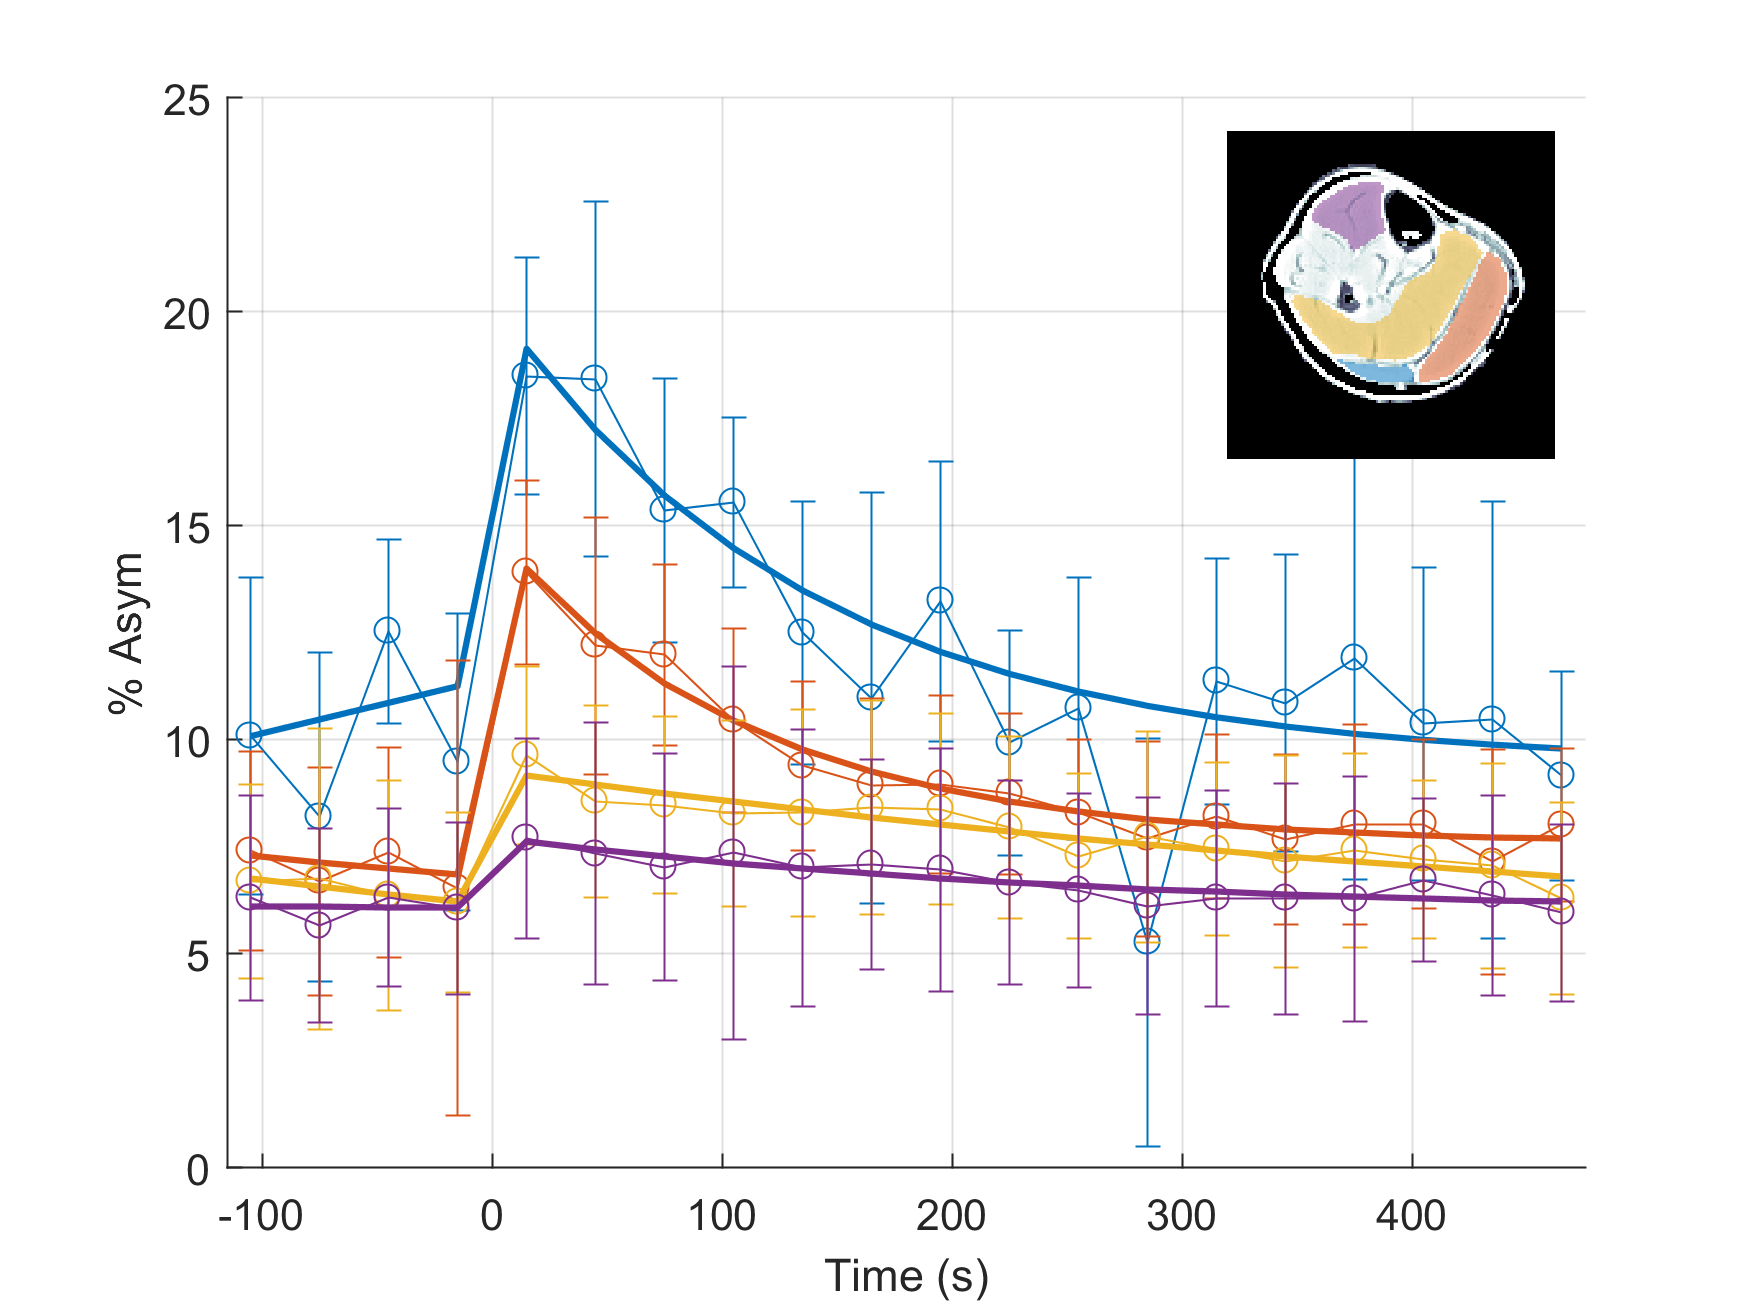
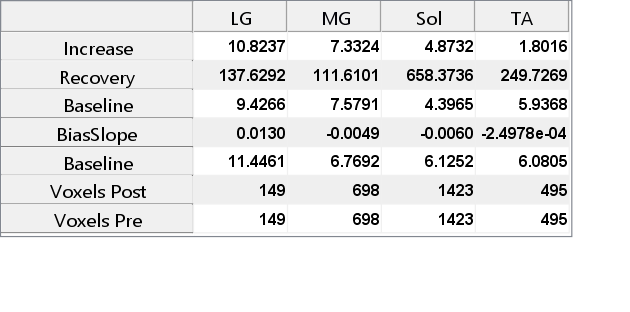
Figures 2-4 show the display results after processing a single experiment. In Figure 2, the CrCEST maps are shown before exercise (separated by the white box) and after. Clear increase in the signal is observed primarily in the gastrocnemius muscles in the back of the calf. Figure 3 shows the time series of the average CrCEST asymmetry values in each ROI and the best fit curves based on an exponential decay model. After a few minutes, the signal has returned to its pre-exercise values. Figure 4 shows the quantitative results for each fitting parameter in each ROI for the curves shown in Fig 3.
Discussion and Conclusion
The results presented here show the characterization of CrCEST recovery in skeletal muscle following exercise. The entire experiment can be processed and high quality graphics can be produced in a couple minutes.
The GUI is designed to be fully customizable to different experiments without requiring significant programming ability, as most of the parameters (including the fitting function, initial values, parameter names, display color preference, etc.) can be changed via a text file that is read upon opening the program.
Acknowledgements
This project was supported by the National Institute of Biomedical Imaging and Bioengineering of the National Institutes of Health through Grant Number P41-EB015893 and the National Institute of Neurological Disorders and Stroke through Award Number R01NS087516.References
[1] Steven D Wolff, Robert S Balaban, NMR imaging of labile proton exchange, Journal of Magnetic Resonance (1969), Volume 86, Issue 1, 1990, Pages 164-169, ISSN 0022-2364, http://dx.doi.org/10.1016/0022-2364(90)90220-4.
[2] Kogan, F., Haris, M., Debrosse, C., Singh, A., Nanga, R. P., Cai, K., Hariharan, H. and Reddy, R. (2014), In vivo chemical exchange saturation transfer imaging of creatine (CrCEST) in skeletal muscle at 3T. J. Magn. Reson. Imaging, 40: 596–602. doi: 10.1002/jmri.24412
[3] Sun, P. Z., Farrar, C. T. and Sorensen, A. G. (2007), Correction for artifacts induced by B0 and B1 field inhomogeneities in pH-sensitive chemical exchange saturation transfer (CEST) imaging. Magn Reson Med, 58: 1207–1215. doi: 10.1002/mrm.21398
[4] Singh, A., Cai, K., Haris, M., Hariharan, H. and Reddy, R. (2013), On B1 inhomogeneity correction of in vivo human brain glutamate chemical exchange saturation transfer contrast at 7T. Magn Reson Med, 69: 818–824. doi: 10.1002/mrm.24290
[5] Kim, M., Gillen, J., Landman, B. A., Zhou, J. and van Zijl, P. C.M. (2009), Water saturation shift referencing (WASSR) for chemical exchange saturation transfer (CEST) experiments. Magn Reson Med, 61: 1441–1450. doi: 10.1002/mrm.21873
[6] Steffen Volz, Ulrike Nöth, Anna Rotarska-Jagiela, Ralf Deichmann, A fast B1-mapping method for the correction and normalization of magnetization transfer ratio maps at 3 T, NeuroImage, Volume 49, Issue 4, 15 February 2010, Pages 3015-3026, ISSN 1053-8119, http://dx.doi.org/10.1016/j.neuroimage.2009.11.054.
Figures