3816
PyMRT and DCMPI: two new Python packages for MRI data analysis1NMR Unit, Max Planck Institute for Human Cognitive and Brain Sciences, Leipzig, Germany
Synopsis
Among the many packages available for data analysis in magnetic resonance imaging, only few offer specific tools for quantitative MRI. Additional limitations often come from implementation details, where fast development cycles and code maintainability can be difficult to achieve. Recently, Python has emerged as an ideal tool for the development of software for scientific computing.Here, we propose two easily extensible software packages implemented in Python: PyMRT for the analysis of MRI data, notably for quantitative applications; DCMPI for simplifying and automatize portions of the data collection step.
Purpose
Over the past few years, many excellent tools have been developed for the processing of magnetic resonance (MR) data, like FSL1, SPM2, FreeSurfer3, or AFNI4. However, most of them were designed for very specific MR purposes (e.g. functional MR, morphometry, etc.) and/or suffer from severe implementation penalties (e.g use of proprietary software, lack for fast development cycles, etc.). Python offers an excellent and open source platform for software development which can overcome some of these limitations. In recent years it has experienced a wide adoption by the scientific community4,5,6, including some efforts in MRI7,8,9.
Here, we present two Python packages that were developed to ease the analysis of MR data:
- PyMRT: Python MR Tools is an extensible and adaptable set of tools (a "Swiss Army knife") for the analysis of (mainly quantitative) MR data.
- DCMPI: DICOM Preprocessing Interface is a library providing automated information extraction tools from DICOM files containing MR acquisitions.
The ultimate goal of PyMRT is to provide a comprehensive and easily extensible collection of algorithms to experiment with MRI analyses in a mature environment supporting fast development cycles. DCMPI is meant to provide a simple and effective means of dealing with the output of the scanner, which could be easily used as input for PyMRT tools.
Methods
The two packages are implemented in Python following a modular and easily extensible architecture, with a very general design.
In particular, the following packages are used extensively:
- NumPy for fast array functionality;
- SciPy for additional scientific and data analysis support;
- SciKit.Image for state-of-the-art image manipulation tools;
- SciKit.Learn providing efficient machine learning algorithms;
- MatPlotLib (and Seaborn) for plot rendering;
- NiBabel and PyDICOM offering input/output capabilities for common MRI file formats;
- pandas and xarray for statistical analyses.
Some of the features are implemented using external tools (e.g. dcm2nii or FSL), with plans to develop native ports, leaving external tools as non-preferred options. Whenever possible, simultaneous human/machine friendly file formats were used (e.g. JSON, YAML).
Results
PyMRT consist of several modules for:
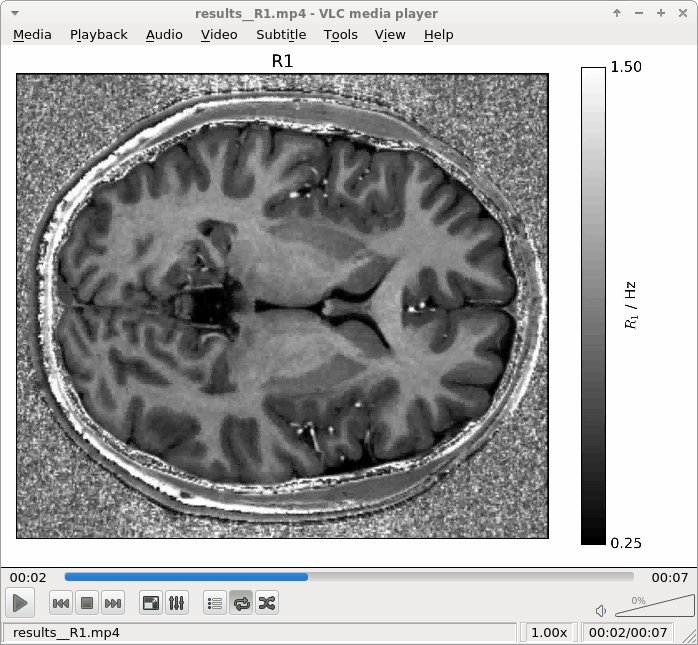
- calculating qMRI maps using different methods (e.g. several $$$T_1$$$, $$$T_2^*$$$ mapping implementations) with some support for automatic input detection;
- fast Bloch equation simulation using the matrix algebra approach for an arbitrary number of spin isochromats;
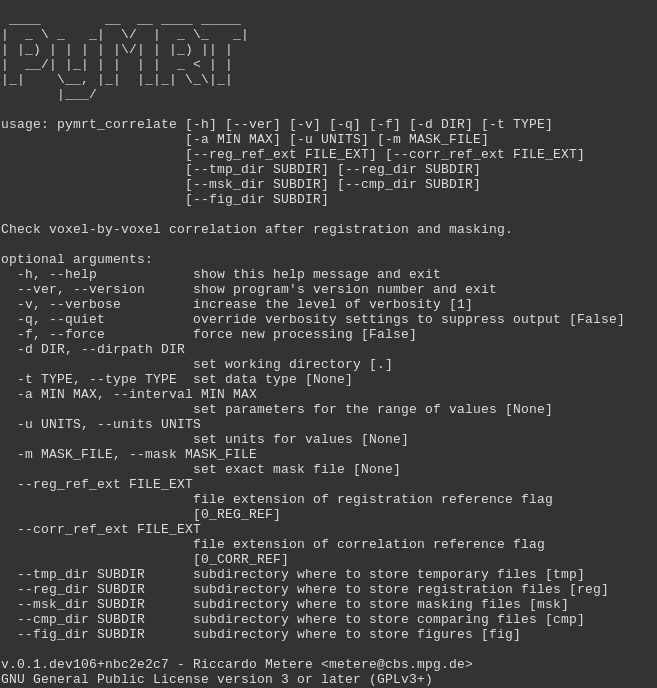
- automated voxel-by-voxel binary comparison of N-D arrays (difference, correlation, histograms, etc.);
- geometric generation and manipulation tools (e.g. creation of N-D geometric objects, alignment of the principal axes of an object to the orthogonal basis, etc.);
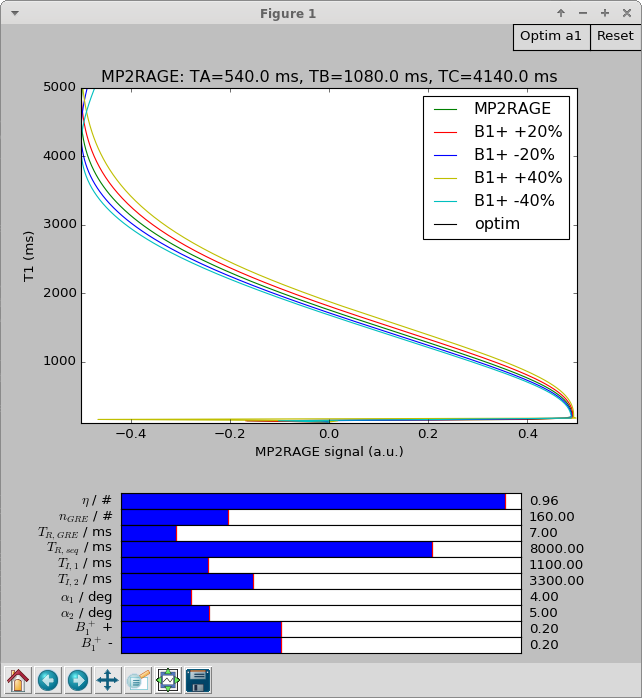
- sequence specific tools (e.g. analytical solution of the signal expression for common sequences, MP2RAGE-specific tool for determining optimal parameters - see Fig. [2], etc.);
- additional input/output tools (e.g. for parsing Siemens TWIX files, Bruker-NMR JCAMP-DX files, etc.).
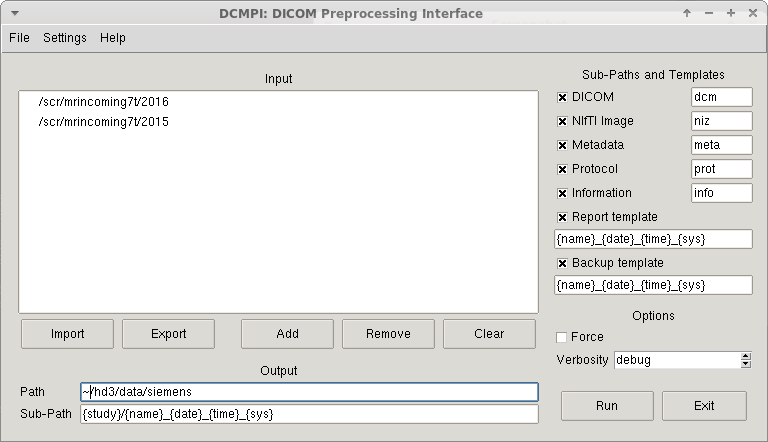
DCMPI includes modules to:
- find valid DICOM files in a path and copy/move/sort them for later use;
- extract data and/or additional information (metadata) from DICOM files;
- produce sensible HTML or PDF reports for a quick human-friendly overview;
- manage safe backup/restore operations.
At the time of writing, alpha versions of both packages are available in the Python Package Index (PyPI):
- PyMRT: https://pypi.python.org/pypi/pymrt
- DCMPI: https://pypi.python.org/pypi/dcmpi
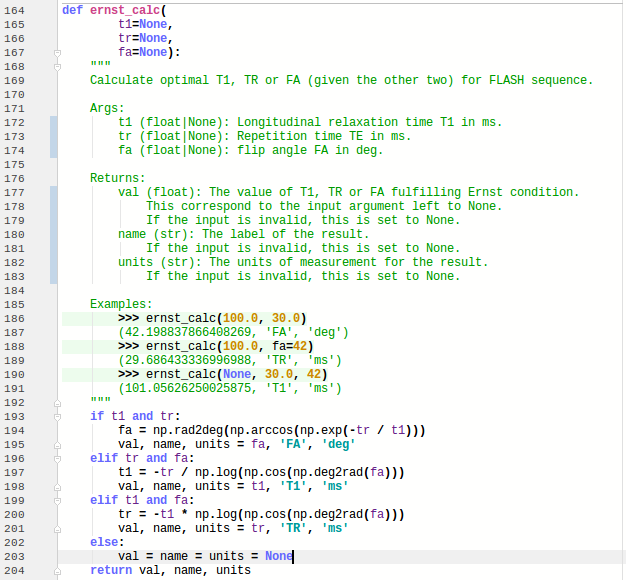
Here we report figures for example code (Fig.[1]), user interface (UI) tools (Fig.[2],[3],[4]), and experimental results (Fig.[5]).
Discussion
Both packages are in the alpha development stage at the time of writing, meaning that they are not ready for production use and its interface is expected to undergo some (possibly major) changes that could break backward-compatibility.
The main current limitation is that its testing is limited to few platforms/vendors/acquisitions.
In particular, future development will focus on the implementation of:
- additional common data analysis algorithms;
- rewrite of the computation modules to simplify the input of metadata;
- automatic generation of standard command-line interface (CLI), text user interface (TUI) and/or graphical user interface (GUI) elements from the Python interface;
- improvements on the plotting / exploring tools;
- additional tools for community-driven extension.
Compared to other software packages, it has a stronger focus on quantitative analysis, but little support for functional MR. The use of Python translates into easy access to a well-designed and mature interactive programming language and environment with support for fast development cycle (compared to compiled languages), while retaining remarkable execution speed.
Conclusion
PyMRT offers an extensible set of data analysis tools (some of which specific to qMRI) in a clean and rich environment, and DCMPI complements it by providing a bridge for the acquisitions from the MR scanner to the data analysis tools.Acknowledgements
We express our gratitude to the open source community for providing the excellent tools upon which this software is provided.
Funded by: EU through the 'HiMR' Marie Curie ITN (FP7-PEOPLE-2012-ITN-316716), the Max Planck Society through IMPRS NeuroCom, and the Helmholtz Alliance 'ICEMED'.
References
1. Jenkinson, M., Beckmann, C.F., Behrens, T.E.J., Woolrich, M.W., Smith, S.M., 2012. FSL. NeuroImage, 20 YEARS OF fMRI 62, 782–790. doi:10.1016/j.neuroimage.2011.09.015
2. Ashburner, J., 2009. Computational anatomy with the SPM software. Magnetic Resonance Imaging, Proceedings of the International School on Magnetic Resonance and Brain Function 27, 1163–1174. doi:10.1016/j.mri.2009.01.006
3. Fischl, B., 2012. FreeSurfer. Neuroimage 62, 774–781. doi:10.1016/j.neuroimage.2012.01.021
4. Cox, R.W., 2012. AFNI: What a long strange trip it’s been. NeuroImage, 20 YEARS OF fMRI 62, 743–747. doi:10.1016/j.neuroimage.2011.08.056
5. Millman, K.J., Aivazis, M., 2011. Python for Scientists and Engineers. Computing in Science Engineering 13, 9–12. doi:10.1109/MCSE.2011.36
6. Oliphant, T.E., 2007. Python for Scientific Computing. Computing in Science & Engineering 9, 10–20. doi:10.1109/MCSE.2007.58
7. Hunter, J.D., 2007. Matplotlib: A 2D Graphics Environment. Computing in Science & Engineering 9, 90–95. doi:10.1109/MCSE.2007.55
8. Gorgolewski, K., Burns, C.D., Madison, C., Clark, D., Halchenko, Y.O., Waskom, M.L., Ghosh, S.S., 2011. Nipype: a flexible, lightweight and extensible neuroimaging data processing framework in Python. Front. Neuroinform. 5, 13. doi:10.3389/fninf.2011.00013
9. Vincent, T., Badillo, S., Risser, L., Chaari, L., Bakhous, C., Forbes, F., Ciuciu, P., 2014. Flexible multivariate hemodynamics fMRI data analyses and simulations with PyHRF. Front. Neurosci 8, 67. doi:10.3389/fnins.2014.00067
10. Blackledge, M.D., Collins, D.J., Koh, D.-M., Leach, M.O., 2016. Rapid development of image analysis research tools: Bridging the gap between researcher and clinician with pyOsiriX. Computers in Biology and Medicine 69, 203–212. doi:10.1016/j.compbiomed.2015.12.002
Figures