3815
ImFEATbox: An MR Image Processing Toolbox for Extracting and Analyzing Features1Diagnostic and Interventional Radiology, University Hospital of Tübingen, Tübingen, Germany, 2Institute of Signal Processing and System Theory, University of Stuttgart, Stuttgart, Germany
Synopsis
In various image processing applications, finding appropriate mathematical descriptions which reflect or extract characteristics of the underlying content from acquired MR images is an important and crucial step. There exists a variety of features which can be used for MRI, but which ones are the most meaningful depends on the underlying scientific or diagnostic question/application as well as the image itself. To reduce the time spent searching for, implementing and testing features for a specific application, we provide a toolbox of features along with a GUI to easily choose and extract them, which will be made publicly available.
Purpose
Digital post processing of MR images is an important research topic. While human visual perception is able to recognize characteristic traits of images and differentiate them by distinctive properties like homogeneity, spatial structure or contrast, a machine interprets an image by measures calculated from its numeric representation. Thus, a crucial step in every image processing application is choosing the optimal mathematical representation of the visual properties of an acquired image. These features determine how well any image processing can be conducted or which information can be extracted from the image.
Over the past years, a wide range of features have been proposed to be used in medical image analysis1-3. However, finding the best features for a specific application can be a difficult and time demanding task. Using not enough or the wrong features can cause poor results, using too many on the other hand leads to high computation times and redundant or insignificant information in the extracted features.
ImFEATbox (Image Feature Extraction and Analyzation Toolbox) provides both an assortment of implementations to extract features and a graphical user interface (GUI) to simplify the process of researching, implementing and testing features for the selection of the best representing set for a specific image processing application. The extracted features have been used in context of automated MR image quality assessment4-6 but should be applicable to various image processing tasks not limited to MR images. ImFEATbox is available for both Matlab and Python to enable access for a wide range of users. To the best of our knowledge, no toolbox combining these capabilities is available yet. Other available toolboxes7-10 providing feature extraction algorithms are either limited in terms of feature variety or originally developed as classification frameworks for specific applications and problems and thus lack the general useability in MR image processing we intended with our work.
Methods
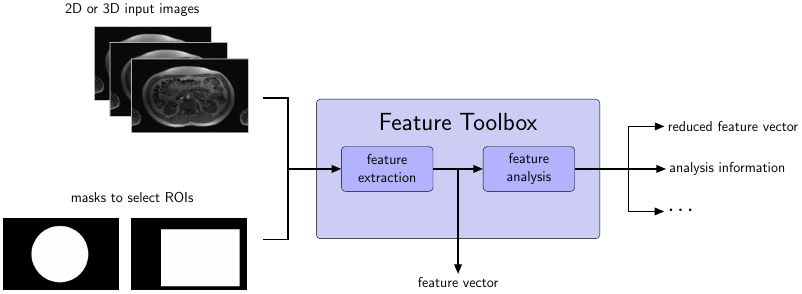
ImFEATbox can directly handle input in DICOM, NiFTI, MDH, GIPL, MAT, JPEG, PNG or TIFF format. If desired, a mask can be added to the input data to allow performing feature extraction only on a specified region or volume of interest. Before the actual feature extraction step, ImFEATbox is able to perform required preprocessing (e.g. scale conversion, segmentation) on the input images, if desired.
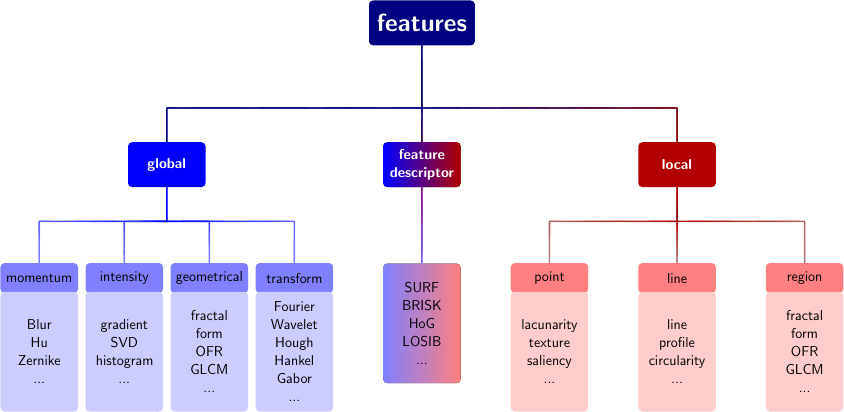
Up to now, ImFEATbox provides a total of 13757 features including global and local features as well as feature descriptors (see Figure 1). The features allow various parametrizations and can be performed for 2D or 3D input data. It is possible to extract either all features calculated by a specific feature implementation or choose only a subset based on certain characteristics, e.g. extract only features based on entropy or correlation. An up-to-date list of implemented features can be found online. Since ImFEATbox is constantly being extended, more features are added in the future.
Besides feature extraction, implementations for different analyzation tasks are provided by ImFEATbox. Evaluation of the selected set of features (e.g. redundancy) and different feature reduction techniques can be performed, if desired. Figure 2 depicts the structure of the toolbox.
Although being primarily developed in Matlab, ImFEATbox includes interfaces to both Matlab and Python. Since Python has lately been gaining more attention in the machine learning community11-13, implementations in Python are being added to eventually provide a native toolbox for Python users.
The included GUI allows users to handle the functions provided by ImFEATbox whithout requiring knowledge about the programming language. Specifically, the user is able to import input images, choose desired combinations of features to be extracted, change various parameters for the extraction process or analyze the extracted set of features conveniently using the GUI.
The Toolbox inluding all algorithms will be made available online under Apache license 2.0 at: https://github.com/annikaliebgott/ImFEATbox
Results
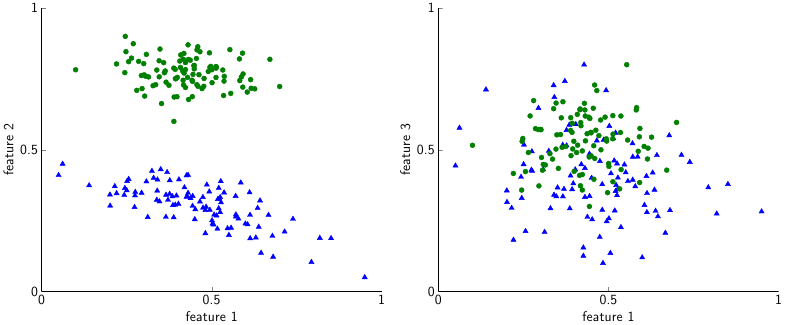
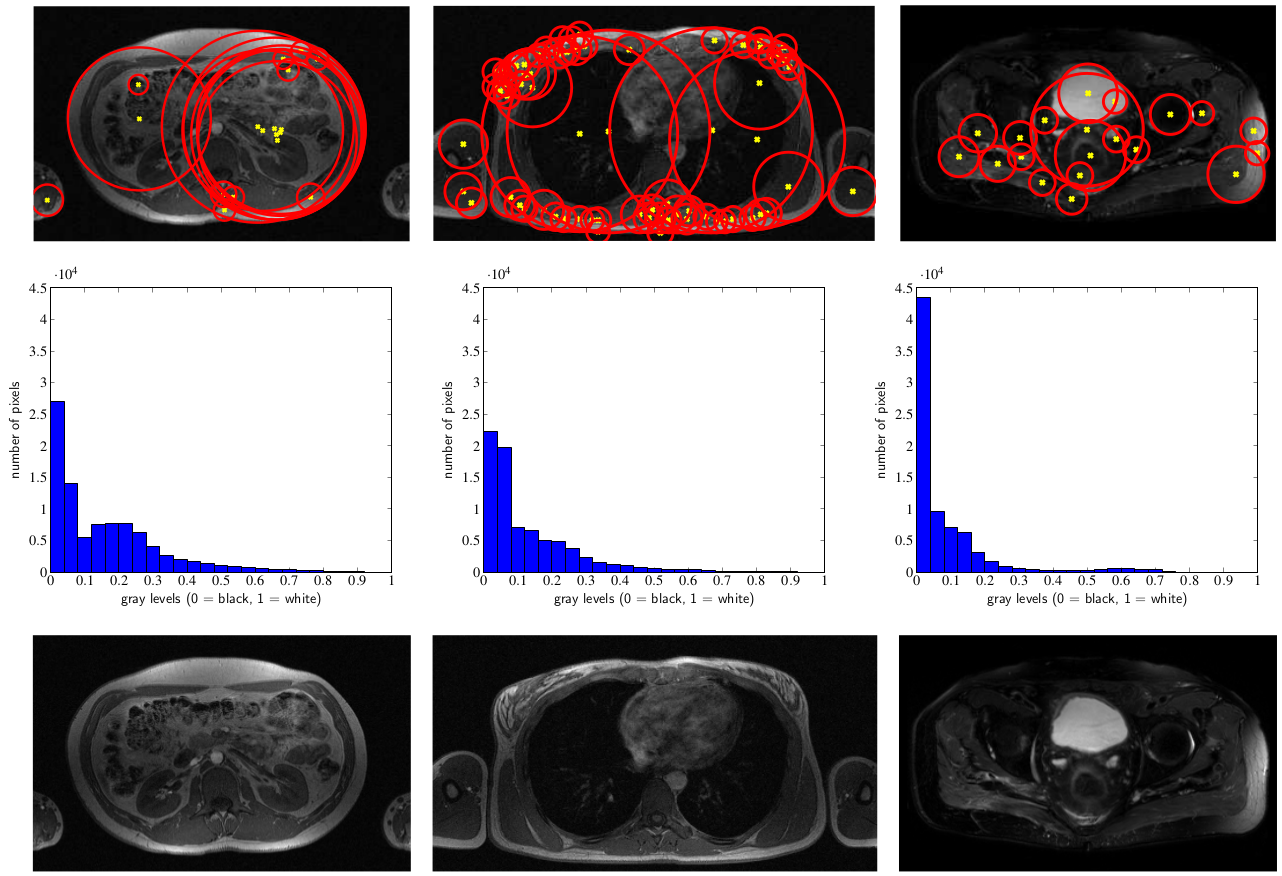
ImFEATbox has been tested with exemplary datasets to illustrate its potential. Figure 3 visualizes the importance of choosing the right features, which is confirmed by the results of a classifier trained with different feature combinations shown in Figure 4. To illustrate how extracted features vary for different images, two exemplary measures calculated from MR images are visualized in Figure 5.Conclusion
The proposed toolbox provides an assortment of algorithms to perform feature extraction on MR and other medical images as well as several analyzation tools and a GUI to allow easy access to the implemented functionalities. The included algorithms permit a reduction in time needed to research and implement the right features and are applicable to a variety of applications. Thus, ImFEATbox is beneficial to a wide range of researchers working on different problems concerning MR image processing.Acknowledgements
No acknowledgement found.References
1. Shah, S., and Chauhan, N. (2016). Techniques for Detection and Analysis of Tumours from Brain MRI Images: A Review. Journal of Biomedical Engineering and Medical Imaging, 3(1), 09. doi:http://dx.doi.org/10.14738/jbemi.31.1696
2. Smitha P, Shaji.L and Dr.Mini.MG. A Review of Medical Image Classification Techniques. IJCA Proceedings on International Conference on VLSI, Communications and Instrumentation (ICVCI) (11):34–38, 2011.
3. A.Sindhu, S.Meera: A Survey on Detecting Brain Tumor in MRI Images Using Image Processing Techniques, International Journal of Innovative Research in Computer and Communication Engineering, Vol. 3, Issue 1, January 2015
4. T. Küstner, P. Bahar, C. Würslin, S. Gatidis, P. Martirosian, NF. Schwenzer, H. Schmidt and B. Yang: A new approach for automatic image quality assessment, Proceedings of the Annual Meeting ISMRM 2015, June 2015, Toronto, Canada.
5. T. Küstner, M. Schwartz, A. Liebgott, P. Martirosian, S. Gatidis, NF. Schwenzer, F. Schick, H. Schmidt and B. Yang: An Active Learning platform for automatic MR image quality assessment, Proceedings of the Annual Meeting ISMRM 2016, May 2016, Singapore.
6. A. Liebgott, T. Küstner, S. Gatidis, F. Schick an B. Yang: Active Learning for Magnetic Resonance Image Quality Assessment, Proceedings of the 41th IEEE International Conference on Acoustics, Speech and Signal Processing ICASSP 2016, March 2016, Shanghai, China.
7. Kus, R.: FEATbox (Feature Extraction \& clAssification Toolbox), version 1.0 [online]. 2016. Available online: http://www.iba.muni.cz/index-en.php?pg=research--data-analysis-tools--featbox
8. Zhongming Liu, Jacco A. de Zwart, Peter van Gelderen, Li-Wei Kuo, Jeff H. Duyn: Statistical feature extraction for artifact removal from concurrent fMRI-EEG recordings, NeuroImage, Volume 59, Issue 3, 1 February 2012, Pages 2073-2087, ISSN 1053-8119,\\ http://dx.doi.org/10.1016/j.neuroimage.2011.10.042
9. Pattern Recognition Of Brain Image Data (PROBID). Available online: \\http://www.kcl.ac.uk/ioppn/depts/neuroimaging/research/imaginganalysis/Software/PROBID.aspx
10. Schrouff, J., Rosa, M. J., Rondina, J. M., Marquand, A. F., Chu, C., Ashburner, J., … Mourão-Miranda, J.: PRoNTo: Pattern Recognition for Neuroimaging Toolbox. Neuroinformatics, 11(3), 2013, 319–337. http://doi.org/10.1007/s12021-013-9178-1
11. Chollet, Francois: Keras. Published on GitHub (2015). Available online: https://github.com/fchollet/keras
12. Raschka, Sebastian. Python machine learning. Birmingham, UK: Packt Publishing, 2015. Print.
13. Scikit-learn: Machine Learning in Python, Pedregosa et al., JMLR 12, pp. 2825-2830, 2011.
Figures