3811
Developing an automated MRI Decision support system: MIROR a non-region specific modular analysis toolbox1University of Birmingham, Birmingham, United Kingdom, 2Birmingham children hospital, Birmingham, United Kingdom
Synopsis
There is a need for an MRI diagnostic analysis-tool which can provide healthcare investigators with a platform for extraction of relevant information and allow for comparison with similar cases to aid decision-making. The aim of this study was to develop a modular, non-region-specific Medical-Image-Region-of-interest-analysis-tool and Repository (MIROR) in order for advanced MRI techniques to become a part of the clinical routine. Here, the first development phase is presented as applied to diffusion-weighted-imaging of pediatric body-tumors combined with comparison to a repository of cases. MIROR acts as a foundation which can be extended to more advanced image-analysis and sophisticated decision-support.
PURPOSE:
Advances in magnetic resonance imaging (MRI) technology has resulted in increased flexibility and power of MRI in resolving demanding diagnostic problems. Moreover, Introduction of clinical decision-Support-systems (CDSs) has underlined the need for a MRI analysis-tool which can provide healthcare investigators with a platform for extraction of relevant information and allow for comparison with other available resources to aid decision-making. The aim of this study was to design and develop an atlas-based, modular and non-region-specific Medical Image Region of interest analysis-tool and Repository (MIROR) for automatic processing, classification and evaluation of MRI data in order for advanced MRI techniques to become a part of the clinical routine. Here, the first development phase is presented as applied to diffusion weighted imaging. MIROR acts as a foundation which can be extended to more advanced image-analysis and sophisticated decision-support.METHODS:
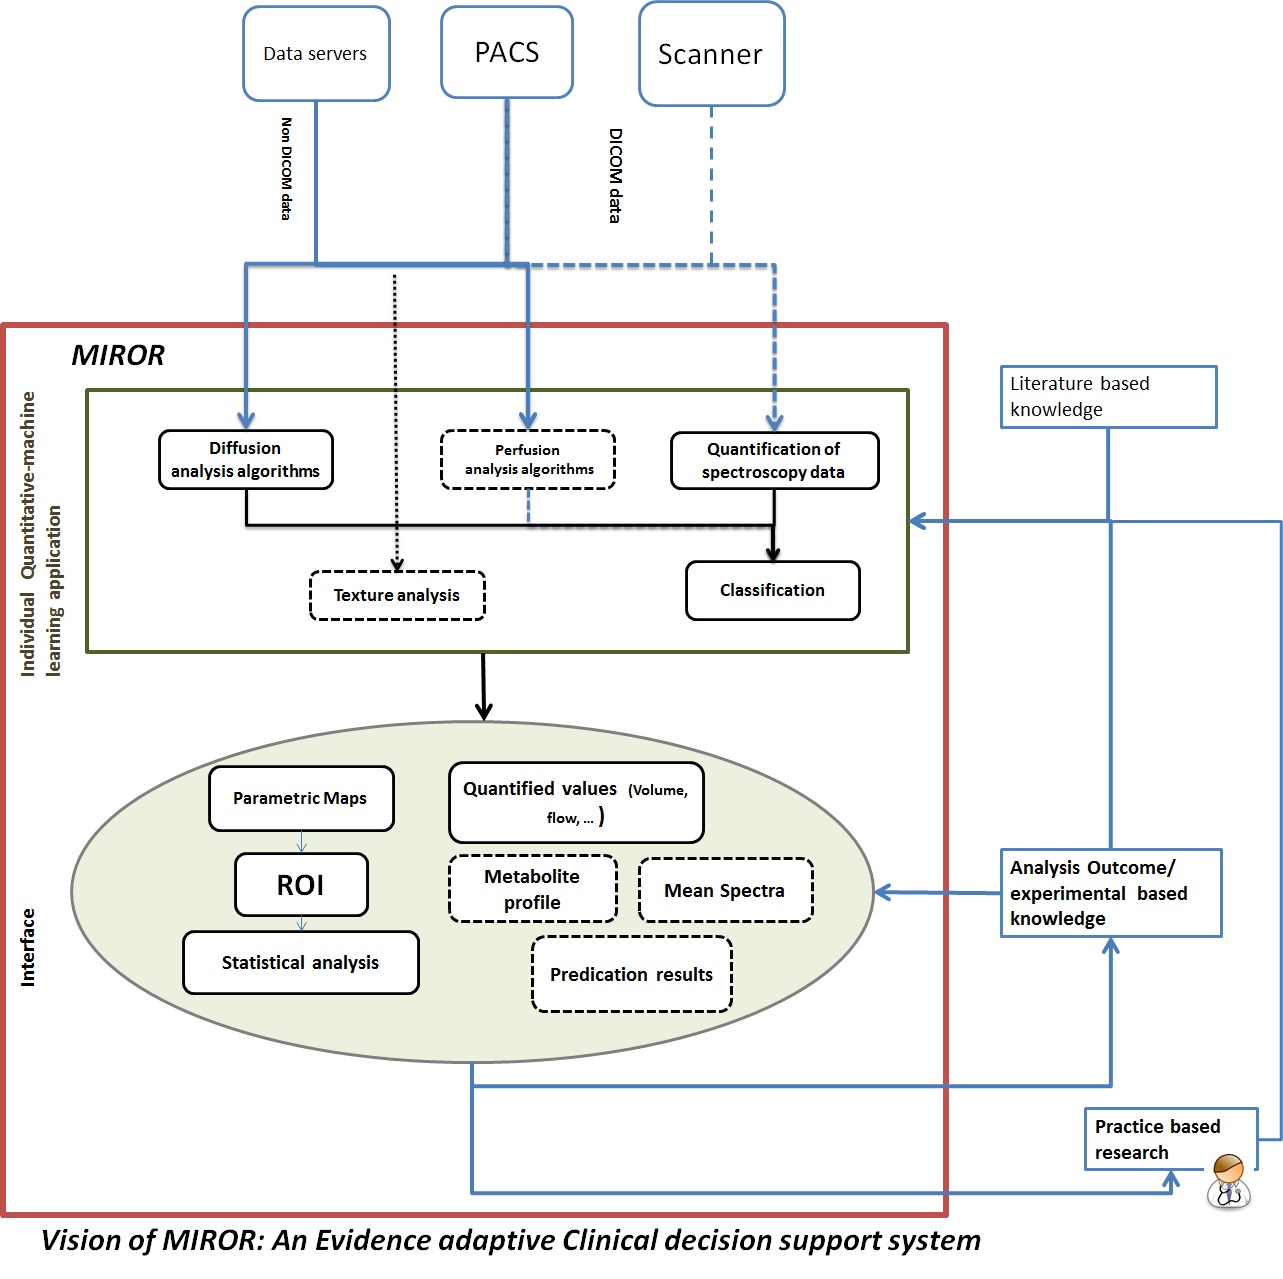
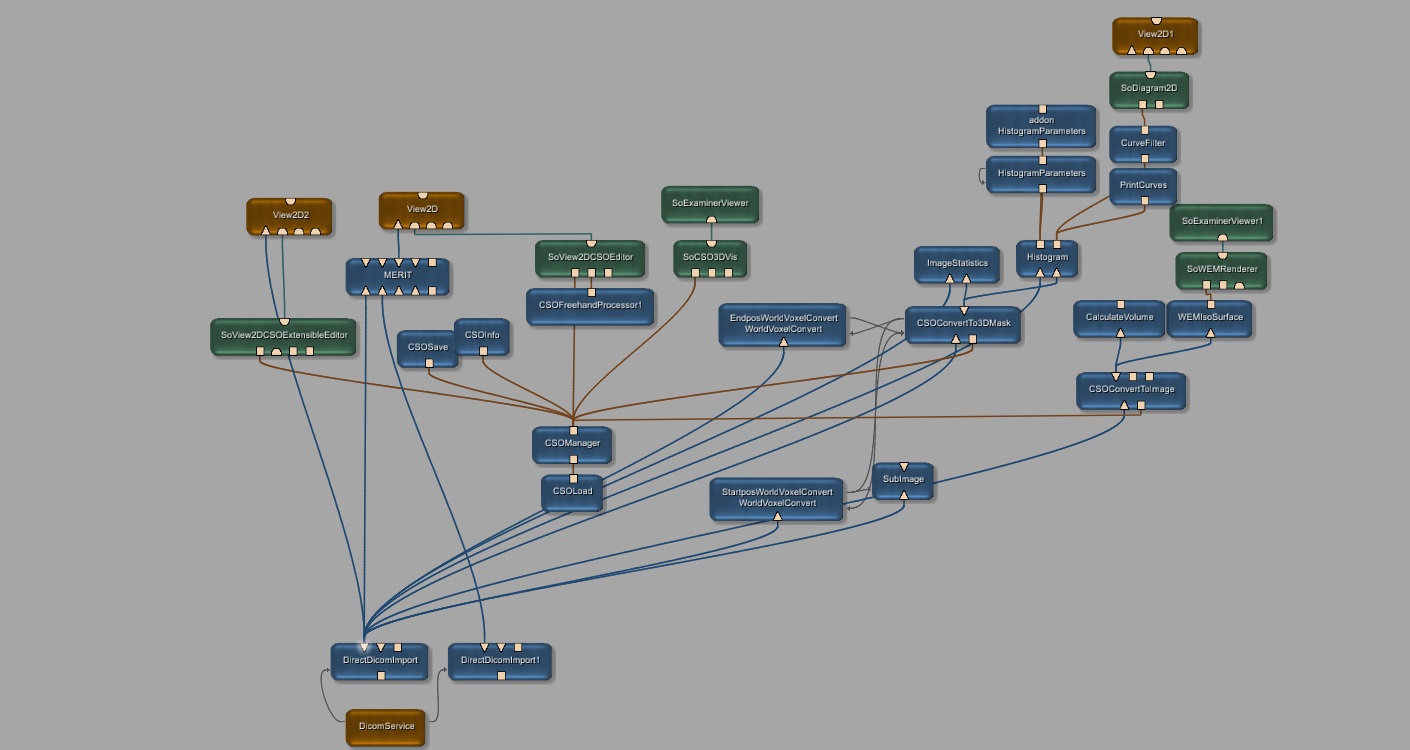
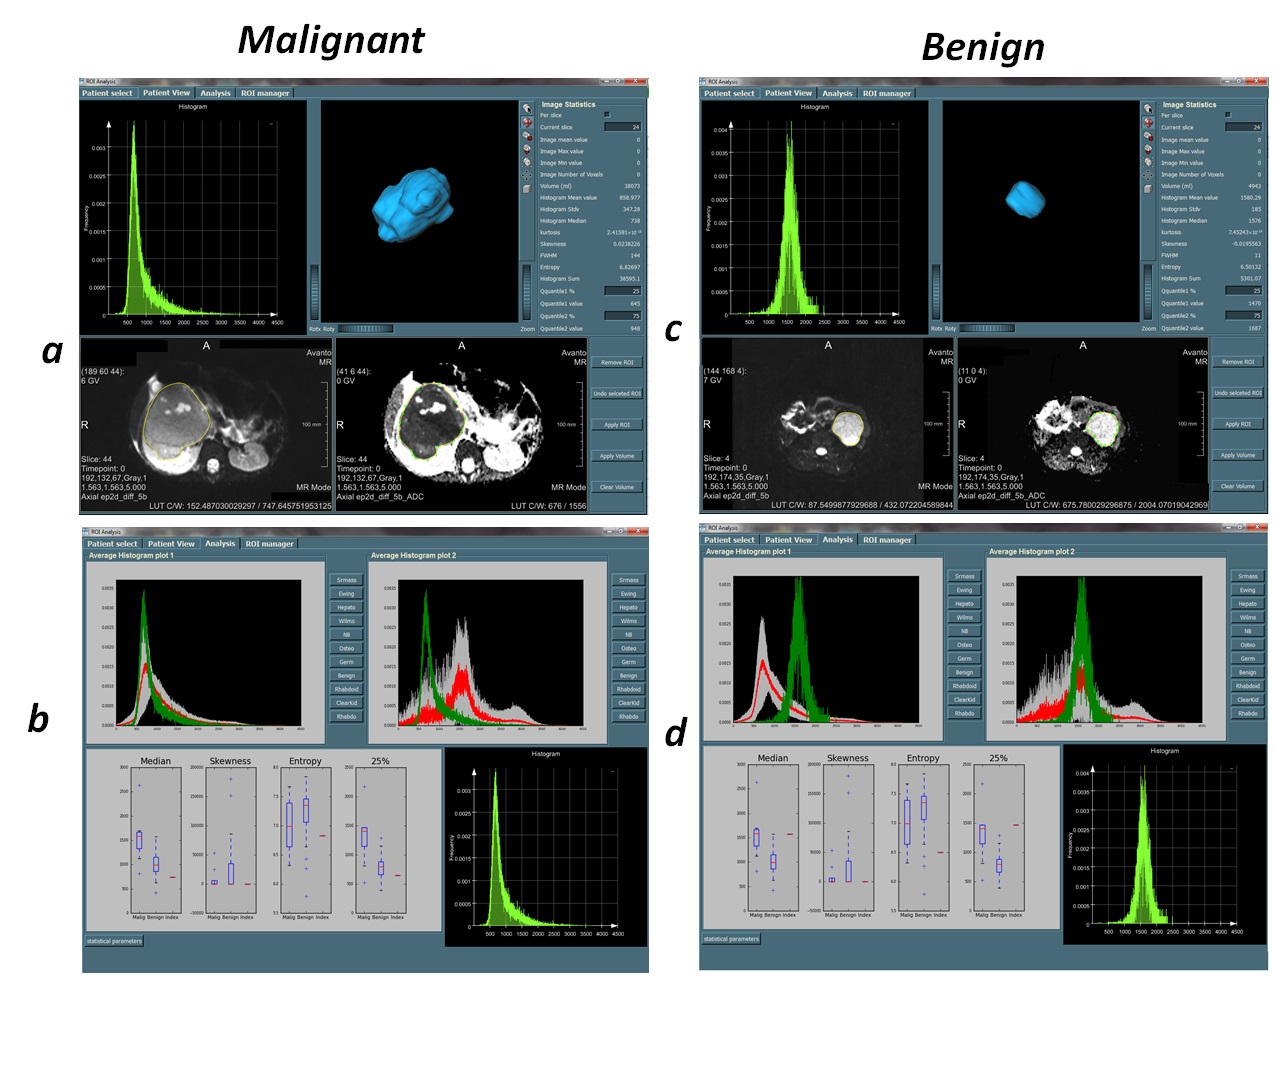
An evidence-adaptive1 modular architecture was used in the design of MIROR to allow for future addition of new functionalities and ensure capture of literature and practice-based evidence to develop maintainable technical and methodological foundations (Figure-1). Mevislab software (Ver 2.7.1, MeVis AG- Fraunhofer-MEVIS) has been used for implementation of the MIROR 2 (Figure-2). Quantitative and statistical analysis functionalities embedded in MIROR have been developed using python-(2.7). Functionalities embedded within MIROR include: 1) Measurement of morphologic-properties of the region of Interest (ROI). Zooming, scaling, rotating of the estimated object surface is supported for enhanced assessment quality (Figure 3-a and c). 2) Histogram analysis of the overlaid ROI on voxel-by-voxel parametric maps (produced by or imported to MIROR) such as perfusion or T1 maps (Figure 3-a and c). 3) Comparison of histogram parameters with an evolving archive of relevant data to aid diagnosis. After each analysis, the index case raw data and analysis results are added to the database. Different diagnoses available for comparison are dependent on the data and anatomic region under examination. The similarity between the index-case and different available diagnosis can be examined to inform future investigation (Figure 3-b and d). ROI can be drawn on a higher-resolution image and overplayed on the parametric map of interest. An embedded Mevislab image registration toolbox has been used to ensure alignment of image data and parametric maps. All obtained results and drawn ROI can be exported for further evaluation. Diffusion-weighted MR imaging (DWI) data from paediatric body tumours was used to test MIROR. The tested patient cohort consisted of 48 children with solid tumors aged 0-16 years (37 malignant, 11 benign) whom underwent diagnostic MRI with multi-b-value DWI at Birmingham Children’s Hospital (2012 to 2016) prior to having received treatment. Ethical approval and informed consent was obtained. MR images acquired on a 1.5T Siemens Avanto (Siemens Healthcare, Erlangen, Germany) using an echo-planar imaging (EPI) sequence in an axial acquisition plane with a field of view (FOV) 187 x 250 mm2, matrix size 144 x 192 and slice thickness of 5.0 mm. For each subject 6 b-values (0, 50, 100, 150, 600, 1000 s/mm2) are acquired in three orthogonal directions with TR/TE = 5700/92 ms. Image data was analyzed with MIROR. ROIs were drawn on a B0-image by a clinician and then overplayed on the ADC map. ADC histograms and its mean, median, 2nd to 98th percentile ADC values, skewness, kurtosis, entropy and lesion volume were calculated and stored in MIROR repository.RESULTS:
Figure 3 illustrates the analysis results generated by MIROR for one benign and one malignant tumour case. In general results are available in about 5 seconds. Using MIROR, the various histogram parameters derived, provided additional information for tumour characterization and facilitated the discrimination between benign and malignant tumors. A database of histograms for different diagnoses allowed matching the histogram of an index case to a mean tumor histogram for the tumour types available to guide diagnosis, allow identification of various tumor types and alert to unusual types. A comparison of the histogram metrics from the index case with median, skewness, entropy and 25 percentile values from the tumour types in the database was also made available.CONCLUSION:
MIROR as a diagnostic tool and repository allows the interpretation and analysis of MR Images to be more accessible and comprehensive for clinicians. It aims to increase clinician’s skillset by introducing newer techniques and up-to-date findings to their repertoire and make information from previous cases available to aid decision making. The modular-based format of the tool allows integration of analyses which are not readily available clinically and streamlines future developments. Pipelines for new analysis applications are available –or already in development and will be shortly available – under MIROR platform.Acknowledgements
This study is funded through an NIHR Research Professorship, 13-0053.We acknowledge fundingfrom the CRUK and EPSRC Cancer Imaging Programme at the Children’s Cancer and LeukaemiaGroup (CCLG) in association with the MRC and Department of Health (England) (C7809/A10342).We would like to acknowledge the MR research radiographers at Birmingham Children’s Hospitalfor scanning the patients in this study.References
1. Ida Sim , Paul Gorman, , Robert Greenes, R. Brian Haynes, Bonnie Kaplan, Harold Lehmann, Paul C. Tang, Clinical Decision Support Systems for the Practice of Evidence-based Medicine. Journal of the American Medical Informatics Association, Volume 8 Number 6, Nov/Dec 2001
2. Bitter, R. van Uitert, I. Wolf, L. Iba´nez, and J.M. Kuhnigk. Comparison of Four ˜ Freely Available Frameworks for Image Processing and Visualization That Use ITK. IEEE Transactions on Visualization and Computer Graphics, 13(3):483–493, 2007
Figures