3809
MRIQC: automated assessment and quality reporting of MRI scans1Department of Psychology, Stanford University, Stanford, CA, United States, 2Department of Physical Therapy, University of Florida
Synopsis
Assessing the quality of MRI is necessary and time-consuming. MRIQC automates the quantification extracting a number of image quality measures (IQMs), and eases the individual inspection through specialized visual reports. MRIQC supports T1w, fMRI and dMRI brain images. MRIQC is an easy to use, “plug-and-play” tool, since it is multi-platform (including desktop and high performance clusters), and BIDS- and BIDS-apps compliant. The IQMs extracted automatically will yield unbiased exclusion criteria in MRI analyses.
Introduction
Neuroimaging research is increasingly directed towards acquiring very large and multimodal MR databases, demanding automated quality control (QC) of images1. Current QC protocols require the individual visualization of every image by an expert, a process that is time-consuming and unreliable. In this context, we present MRIQC, a software toolbox that extracts image quality measures (IQMs) from T1-weighted (T1w) and functional MRI (fMRI) images to automatically assess their quality, and generates interactive reports to easily identify low-standard images and artifacts spanning across subjects.Methods
The primary building blocks of MRIQC are 1) a preprocessing workflow; 2) the extraction of a set of IQMs from the minimally preprocessed derivatives of each individual image; 3) a report generation tool.
Anatomical preprocessing workflow - T1w images are corrected for intensity inhomogeneity, skull-stripped, segmented into brain tissues, and normalized to MNI space. Additionally, a mask containing only the air surrounding the head and an artifacts mask are computed.
Functional preprocessing workflow - fMRI images are corrected for head motion, skull-stripped, and normalized to the MNI template. Additionally, a mask for ghosting artifacts and a mask for tissue-less areas surrounding the head are computed.
Image Quality Measures (IQMs) - A battery of quality measures2 is defined for both anatomical and functional images. Some IQMs are general quality estimators (i.e. signal-to-noise ratio), and other are designed to identify specific artifacts.
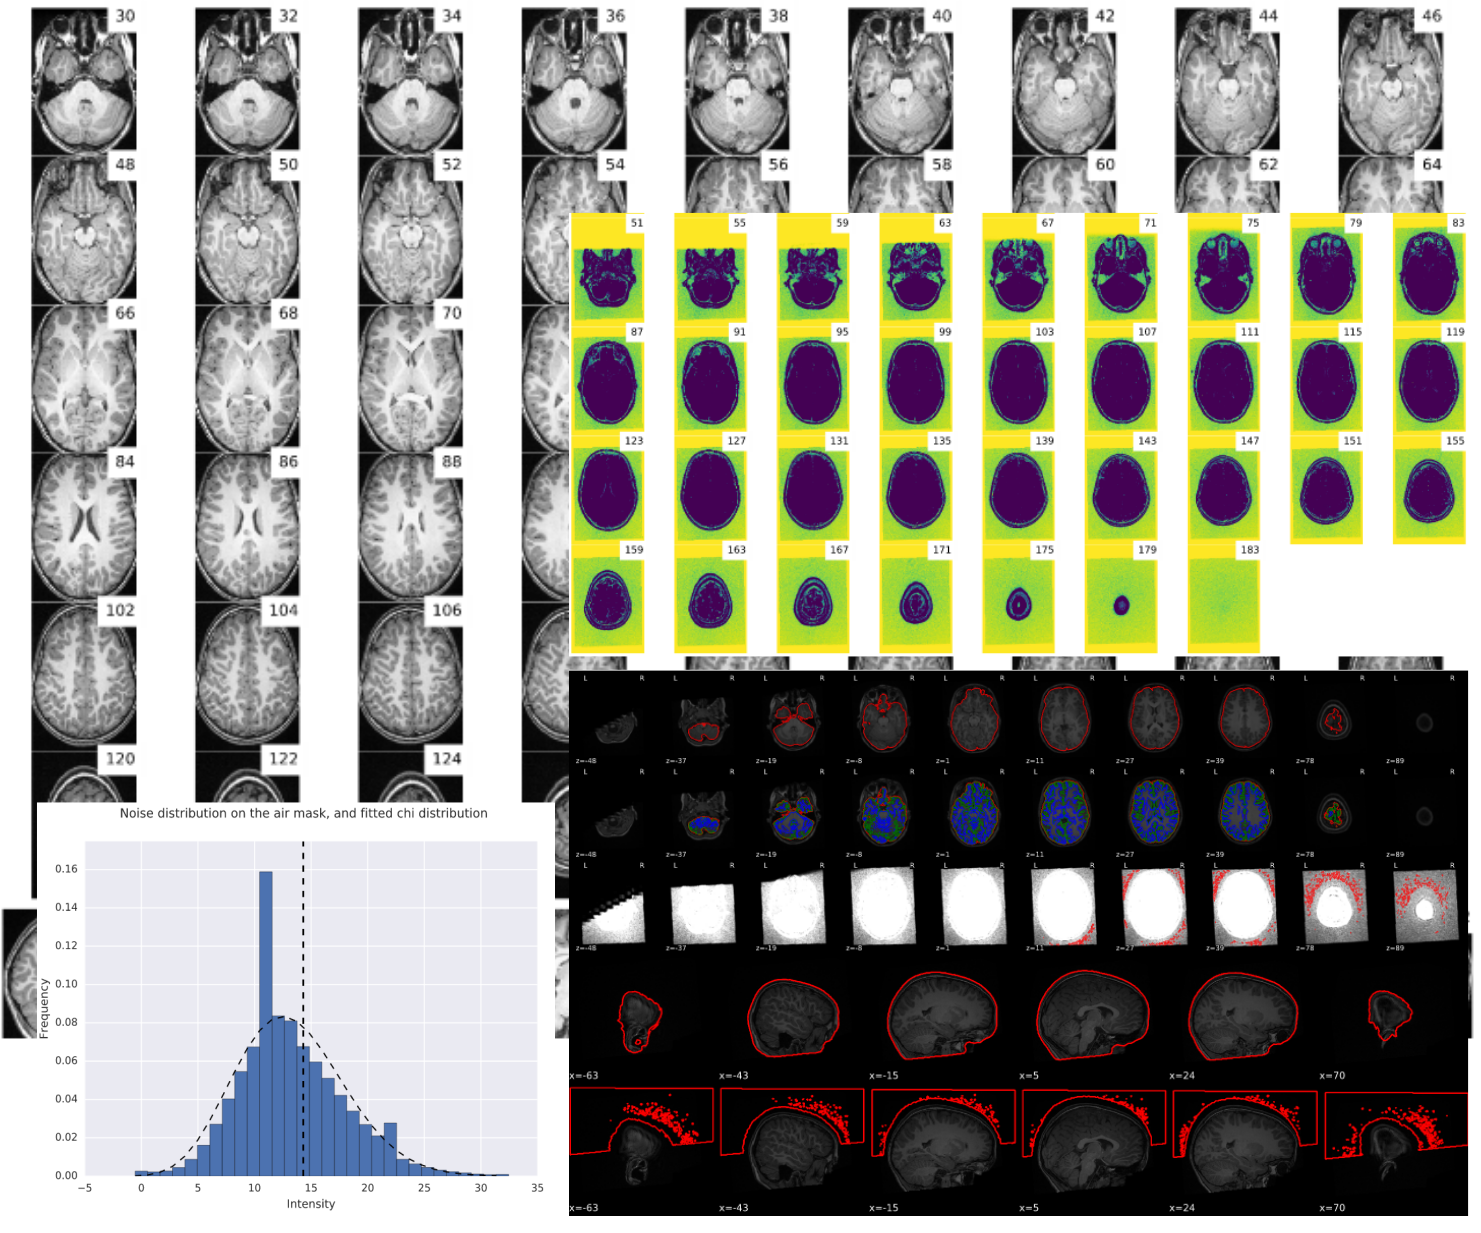
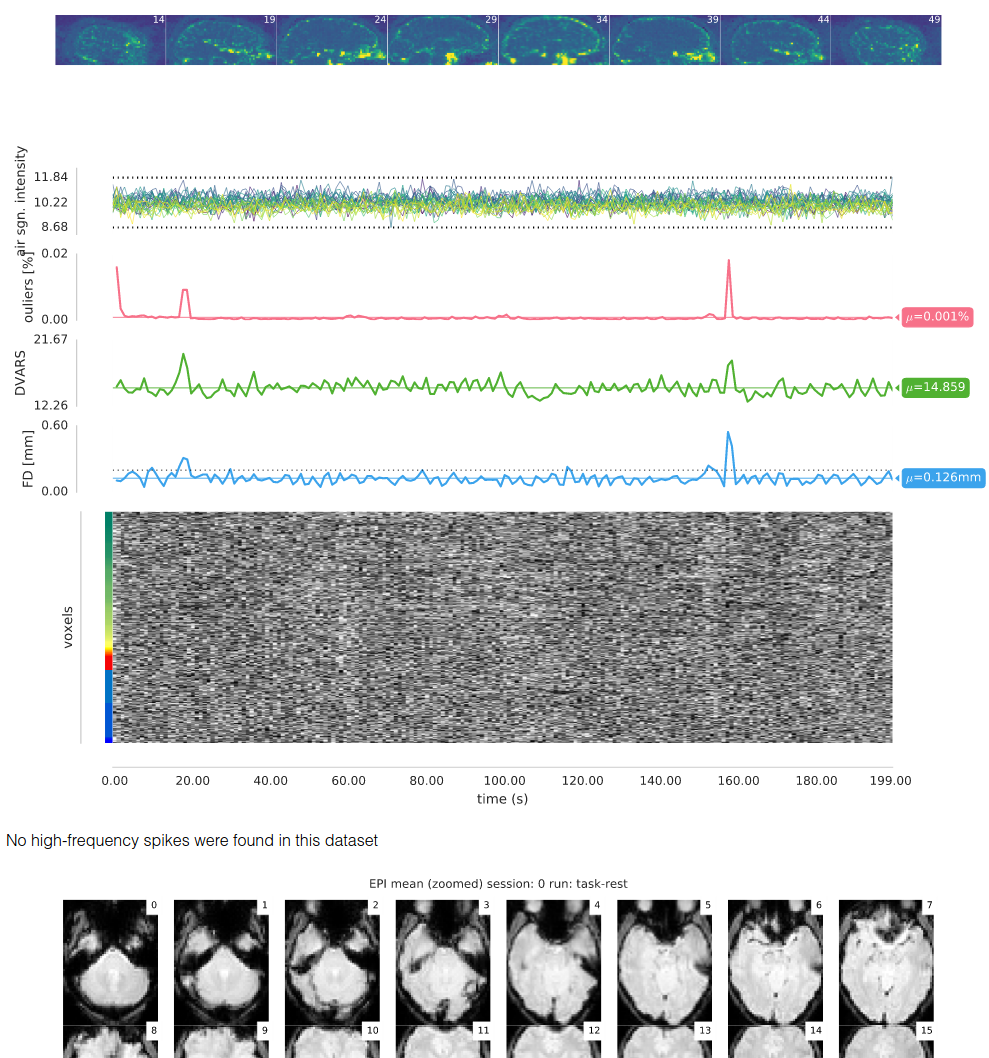
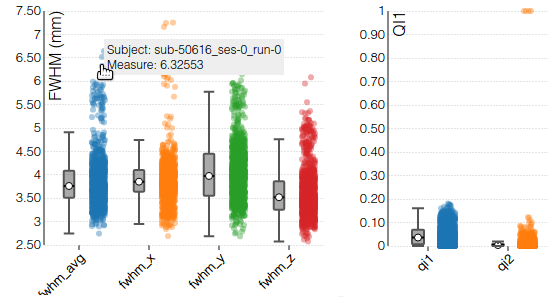
Visual reports - MRIQC generates one individual report per image and a group report per modality (anatomical or functional). The individual report for T1w images (Figure 1) includes several mosaic views of the original scan, the original scan with intensity saturated to enhance artifacts, a zoomed-in version, etc. These plots are useful to check for movement of head and eyeballs, since the signal usually spills over the background on the phase encoding direction. Moreover, ghosts and other artifacts are easier to find in these “background” mosaics. The individual report for fMRI (Figure 2) includes a mosaic view of several volumes of interest like the mean BOLD signal and the standard deviation map. Additionally, a panel combines plots to identify bulk intensity peaks and dropouts, spectral spikes, and confounds like frame-displacement and DVARS with an fMRI “carpetplot”3. Once all the IQMs are computed for every input image, a group report per modality is generated to inform about the whole sample (Figure 3). The user can navigate through the colored distribution plots and click on interesting subjects to visualize their corresponding individual report.
Design and discussion
MRIQC is built on nipype4 with the following principles: 1) the IQMs should be defined on minimally processed derivatives to avoid the blocking of QC by time-consuming processing tasks; 2) the tool is easy to use and HPC (high performance computing) -friendly; 3) the tool must produce insightful reports. Principle 1 is described in the Methods section. To fulfill principle 2, the tool implements the Brain Imaging Data Structure (BIDS5) for the inputs and outputs; and the BIDS-Apps6 standard for the internal design and interfacing with HPCs. The tool is also distributed as a PyPi Python package and as a Docker image, to facilitate its use in desktop settings. Finally, principle 3 is a requirement to encourage MR practitioners to efficiently visualize their data and the preprocessed derivatives. Even though the automated extraction of IQMs is oriented to the quantitative (and blind) assessment of images7, visualization remains a crucial part of the QC process. MRIQC reports are designed to minimize the time it takes to inspect an MR scan, and to understand the reasons why a dataset is flagged by the IQMs. We have processed a large number of anatomical and functional MRI (+1500 images respectively) demonstrating the usefulness of the tool and its robustness to the variabilities of scanning settings and sequence parameters. The development roadmap of MRIQC includes adding diffusion MRI to the modalities supported before ISMRM 2017 is held.Conclusion
We present MRIQC, a quality control tool to assess anatomical, functional and diffusion MRI of the human brain. It is easy to use, publicly available in several channels and supports varying platforms to facilitate their integration in current image analysis workflows. We have integrated MRIQC in our imaging routines, and successfully unveiled subtle structural issues in our scanning facilities and in the image reconstruction process, preventing these problems from spreading over to new acquisitions in the context of ongoing projects. Two examples of QC reports on a large database, containing T1w and fMRI data, are available in http://mriqc.org. The main foundation for MRIQC is the advance towards fully-automated quality control protocols adequate for the current massively-scanning efforts.Acknowledgements
MRIQC was initially started as a fork of the QAP (http://preprocessed-connectomes-project.org/quality-assessment-protocol/). We thank their team, and particularly S. Giavasis and K. Somandepali for their implementation of several IQMs used in MRIQC.
This work is funded by the Laura and John Arnold Foundation.
References
1. Alfaro-Almagro F, et al. UK Biobank. OHBM2016. Geneve, Switzerland; 2016. p1877;
2. http://mriqc.rtfd.io/en/latest/measures.html;
3. Powers et al, NeuroImage, S1053-8119(16)30387-1. doi:10.1016/j.neuroimage.2016.08.009;
4. Gorgolewski KJ, et al. Nipype [Software]. 2016. doi:10.5281/zenodo.50186;
5. Gorgolewski KJ, et al. BIDS. Sci Data. 2016. 3(160044). doi:10.1038/sdata.2016.44;
6. Gorgolewski KJ, et al. BIDS-Apps. BioRxiv. 2016. doi:10.1101/079145;
7. https://osf.io/haf97/;
Figures