3808
ASL-MRICloud: Towards a comprehensive online tool for ASL data analysis1Department of Radiology, Johns Hopkins University School of Medicine, Baltimore, MD, United States, 2Graduate School of Biomedical Sciences, UT Southwestern Medical Center, Dallas, TX, United States, 3AnatomyWorks, LLC, Baltimore, MD, United States, 4Department of Biomedical Imaging and Radiological Science, China Medical University, Taichung City, Taiwan, 5Center for Vital Longevity, School of Behavioral and Brain Sciences, University of Texas at Dallas, Dallas, TX, United States, 6Center for Imaging Science, Johns Hopkins University, Baltimore, MD, United States
Synopsis
ASL has drawn tremendous attention from both research and clinical community during recent years. Therefore, we deployed a cloud-based tool for ASL data analysis on top of MRICloud platform. Different from other downloadable ASL toolboxes, ASL-MRICloud features an automated interface via a web browser for data upload and results download. The computation is performed on the online server. Here we summarized the current functionalities, underlying algorithms, and representative results of ASL-MRICloud.
Introduction
To accommodate a surging interest in ASL in research and clinical community, we lunched a cloud-based tool for ASL data analysis under the infrastructure of MRICloud.org1-3. Compared with other existing ASL toolboxes4-9, which are based on local computing, ASL-MRICloud relies on a web interface for uploading data and downloading results, providing a fully automated interface to end users. The availability of the T1-based brain segmentation tool in MRICloud platform also allows region-specific quantitative reports of ASL-derived parameters. This abstract provides a summary of its current functionalities, main algorithms underlying the pipeline, and representative results.Methods
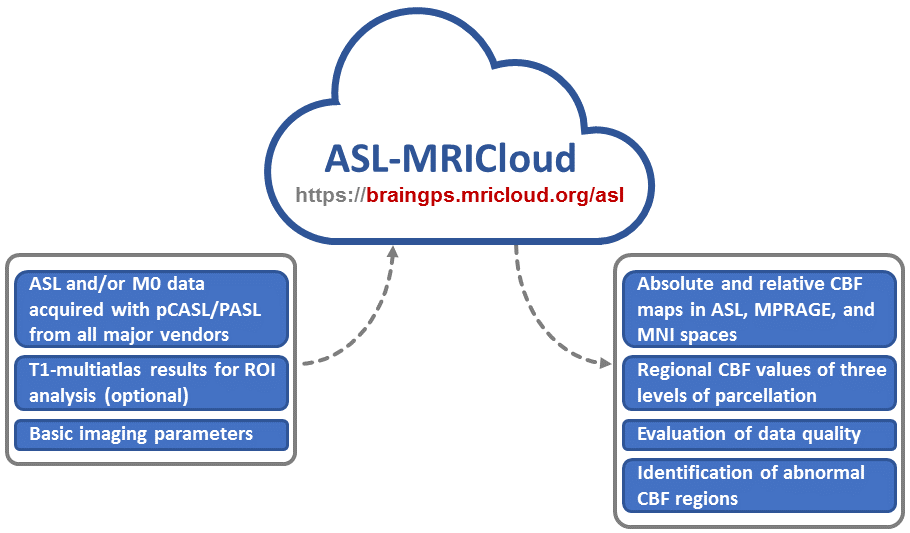
Data upload: Raw ASL data can be uploaded on our website (see Ref. 10 for website address, Fig. 1) using any mainstream browsers (e.g. IE, Chrome, or Safari). At present, ANALYZE files (.hdr and .img) are the accepted format. DICOM and other PHI-containing files must be converted and de-identified due to HIPAA regulations. Our website provides a downloadable software for DICOM-to-ANALYZE conversion, but the user is welcome to use other conversion programs. The software has been tested for GE, Philips, and Siemens ASL datasets.
ASL processing: The ASL-MRICloud accepted Continuous (including pseudo-continuous) and Pulsed ASL datasets. The user is asked to select or type in the following imaging parameters that are relevant for perfusion kinetic modeling: Labeling scheme (continuous or pulsed), Control/label order (control first or label first), Acquisition scheme (2D or 3D), Labeling duration (in ms), Post-labeling delay (single delay value for continuous; TI1 and TI values for pulsed), Background suppression (yes or no, if yes, background suppression pulse timings), blood T1 (default value given), brain-blood-partition coefficient (default value given), labeling efficiency (default value given). Once this information is provided, the user can click the "submit" button and the job will be placed in a processing queue on the cloud server. The images parameters the user selected/typed-in can be saved in a file for future/repeated use. CBF quantification follows models described in the ASL white paper11.
M0 in CBF quantification: There is an optional button to upload an M0 image, which provides a voxel-by-voxel M0 map for CBF quantification. If an M0 image is not uploaded or the dimension of the M0 image does not match that of ASL data, then a global M0 is obtained from averaging all voxels in the ASL image or the M0 image (after correcting for T1 recovery) and used for all voxels in the brain.
Spatial registration/normalization: To allow registration of the CBF image to T1-anatomic image and MNI-space, an optional button is available to upload a composite file that contains both individual-space T1 and MNI-normalized T1 images, which is generated from the T1-based brain segmentation tool in MRICloud platform. ASL images will then be automatically registered to individual T1 and normalized to MNI space.
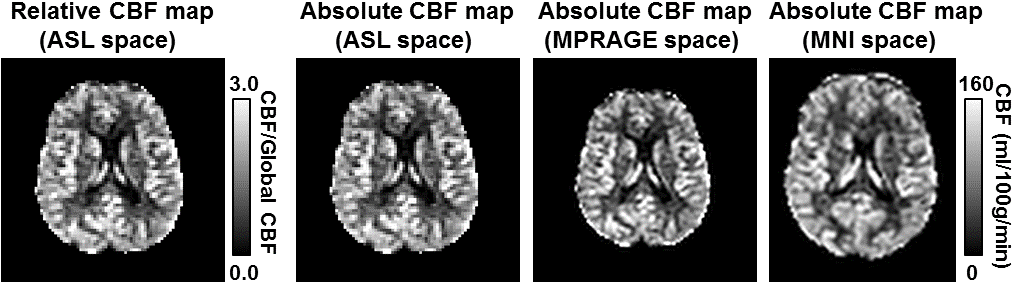
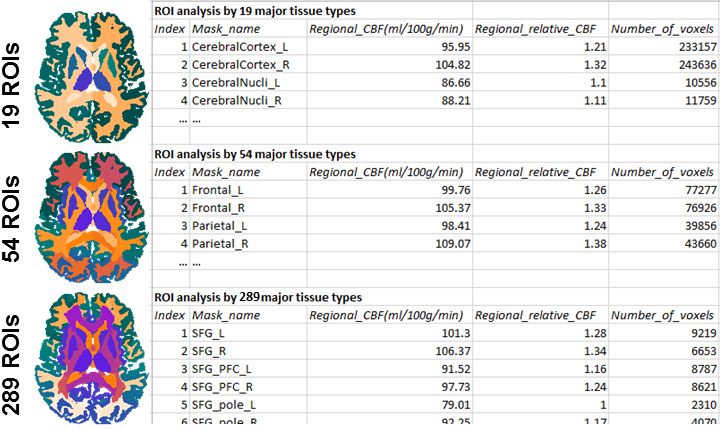
Outcomes include absolute (in ml/100g/min) and relative (with reference to whole-brain CBF) CBF maps in each of the following spaces: individual ASL space, individual T1-MPRAGE space, and MNI space. ROI values (in text file) will also be obtained from T1-multiatlas. Three sets of ROIs values can be obtained depending on how fine one wishes to divide the brain: 19 ROIs, 54 ROIs, and 289 ROIs.
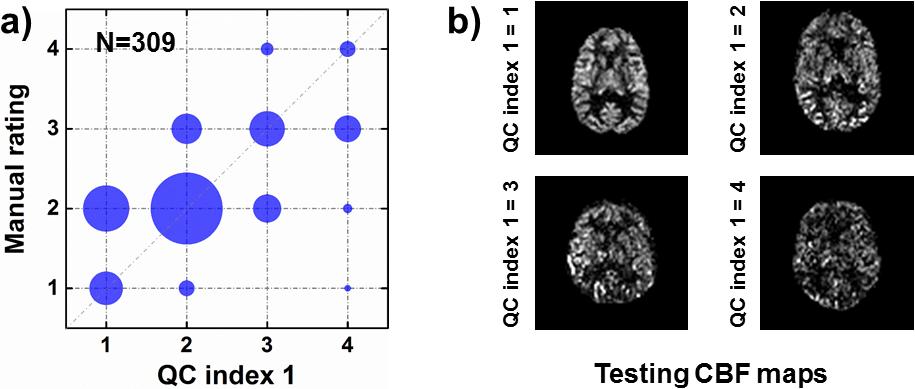
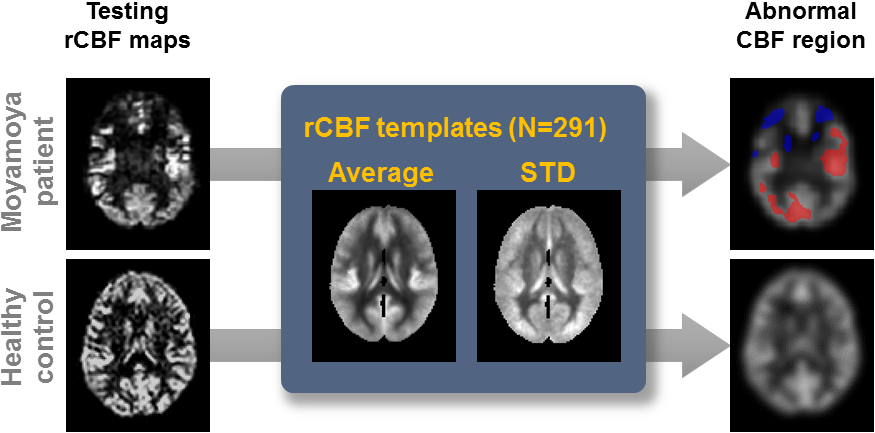
Quality control (QC): Two QC indices are included as part of the dowloadable outcomes. One is a single number indicating the general SNR of the data, from 1 (Excellent) to 4 (Poor), that is based on standard error of the voxel-wise CBF map across measurements. The second index is a voxel-wise mask indicating potential hyperperfusion and hypoperfusion regions. In establishing what is normal and what is hyper(hypo)-perfusion, we used a large CBF database consisting of 309 healthy volunteers ranging from 20-89 years old12. A Z-score was calculated for each voxel (relative to the mean and STD of the 309 values of the same voxel in the database), and a p-threshold of 0.005 was used to delineate voxels with abnormal CBF.
Results
Figure 2 shows voxel-wise CBF maps generated by the ASL-MriCloud. In Figure 3, three levels of parcellation and their corresponding regional CBF values are presented. We validated QC index-1 by comparing it to a manual rating conducted by an experienced ASL researcher (Fig. 4a). A strong correlation (r=0.82) was observed. Figure 4b shows representative image for each of the 4 QC categories. Figure 5 shows an example of abnormality detection in a patient with Moyamoya disease, in whom both hypoperfusion (due to ischemia) and apparent hyperperfusion (due to delayed bolus clearance) are present.Conclusion
ASL-MRICloud may be a useful tool for ASL-MRI data analysis in clinical and research settings.Acknowledgements
AnatomyWorks is supported by NIH R44NS078917.References
1. Liu P, et al. ASL in the MriCloud: a platform-independent, installation-free tool for arterial-spin-labeling analysis. ISMRM 2016; 24:2877.
2. Mori S, et al. MRICloud: Delivering High-Throughput MRI Neuroinformatics as Cloud-Based Software as a Service. IEEE Comp. Sci. & Eng. 2016; 18:21-35.
3. MRICloud website, https://braingps.mricloud.org.
4. Wang Z, et al. Empirical optimization of ASL data analysis using an ASL data processing toolbox: ASLtbx. Magn. Res. Imaging. 2008;26:261-269.
5. Chappell M, et al. Variational Bayesian inference for a non-linear forward model. IEEE Trans. on Signal Proc. 2009;57:223-236.
6. Shirzadi Z, et al. Automated removal of spurious intermediate cerebral blood flow volumes improves image quality among older patients: A clinical arterial spin labeling investigation. J. Mag. Res. Img. 2015;42:1377-85.
7. Abad V, et al. ASAP (Automatic Software for ASL Processing): A toolbox for processing Arterial Spin Labeling images. Magn. Reson. Imaging. 2016;34:334-344.
8. Hernandez-Garcia L, et al. Quantitative Analysis of Arterial Spin Labeling FMRI Data Using a General Linear Model. Magn. Reson. Imaging. 2010;28:919-927.
9. Liang X, et al. Voxel-Wise Functional Connectomics Using Arterial Spin Labeling Functional Magnetic Resonance Imaging: The Role of Denoising. Brain Connect. 2015;5:543-53.
10. ASL-MRICloud website, https://braingps.mricloud.org/asl.
11. Alsop D, et al. Recommended Implementation of Arterial Spin-Labeled Perfusion MRI for Clinical Applications: A Consensus ofthe ISMRM Perfusion Study Group and the European Consortium for ASL in Dementia. Magn. Reson. Med. 2015;73:102-116.
12. Lu H, et al. Alterations in cerebral metabolic rate and blood supply across the adult lifespan. Cereb. Cortex. 2011;21:1426-1434.
Figures