3804
Tagging distance dependent Z-spectrum (TADDZ) for ASL MRI free from B0-inhomogeneity induced errors1Radiology, University of Illinois at Chicago, Chicago, IL, United States, 2Center for Magnetic Resonance Research 3T Program, University of Illinois at Chicago, Chicago, IL, United States, 3Research Resources Center, University of Illinois at Chicago, Chicago, IL, United States, 4Anatomy and Cell Biology, Chicago, IL, United States
Synopsis
Arterial spin labeling (ASL) MRI, based on endogenous contrast from blood water, is used for research and diagnosis of cerebral vascular conditions. However, artifacts due to imperfect imaging conditions such as B0 inhomogeneity could lead to variations in the quantification of cerebral blood flow (CBF). In this study, we investigated the CBF variation artifacts due to B0‑inhomogeneity using Signal Targeting with Alternating Radio frequency (STAR) based ASL. We developed a novel technique, TADDZ, similarly to the corrections for chemical exchange saturation transfer (CEST) experiments, to remove the B0 inhomogeneity induced CBF artifacts.
Purpose
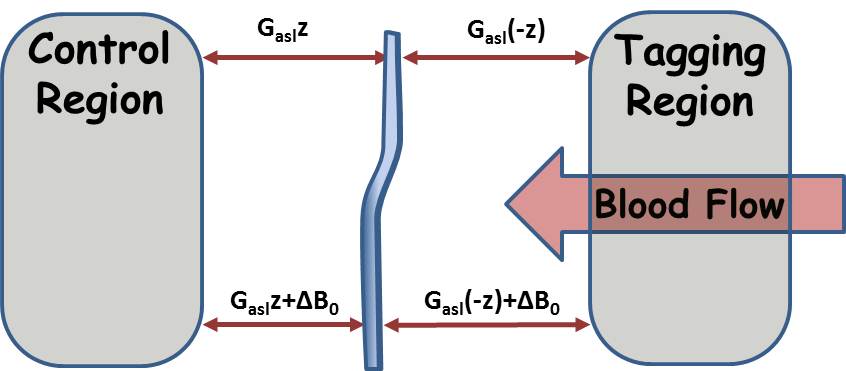
Noninvasive perfusion imaging is crucial to research and diagnosis of cerebral vascular conditions. Arterial spin labeling (ASL) MRI, based on endogenous contrast from blood water, fits this need. However, artifacts due to imperfect imaging conditions such as B0-inhomogeneity could lead to variations in the quantification of cerebral blood flow (CBF) and therefor clinical misdiagnosis. ASL contrast is derived primarily from the signal reduction due to the inversion or saturation of arterial blood water at a proximally located tagging slice. Concomitantly, the tagging RF pulse also creates MT effects within the imaged slice. Conventionally, a control image with distally located tagging is utilized to create counter balanced MT effect, (Figure 1). However, the balance of MT effects from the control and tag images assumes there is no B0‑inhomogeneity in the imaging plane. In reality, B0‑inhomogeneity up to 0.5 or 1 ppm is typically observed in pre-clinical and clinical MRI.
In this study, we investigated the CBF variation due to B0‑inhomogeneity using Signal Targeting with Alternating Radio frequency (STAR) based ASL1 as an example. We developed a novel technique, TADDZ, similarly to the corrections for chemical exchange saturation transfer (CEST) experiments2, to remove the B0-inhomogeneity induced CBF artifacts.
Sporadic Alzheimer’s disease (AD) accounts for more than 95% of all cases and APOE4 is the greatest genetic risk factor, increasing risk up to 15-fold compared to APOE33-5 and affecting the age of AD onset6-7. CBF changes may serve as an imaging biomarker for metabolic changes due to APOE4. The proposed ASL B0-correction technique was applied to study CBF differences in mice with AD that express APOE3 or APOE4 genotype.
Methods
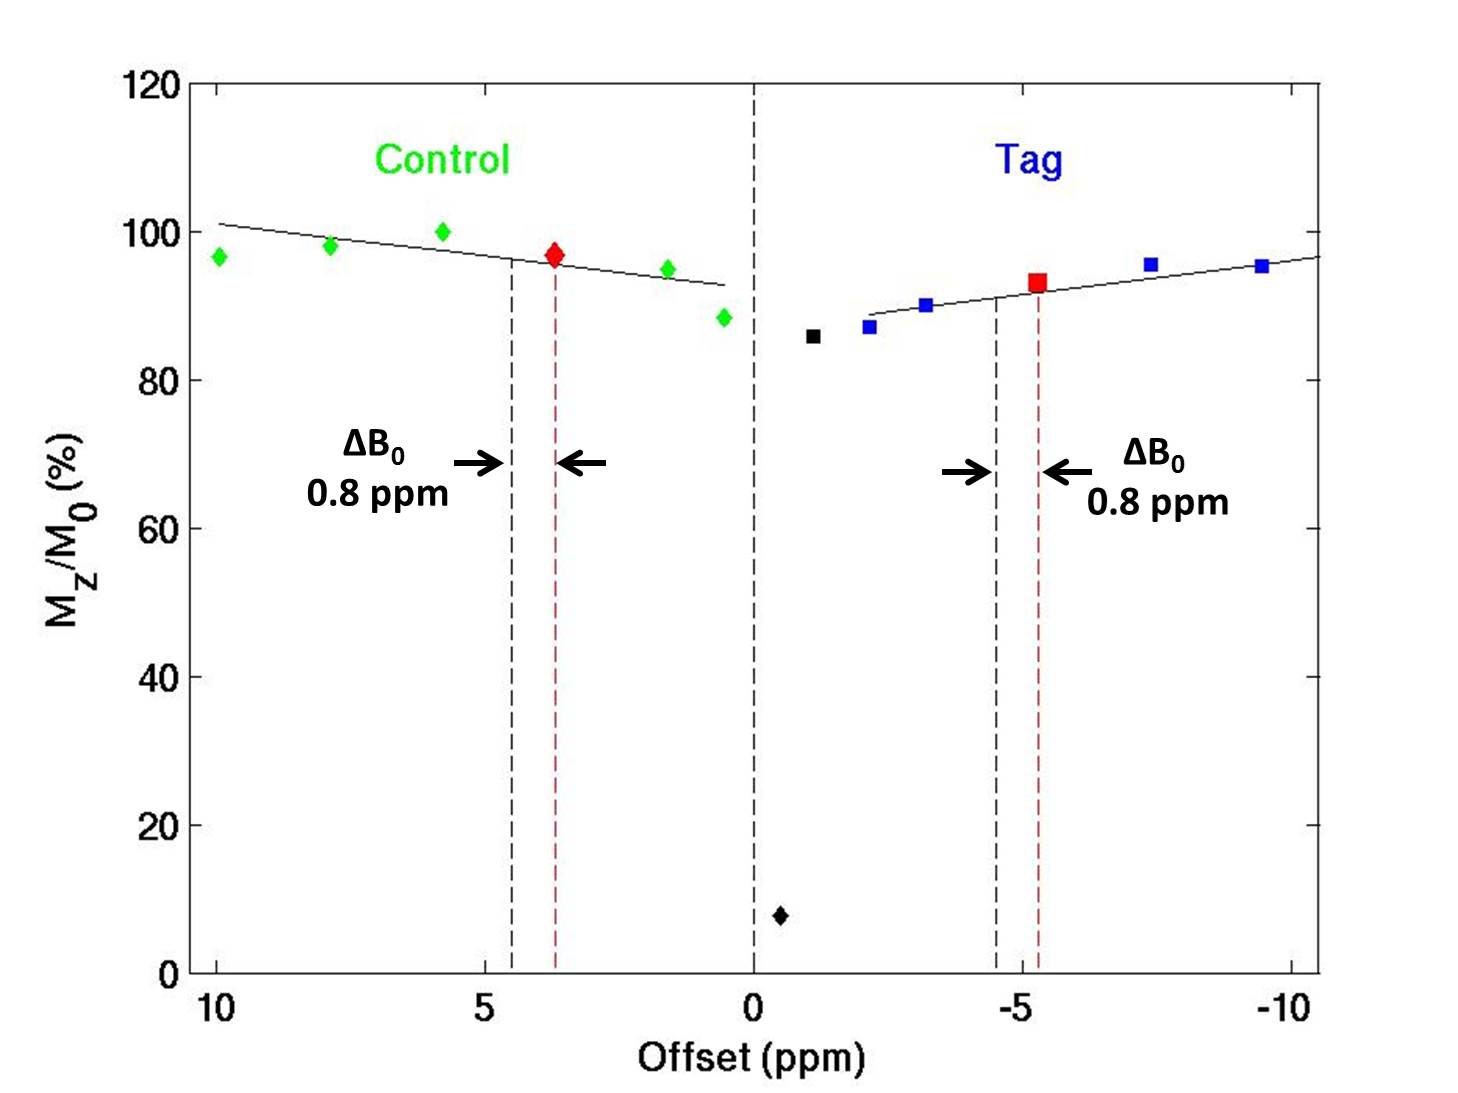
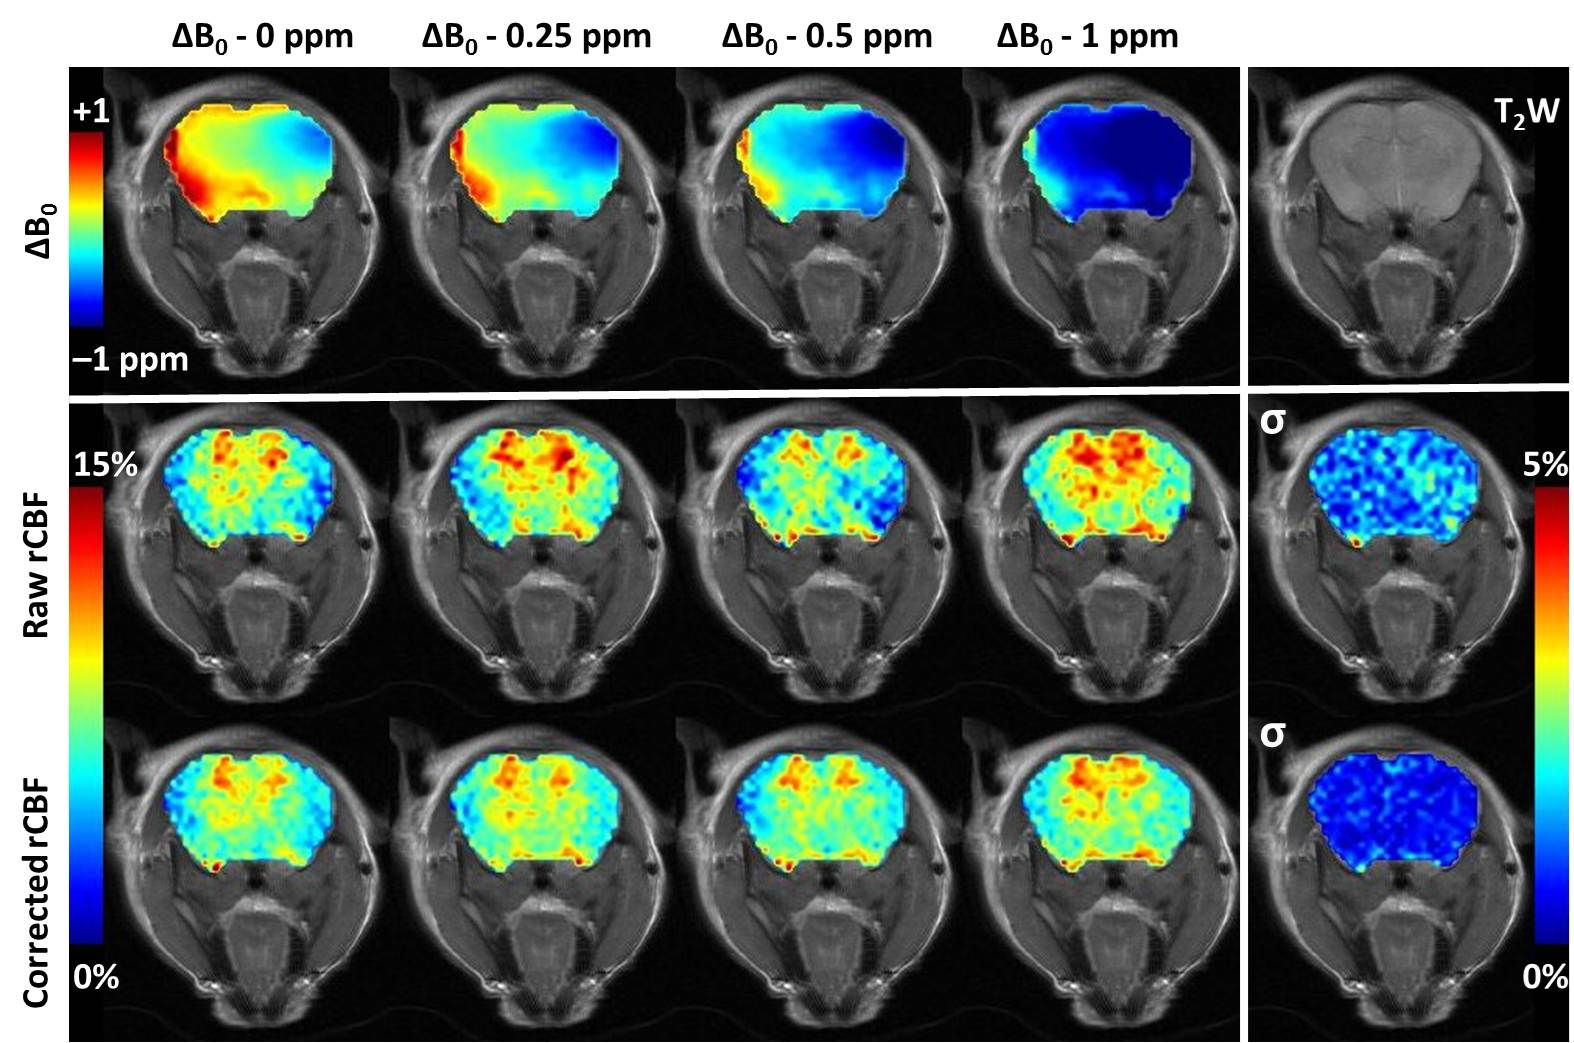
A series of spin echo STAR datasets were acquired on a 9.4T small-animal scanner (TR/TE 2000/9.6 ms, post labeling delay 500 ms, FOV 25x25 mm2, slice thickness 1.5 mm, Matrix 64x64, Gasl = 0.4 G/cm, NEX 1) with tagging gap values of 0, 2.5, 5, 10, 15, 20, and 25 mm, corresponding to off-resonances of 0.3, 1.4, 2.4, 4.5, 6.6, 8.7, and 10.7 ppm to generate a TADDZ spectrum. Field inhomogeneity or ΔB0 map was determined using water saturation shift referencing (WASSR) images collected with a 100 ms saturation pulse of 0.47 µT2. Total acquisition time is about 10 min. The ΔB0 correction was performed on a voxel-by-voxel basis by treating the acquired TADZZ data as Z‑spectra (Figure 2) that had been shifted according to ΔB0. The correction effectively unshifts by ΔB0, i.e., interpolates based on a Thiel-Sen linear regression9 in the range 2 to 11 ppm, back to the intended tag gap of 10 mm (4.5 ppm). The relative CBF (rCBF), 100% * (control-tag)/control, were computed before and after B0 correction. To validate the correction method under a semi controlled ΔB0 condition, TADDZ datasets were acquired while manually shifting B0 by 0.25, 0.5 and 1 ppm. In addition, TADDZ data were collected from male APOE3 (n=5) and APOE4 (n=7) AD mice and uncorrected and corrected rCBF values were compared to reveal APOE phenotype induced CBF changes in brain.Results
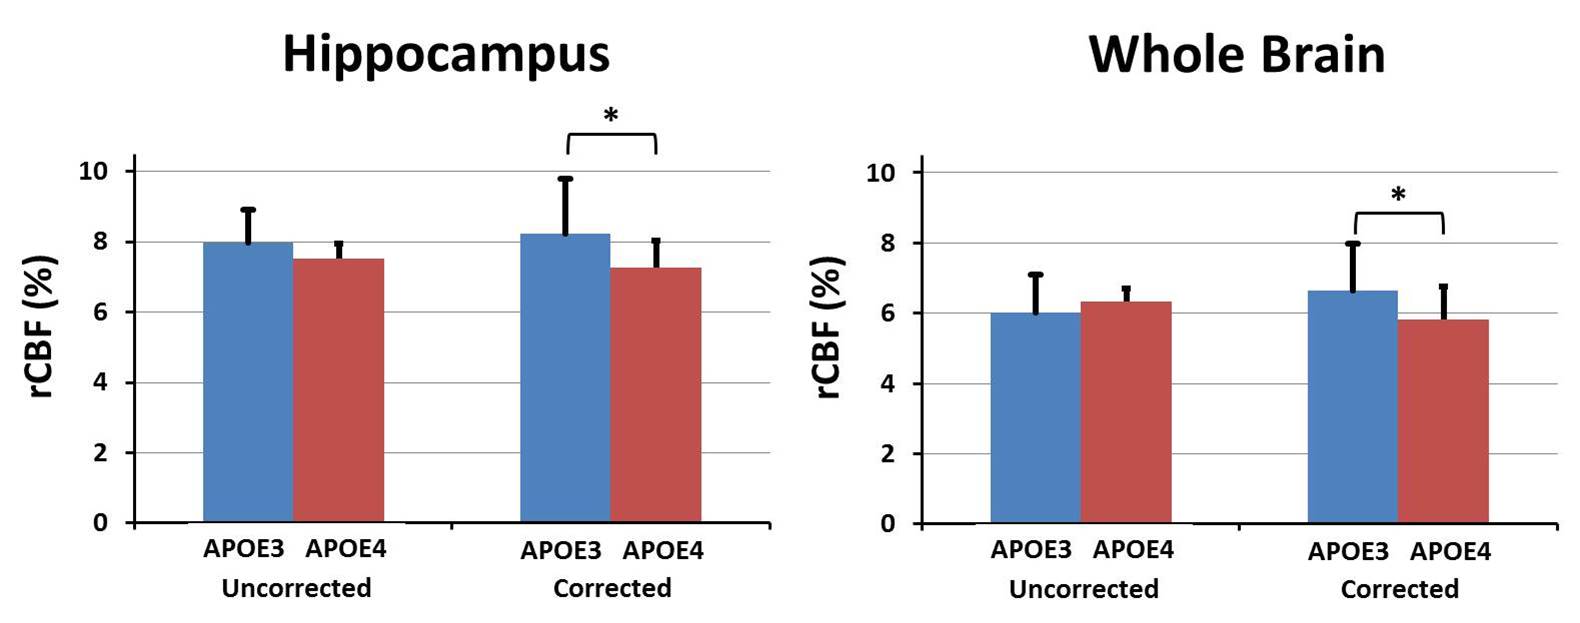
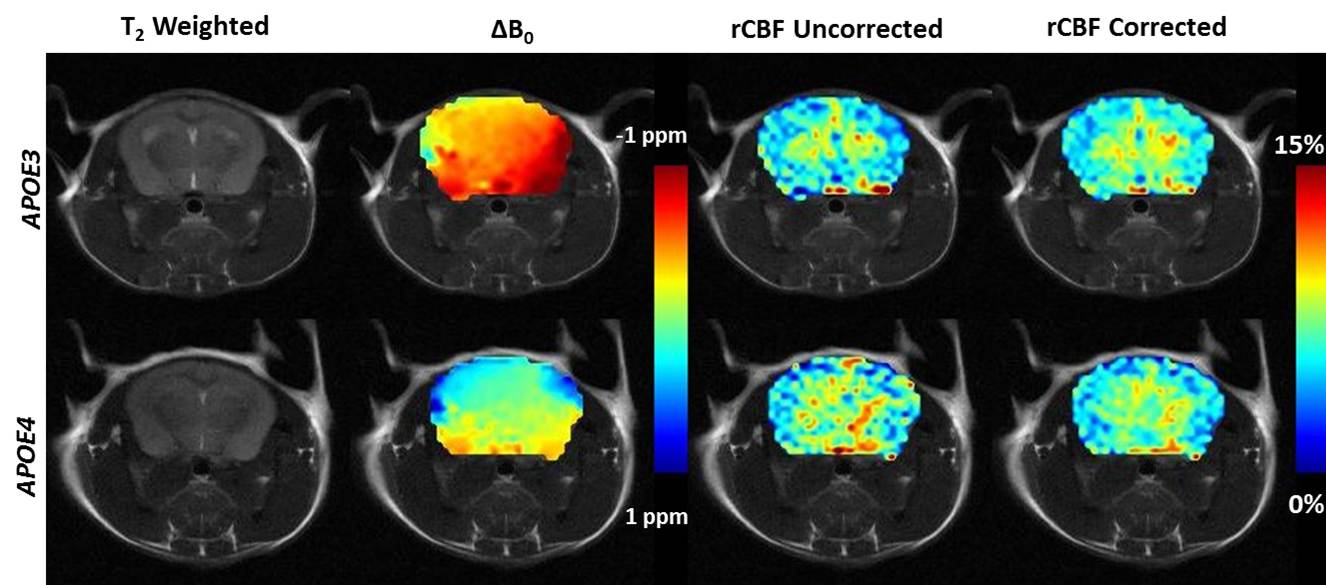
Whereas the uncorrected rCBF maps exhibited noticeable variations due to systematic variation of ΔB0 (Figure 3), the ΔB0 correction greatly reduced such variation by 3 times. The uncorrected rCBF was not significantly different between the APOE3 vs APOE4 within the hippocampus (8.0±0.9% vs 7.5±1.6%, p=0.31) and whole brain (6.0±1.0% vs 6.3±1.3%, p=0.35). However, after the correction with TADDZ technique, the rCBF was significantly higher in the APOE3 vs APOE4 within the hippocampus (8.2±0.4% vs 7.2±0.8%, p<0.05) and whole brain (6.7±0.4% vs 5.8±0.9%, p<0.05), (Figure 4), consistent with literature8. Representative rCBF maps before and after B0-correction are shown in Figure 5.Discussion and Conculsion
Literature search shows that Pekar, et.al.10 had previously addressed the intrinsic asymmetric MT effects in ASL imaging, although, asymmetric MT effects due to imaging-plane B0‑inhomogeneity was not addressed. In another related study, Janahian, et.al.,11 investigated the tagging region’s B0‑inhomogeneity effect on tagging efficiency. In contrast, for the first time, our study here emphasizes the correction of asymmetric MT effects due to imaging-plane B0‑inhomogeneity.
Our results indicate that imaging-plane B0‑inhomogeneity can lead to great variations in CBF maps. We also demonstrated the effective use of TADDZ to reduce test-retest variation due to systematic changes in ΔB0. Application to the rCBF APOE3 vs APOE4 datasets reduced the group-wise standard deviation and improved the statistical power to differentiate APOE phenotype dependent brain perfusion.
TADDZ MRI, by removing the artifacts due to static field inhomogeneity, will enhance the robustness of ASL imaging quantification of CBF, improve statistical power, and eventually reduce clinical misdiagnosis.
Acknowledgements
No acknowledgement found.References
1. Edelman RR, Siewert B, Darby DG, Thangaraj V, Nobre a C, Mesulam MM, et al. Qualitative mapping of cerebral blood flow and functional localization with echo-planar MR imaging and signal targeting with alternating radio frequency. Radiology. 1994;192(2):513–20.
2. Kim M, Gillen J, Landman BA, Zhou J, Van Zijl PCM. Water saturation shift referencing (WASSR) for chemical exchange saturation transfer (CEST) experiments. Magn Reson Med. 2009;61(6):1441–50.
3. Reitz C, Mayeux R. Use of genetic variation as biomarkers for mild cognitive impairment and progression of mild cognitive impairment to dementia. Journal of Alzheimer's disease : JAD. 2010;19(1):229-51.
4. Leoni V. The effect of apolipoprotein E (ApoE) genotype on biomarkers of amyloidogenesis, tau pathology and neurodegeneration in Alzheimer's disease. Clin Chem Lab Med. 2011;49(3):375-83.
5. Thal DR, Papassotiropoulos A, Saido TC, Griffin WS, Mrak RE, Kolsch H, Del Tredici K, Attems J, Ghebremedhin E. Capillary cerebral amyloid angiopathy identifies a distinct APOE epsilon4-associated subtype of sporadic Alzheimer's disease. Acta neuropathologica. 2010;120(2):169-83.
6. Corder EH, Saunders AM, Strittmatter WJ, Schmechel DE, Gaskell PC, Small GW, Roses AD, Haines JL, Pericak-Vance MA. Gene dose of apolipoprotein E type 4 allele and the risk of Alzheimer's disease in late onset families. Science. 1993;261(5123):921-3.
7. Ghebremedhin E, Schultz C, Thal DR, Rub U, Ohm TG, Braak E, Braak H. Gender and age modify the association between APOE and AD-related neuropathology. Neurology. 2001;56(12):1696-701.
8. Tai LM, Thomas R, Marottoli FM, Koster KP, Kanekiyo T, Morris AWJ, et al. The role of APOE in cerebrovascular dysfunction. Acta Neuropathol [Internet]. Springer Berlin Heidelberg; 2016;131(5):709–23.
9. Sen PK. Estimates of the regression coefficient based on Kendall’s Tau. J Am Stat Assoc [Internet]. 1968;63(324):1379–89.
10. Pekar J, Jezzard P, Roberts DA, Leigh JS, Frank JA, McLaughlin AG. Perfusion imaging with compensation for asymmetric magnetization transfer effects. Magn Reson Med. 1996;35(1):70–9.
11. Jahanian H, Noll DC, Hernandez-Garcia L. B 0 field inhomogeneity considerations in pseudo-continuous arterial spin labeling (pCASL): Effects on tagging efficiency and correction strategy. NMR Biomed. 2011;24(10):1202–9.
Figures