3803
Estimation of arterial blood T1 during hyperoxic gas-mixture breathing1Department of Radiology, University of Pennsylvania, Philadelphia, PA, United States
Synopsis
Hyperoxia gas mixture breathing causes additional oxygen to be dissolved in blood plasma thereby shortening the T1 of arterial blood (T1a). Here, we propose a method estimate T1a during hyperoxia gas breathing by solving a perfusion quantification model for T1a given CBF measured during hyperoxia via phase contrast (PC) of the feeding arteries in the neck. The ratio between PC-based total CBF and ASL-based regional CBF was first determined at baseline, and then applied to normalize the expected ASL-based CBF during hyperoxia. T1a was estimated as 1.46±0.09 s during hyperoxia gas mixture breathing, in reasonable agreement with previous reports.
Background & Motivation
Hyperoxia gas mixture breathing, defined as fractional oxygen in inspired air (FiO2) > 21%, is an isometabolic stimulus that increases the oxygen carrying capacity of blood through additional oxygen dissolved in blood plasma. Oxygen itself is paramagnetic; therefore the increased presence of dissolved oxygen shortens the longitudinal relaxation time (T1) of blood1 which will impact the accuracy of perfusion quantification based on arterial spin labeling (ASL) because models rely on blood T1. For example cerebral blood flow (CBF) can be calculated as2:
$$$CBF=\frac{\Delta M}{M_0}\frac{\lambda}{2\alpha}\frac{\frac{1}{T_{1a}}}{exp\left(\frac{-w}{T_{1a}}\right)-exp\left(\frac{-\left(w+\tau\right)}{T_{1a}}\right)}$$$ [1]
where ΔM is the tag-control difference, M0 the equilibrium magnetization, λ the blood-tissue partition coefficient, α the labeling efficiency, w the duration of the post-labeling delay, τ the labeling duration, and T1a the transverse relaxation time of arterial blood. Previous studies have investigated the dependence of T1a on FiO2 3. However, use of the previously measured T1a values requires precise knowledge of FiO2, and thus precise control of the gas delivered to the subject, potentially impeding the use of hyperoxia as a stimulus. If T1a could be estimated without prior knowledge of FiO2, hyperoxia challenges could be performed more easily, without the need for expensive and uncomfortable equipment (e.g. hyperoxic gas could be delivered through nasal cannula). Here, we present a method to estimate T1 of arterial blood based on simultaneous measurement of total CBF from phase contrast (PC) data acquired in feeding arteries (CBFFLOW) and as the average of ASL-derived perfusion (CBFPERF) in grey matter. Assuming CBFFLOW and CBFPERF changes due to hyperoxia are the same, measured CBFFLOW during hyperoxia can be used to estimate CBFPERF, and [Eq 1] can be solved for T1a.
Methods
ASL and PC were measured using an interleaved background-suppressed 3D-GRASE-based pCASL4 and PC sequence at 3T. Data were acquired in five subjects throughout 5 minutes of baseline and 5 minutes of hyperoxia gas mixture breathing (FiO2 = 100%). At baseline, CBFPERF was computed in grey matter from the mean of perfusion weighted images acquired during the resting periods from [Eq 1] with τ=1.52 s, w=1.5 s, α=0.71 4, and T1a during normoxia of 1.65 s5. CBFFLOW was also computed at baseline as the integral of velocity over the cross-sectional area of the four feeding arteries: right and left internal carotid and vertebral arteries divided by brain mass estimated from a T1-weighted MPRAGE acquisition. The ratio between global CBF measured by CBFFLOW and regional CBF measured by CBFPERF was determined at baseline. That ratio was applied to CBFFLOW measurements during hyperoxia to estimate the expected CBFPERF and subsequently the T1a that yielded the expected CBFPERF was calculated (see Figure 1 for details).Results
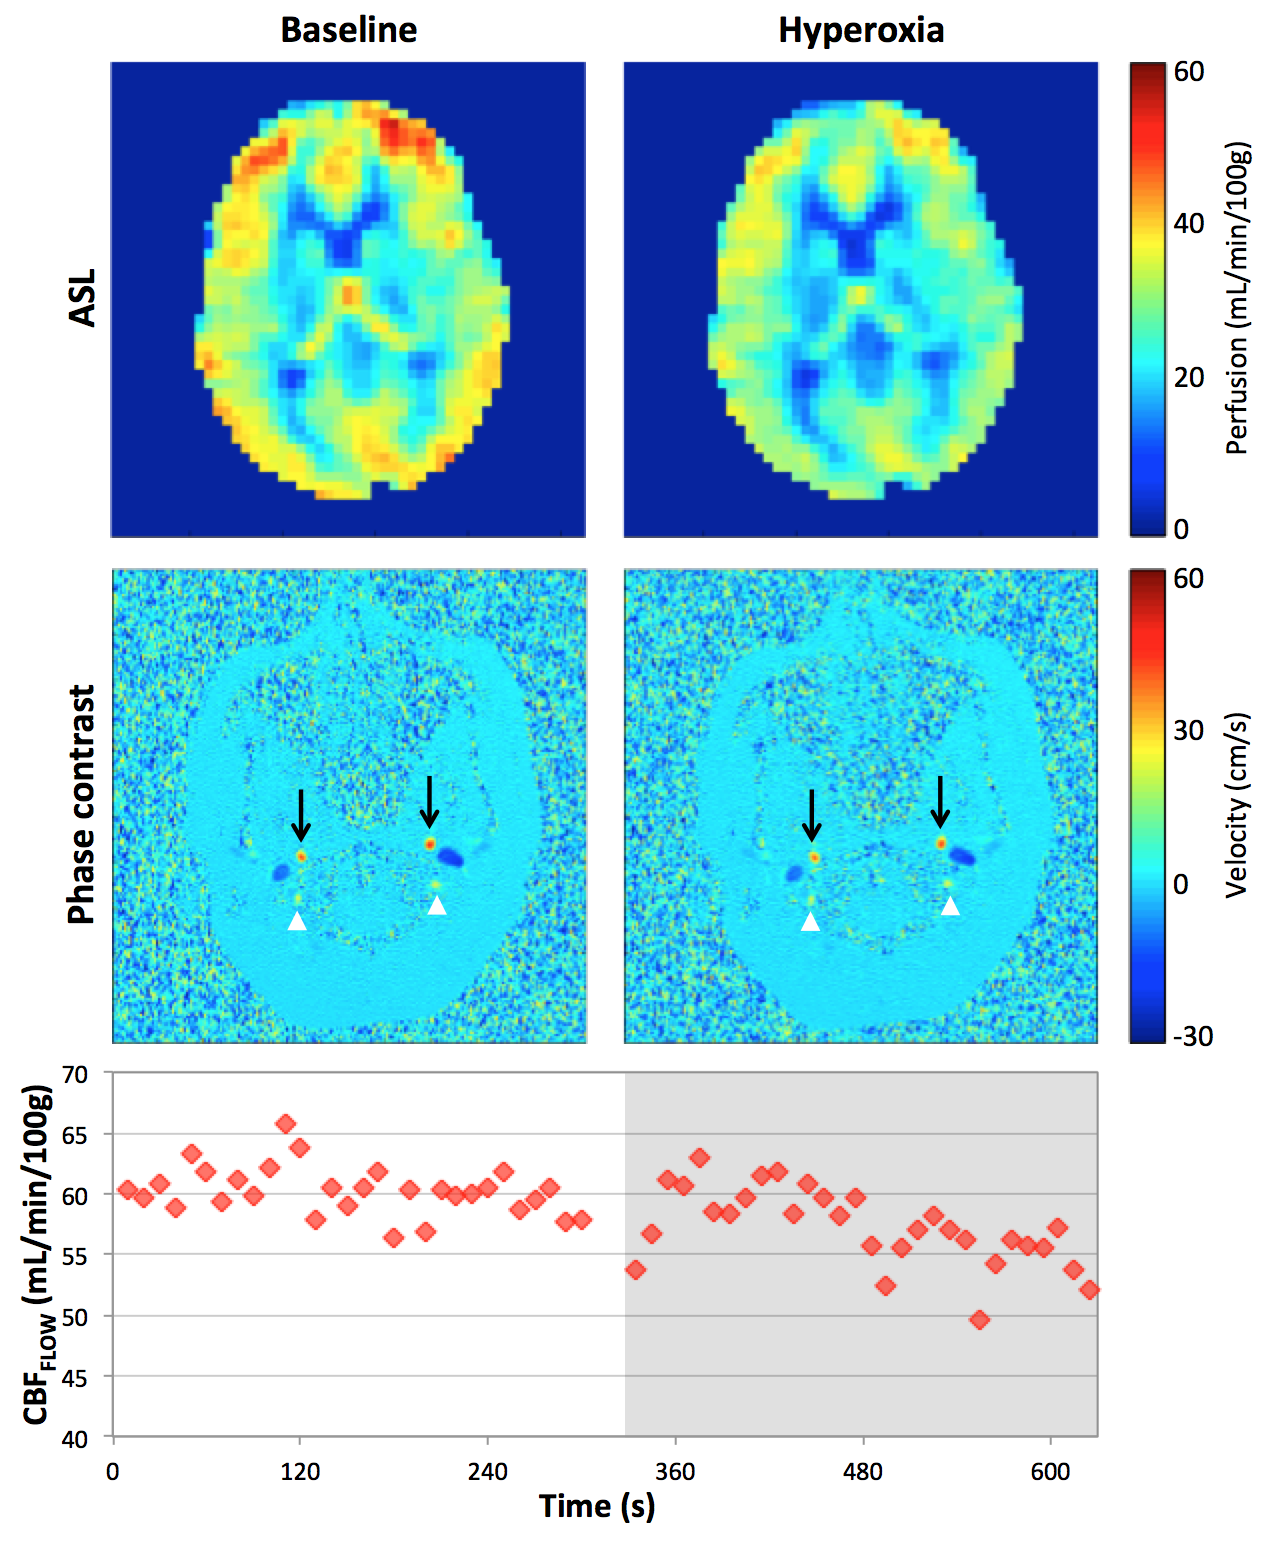
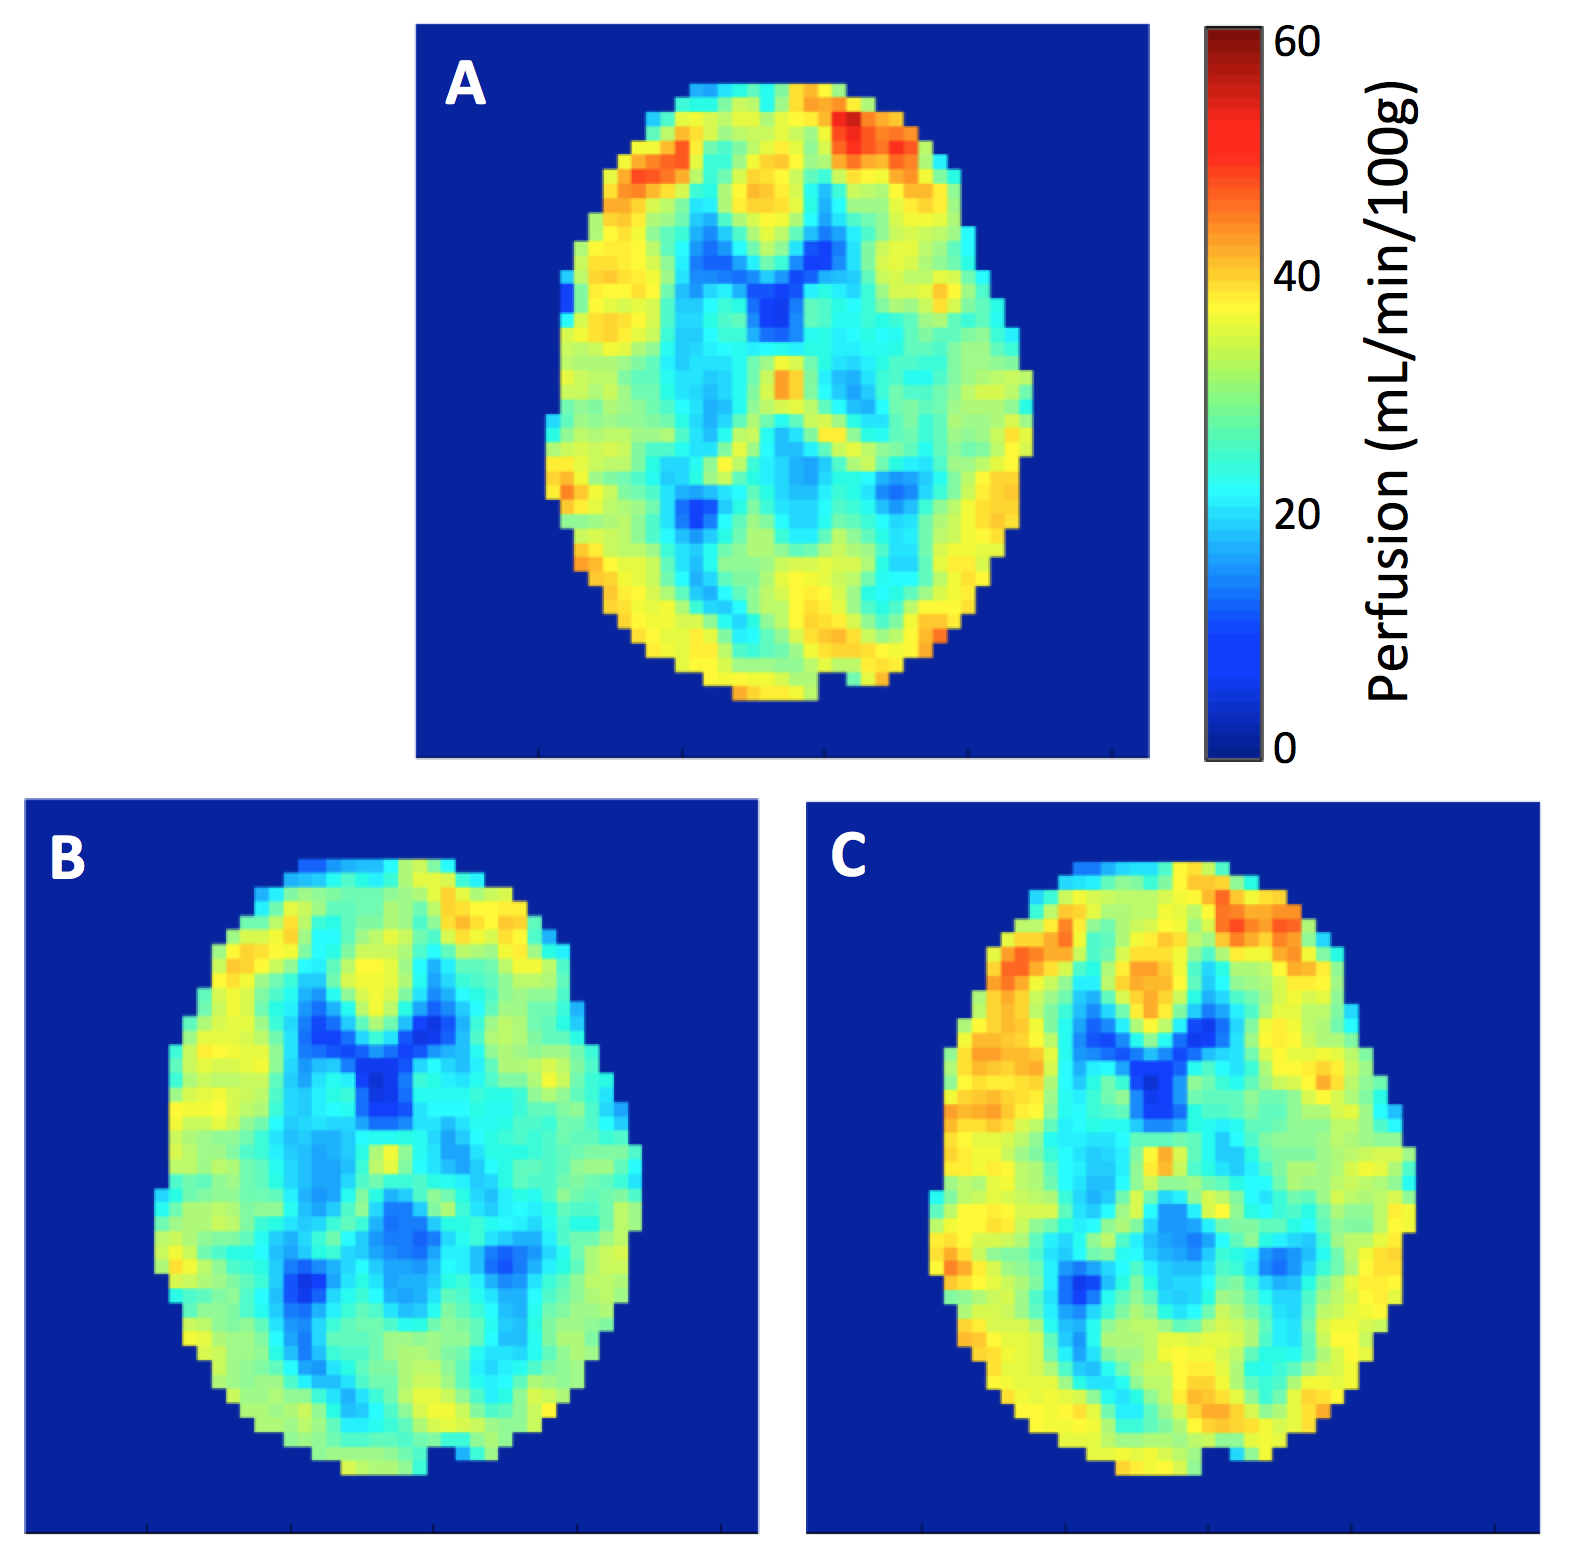
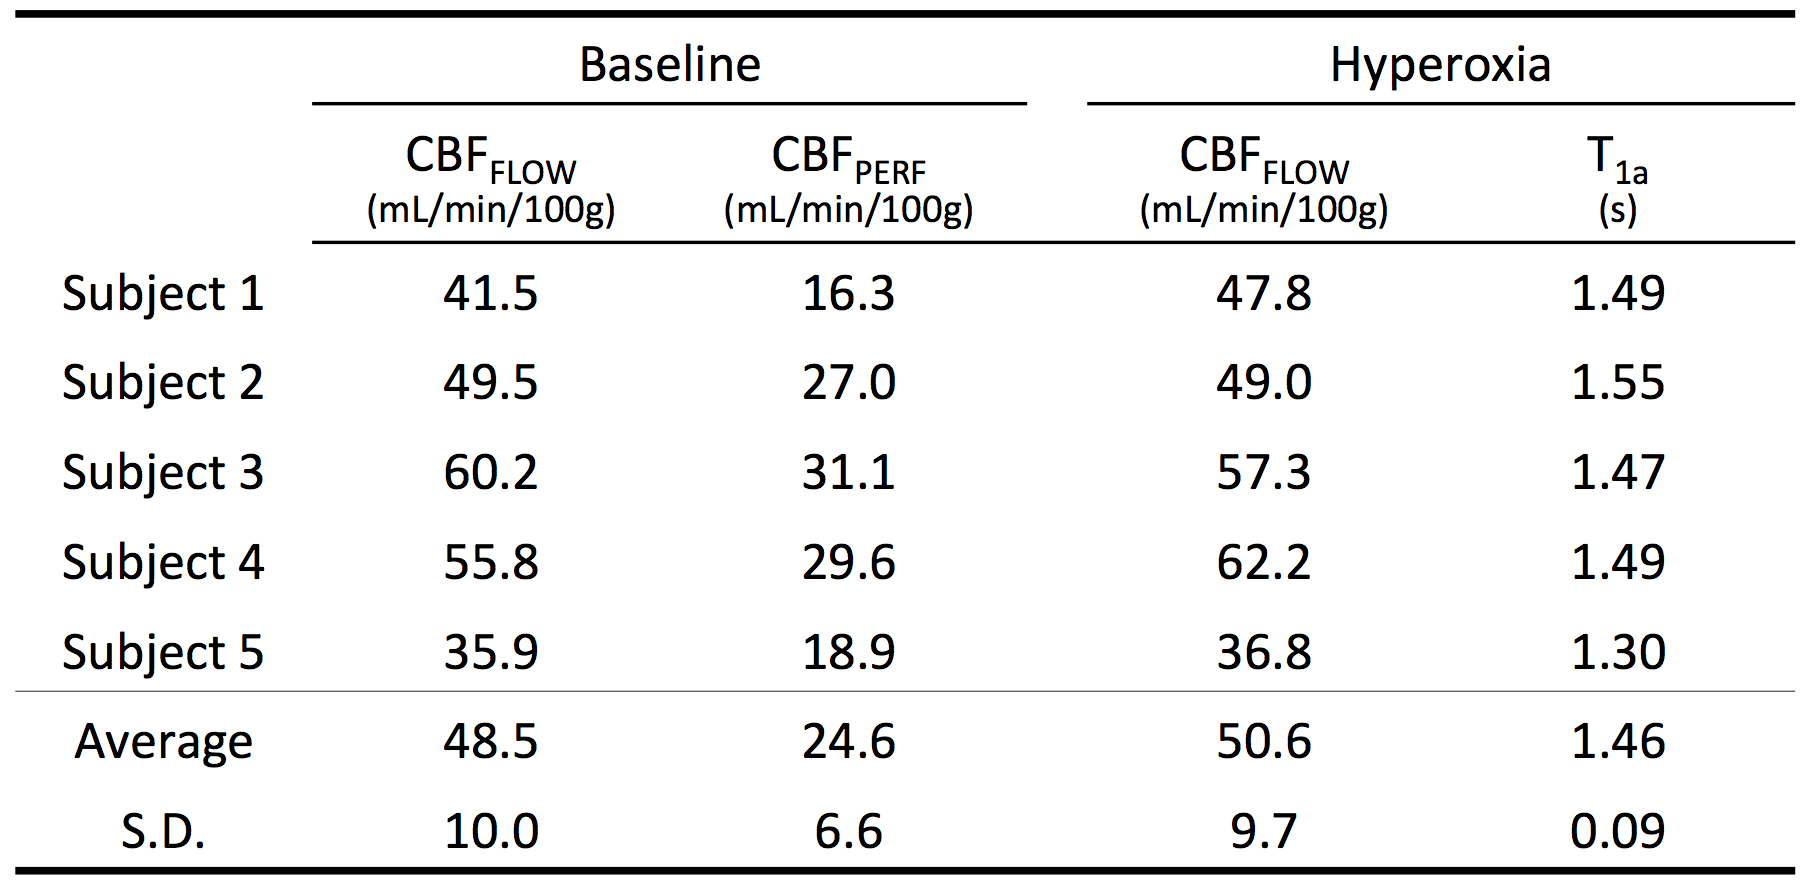
Figure 2 shows the average CBFFLOW and CBFPERF responses at baseline and hyperoxia. Here, CBFPERF was calculated using T1a=1.65 s for both baseline and hyperoxia states. In this subject, there is a slight reduction in CBFFLOW during hyperoxia (this was not observed for all subjects) however the amount that CBF is reduced is overestimated from the ASL data relative to the PC data (CBFFLOW = 5% reduction, CBFPERF = 19% reduction). Averaged over the five subjects, T1a was estimated as 1.46±0.09 s during 100% FiO2. Figure 3 shows the corrected perfusion map based on the estimated T1a. Table 1 shows results for measured CBFPERF and CBFFLOW at baseline and hyperoxia, as well as the estimated T1a during hyperoxia.Discussion & Conclusion
The approach used here is similar to that of Aslan, et al’s study6 to determine ASL labeling efficiency.
The estimated T1 values are in reasonable agreement with those in a recent study by Siero, et al7 that estimated T1 during hyperoxia based on flow changes during a hypercapnia stimulus and hypercapnic-hyperoxic stimulus, positing that the flow changes should be equivalent (driven by CO2). Those authors found T1a=1.49±0.9 s. Both Siero, et al’s results7 and those presented herein are higher than a previously cited value of 1.38 s3.
Although a slight reduction of blood flow is expected during hyperoxia3, this response was not observed in every subject, potentially due to changes in respiratory rate. However, regardless of the underlying physiologic response there will still be an increase in dissolved oxygen, shortening T1a, and causing perfusion to be underestimated using T1a of blood at baseline, as is seen in these results.
Ongoing studies are investigating the estimates of T1a at various FiO2 and will attempt to compare results to measured T1a values. Estimation of T1a during hyperoxia would be particularly useful in applications of hyperoxia-based calibrated fMRI, in which flow changes are typically assumed based on group measurements8.
Acknowledgements
The project described was supported by the National Center for Research Resources, Grant UL1RR024134, and is now at the National Center for Advancing Translational Sciences, Grant UL1TR000003. The content is solely the responsibility of the authors and does not necessarily represent the official views of the NIH. Also supported in part by the Institute for Translational Medicine and Therapeutics’ (ITMAT) Transdisciplinary Program in Translational Medicine and Therapeutics, and NIH grant T32 HL007954.References
1. Tadamura E, Hatabu H, Li W, Prasad PV, Edelman RR. Effect of oxygen inhalation on relaxation times in various tissues. J Magn Reson Imaging. 1997;7:220–225.
2. Wang DJ, Zhang Y, Wolf RL, Roc AC, Alsop DC, Detre JA. Amplitude-modulated continuous arterial spin-labeling 3.0-T perfusion MR imaging with a single coil: Feasibility study. Radiology. 2005;235:218–228.
3. Bulte DP, Chiarelli PA, Wise RG, Jezzard P. Cerebral perfusion response to hyperoxia. JCBFM. 2006;27:69–75.
4. Fernández-Seara MA, Rodgers ZB, Englund EK, Wehrli FW. Calibrated bold fMRI with an optimized ASL-BOLD dual-acquisition sequence. NeuroImage. 2016;142:474–482.
5. Alsop DC, Detre JA, Golay X, Günther M, Hendrikse J, Hernandez-Garcia L, Lu H, MacIntosh BJ, Parkes LM, Smits M, van Osch MJP, Wang DJ, Wong EC, Zaharchuk G. Recommended implementation of arterial spin-labeled perfusion MRI for clinical applications: A consensus of the ISMRM perfusion study group and the European consortium for ASL in dementia. Magn Reson Med. 2014;73:102–116.
6. Aslan S, Xu F, Wang PL, Uh J, Yezhuvath US, van Osch M, Lu H. Estimation of labeling efficiency in pseudocontinuous arterial spin labeling. Magn Reson Med. 2010;63:765–771.
7. Siero JCW, Strother MK, Faraco CC, Hoogduin H, Hendrikse J, Donahue MJ. In vivo quantification of hyperoxic arterial blood water T1. NMR Biomed. 2015;28:1518–1525.
8. Chiarelli PA, Bulte DP, Wise R, Gallichan D, Jezzard P. A calibration method for quantitative BOLD fMRI based on hyperoxia. NeuroImage. 2007;37:808–820.
Figures
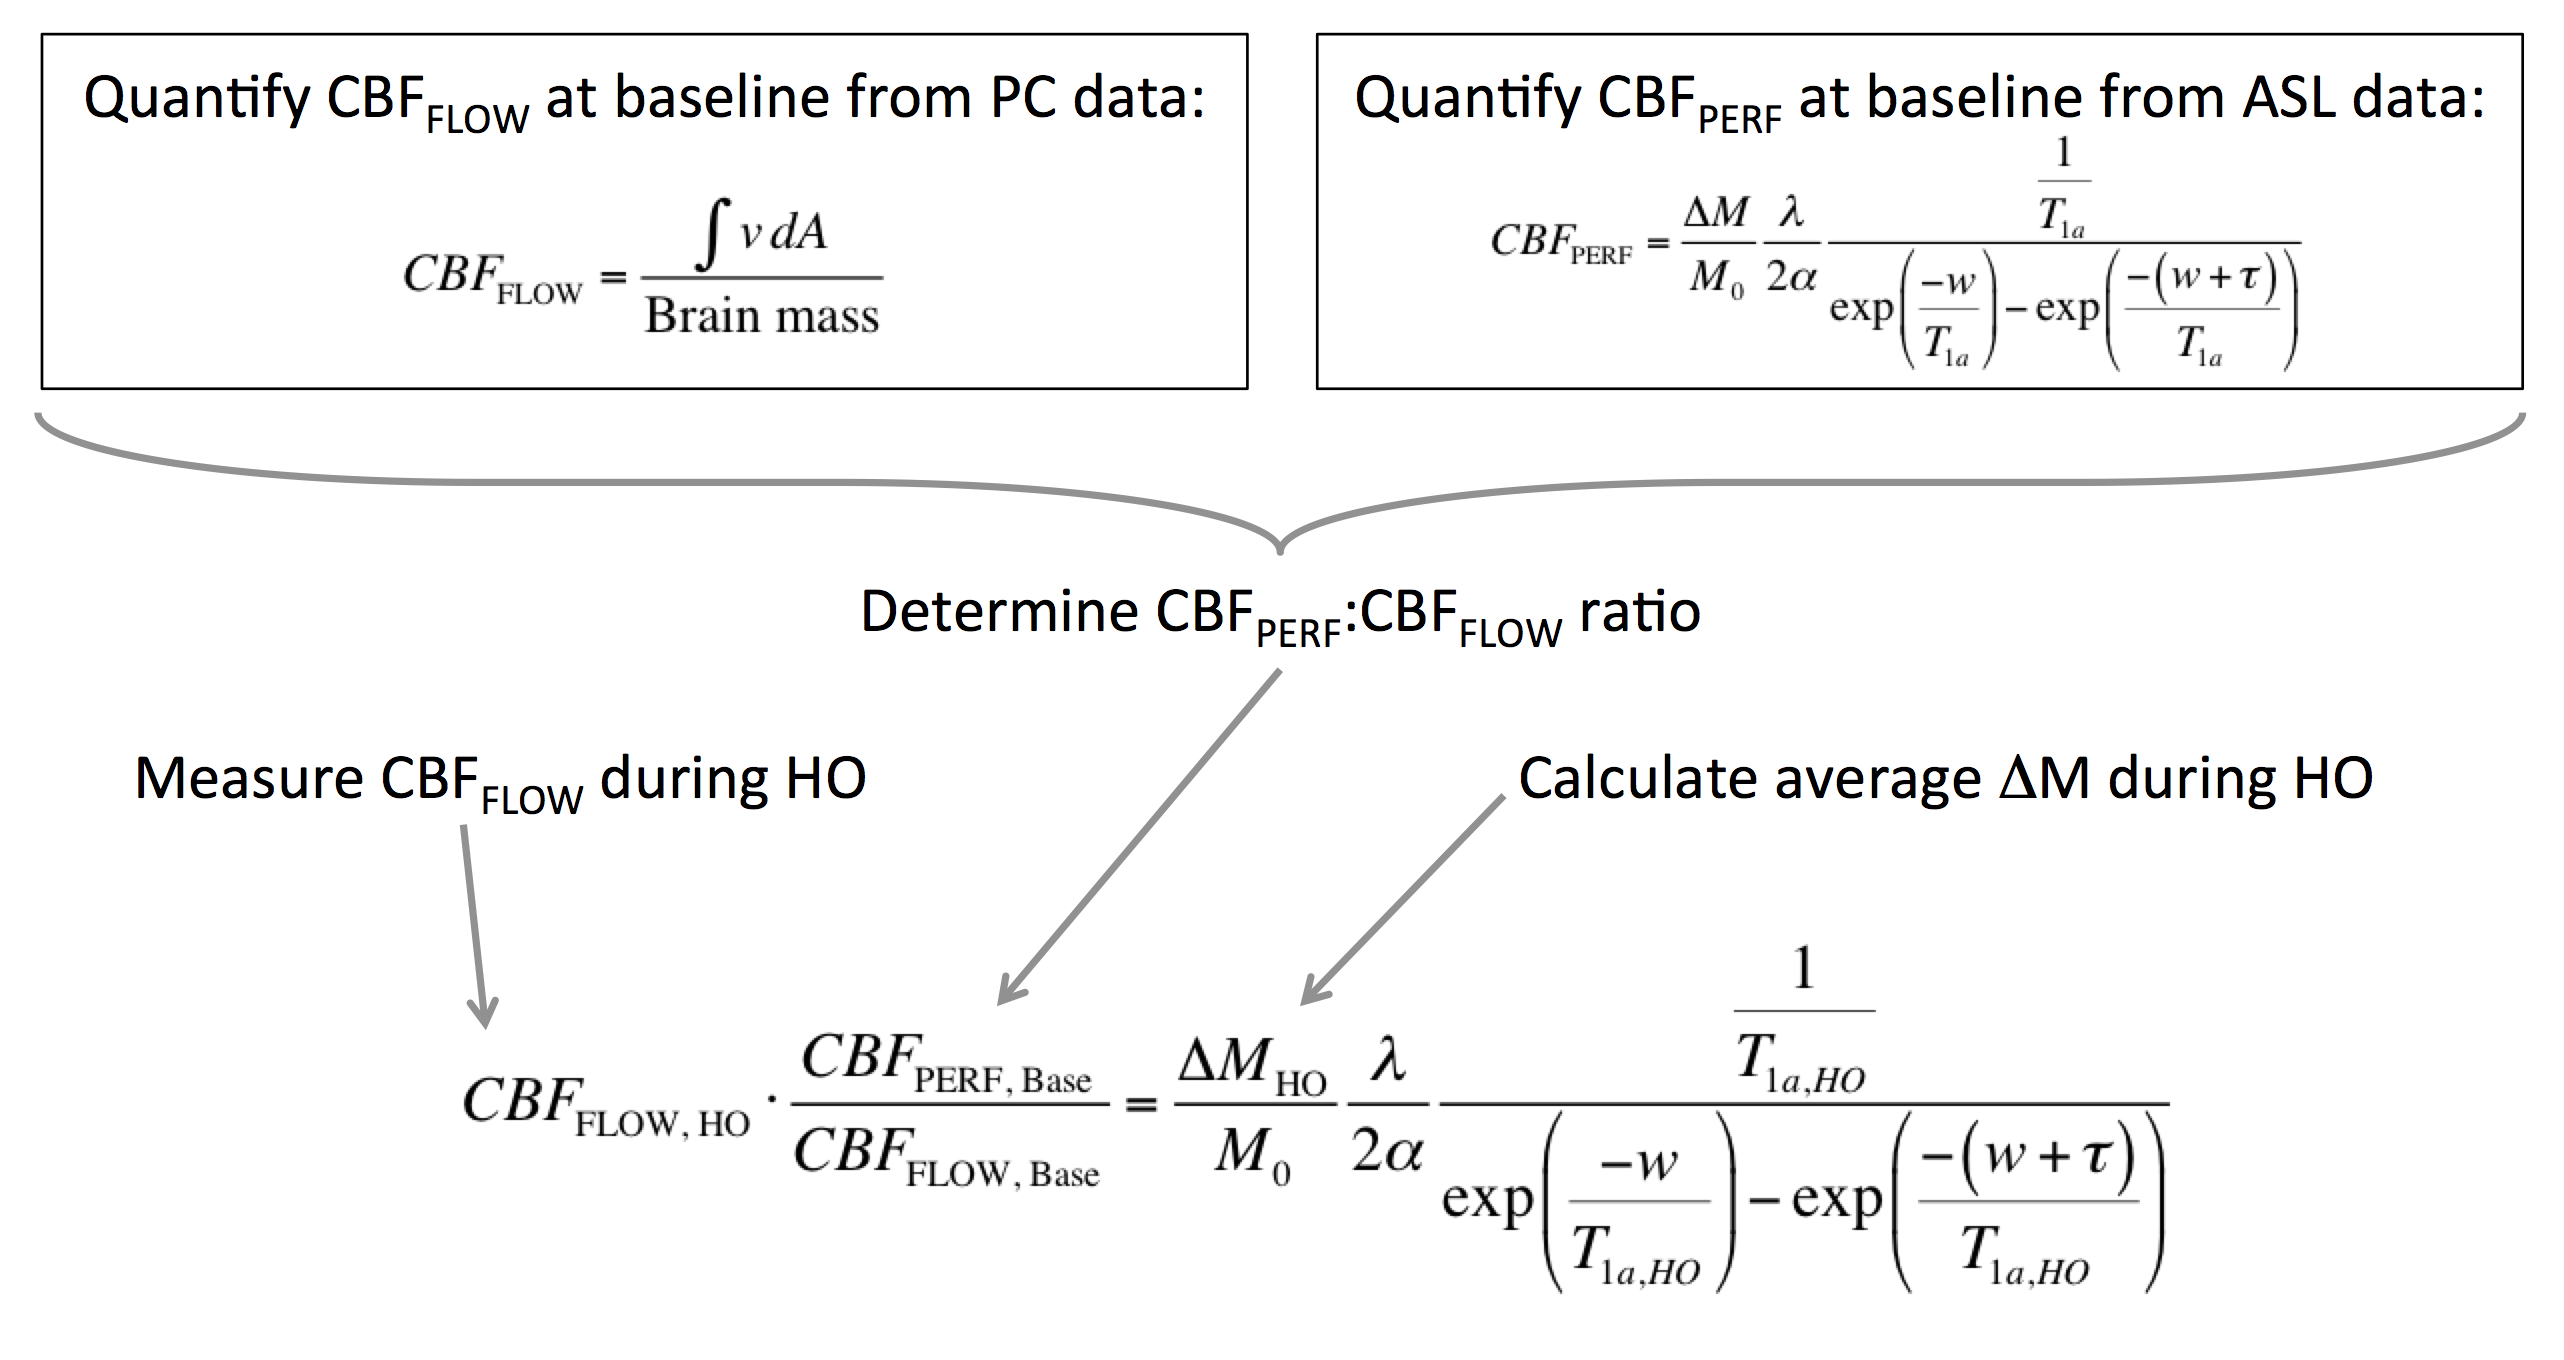
Figure 1. Steps for estimation of T1 are as follows:
1. Quantify CBFFLOW at baseline from PC data by integrating velocity in inflow vessels (internal carotid and vertebral arteries) over their cross-sectional area and dividing by brain mass (estimated from T1-weighted MPRAGE).
2. Quantify CBFPERF at baseline from ASL data assuming T1a = 1.65 s.
3. Determine ratio between CBFFLOW and CBFPERF at baseline.
4. Measure CBFFLOW during hyperoxia (HO), and apply ratio from step 3 to estimate CBFPERF during hyperoxia.
5. Calculate average ΔM from ASL data during hyperoxia.
6. Solve perfusion quantification equation for T1a during hyperoxia.