3801
A feasibility study of using noninvasive renal oxygenation imaging to delineate different severities of renal ischemia in atheroembolic renal disease model1Academy for Advanced Interdisciplinary Studies, Peking University, Beijing, People's Republic of China, 2College of Engineering, Peking University, Beijing, People's Republic of China, 3Philips Healthcare, Suzhou, People's Republic of China, 4Department of Radiology, Peking University First Hospital, Beijing, People's Republic of China, 5Renal Division, Peking University First Hospital, Beijing, People's Republic of China, 6Institute of Science and Technology for Brain-Inspired Intelligence, Fudan University, Shanghai, People's Republic of China
Synopsis
Since the use of angiographic and endovascular procedures increased rapidly during the past decades, the frequency of atheroembolic renal disease raised recently. This study demonstrates the feasibility of applying an MRI based oxygenation imaging to evaluate renal ischemia in an atheroembolic renal disease model. The average renal oxygen extraction fraction (OEFs) as well as the ratios between embolized kidney and contralateral kidney show significant differences between groups. Renal OEF measurement appears to be able to delineate different severities of renal ischemia by revealing information about the balance between tubular workload and delivery of oxygen.
Introduction
Since the use of angiographic and endovascular procedures increased rapidly during the past decades, the frequency of atheroembolic renal disease raised recently1,2. However, the decline of renal function always occurs over 3 to 8 weeks, which will finally lead to renal failure. The systemic nature of atheroembolism makes diagnosis difficult.Purpose
To evaluate the utility of an MRI based renal oxygenation imaging technique for the detection of early stage renal ischemia associated with atheroembolism.Materials and Methods
Animal study
The Institutional Animal Care and Use Committee approved all procedures and protocols in this study. Twenty male New Zealand White rabbits, weighing 2.5-3.5 kg, were included in this study.
Microspheres were injected into the kidney with a 4F catheter positioned in the ostium of the right renal artery. DSA examination was performed on an angiographic unit (Integris Allura, Philips Medical Systems) during surgery. Animals were grouped according to number of injected microspheres: Group 1 received 0.8 mg (approximately 5 × 10⁴) of microspheres (n = 5); Group 2 received 0.4 mg of microspheres (n = 5); Group 3 received 0.2 mg of microspheres (n = 5); and Group 4 received saline without microspheres (control, n = 5).
Blood samples were collected from the animals a day before, and once a week along with the evolution of atheroembolism. Serum creatine levels were determined using the Reflotron system (Roche Diagnostics, Basel, Switzerland).
Four weeks after surgery, kidneys were removed and embedded in paraffin. Paraffin sections were stained with hematoxylin and eosin (HE) for further histological examination.
MRI methods
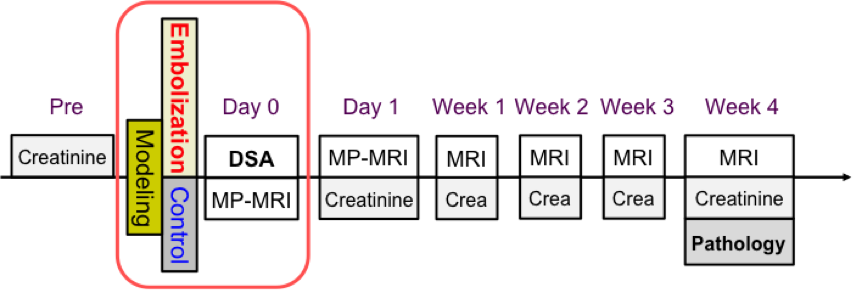
Renal images were carried out on a 3.0 Tesla Philips Achieva MR scanner (Philips Medical Systems, Best, Netherlands), using an 8-channel knee coil. Diagram of the experiment is shown in Fig 1. A serial MR examination was performed at intervals of 1 hour, 1 day, 1 week and 4 weeks following microsphere injection to observe the deterioration of renal function.
For renal oxygenation (oxygen extraction fraction, OEF) measurement, a multi-echo asymmetric spin-echo (ASE) sequence, which is sensitive to the local tissue oxygenation, was implemented as previously described3. Detailed imaging parameters were: FOV = 120 × 120 mm2, matrix size = 80 × 75, TR = 2000 ms, TE1/TE2/TE3 = 60/88/116 ms, slice thickness = 5 mm, SENSE factor = 2. T2-weighted images and diffusion-weighed (DW) images (b values of 0 and 1000 s/mm2) were acquired in the matching coronal plane. To maintain the comparability between different imaging sequences, all images were acquired with the same geometry.
Quantitative Analysis
Prior to the calculation of renal OEF, images were filtered by using a Gaussian low-pass filter (kernel size of 3 × 3, and standard deviation of 1.5) to improve the signal-noise-ratio (SNR).
Results
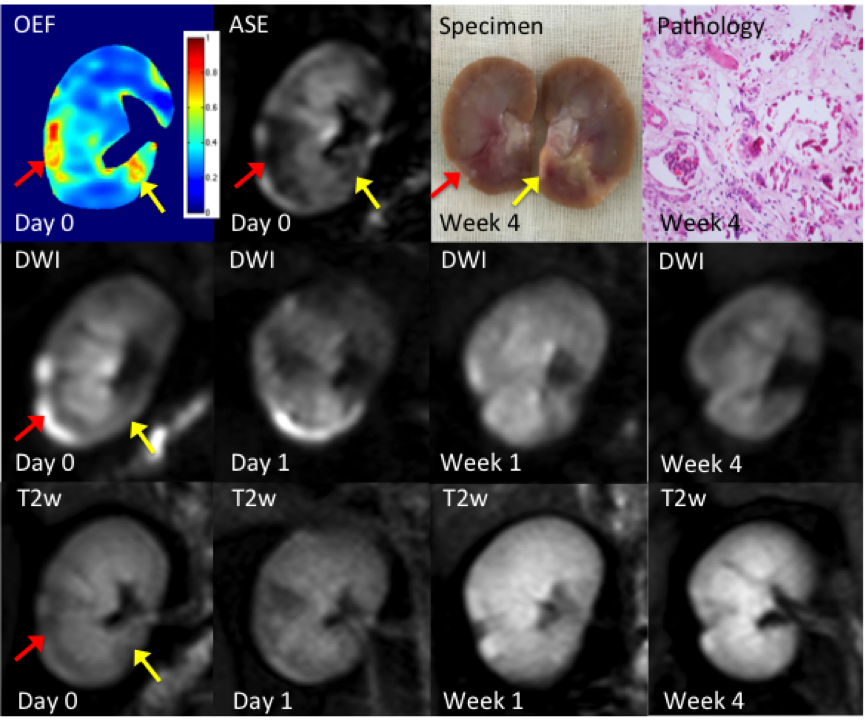
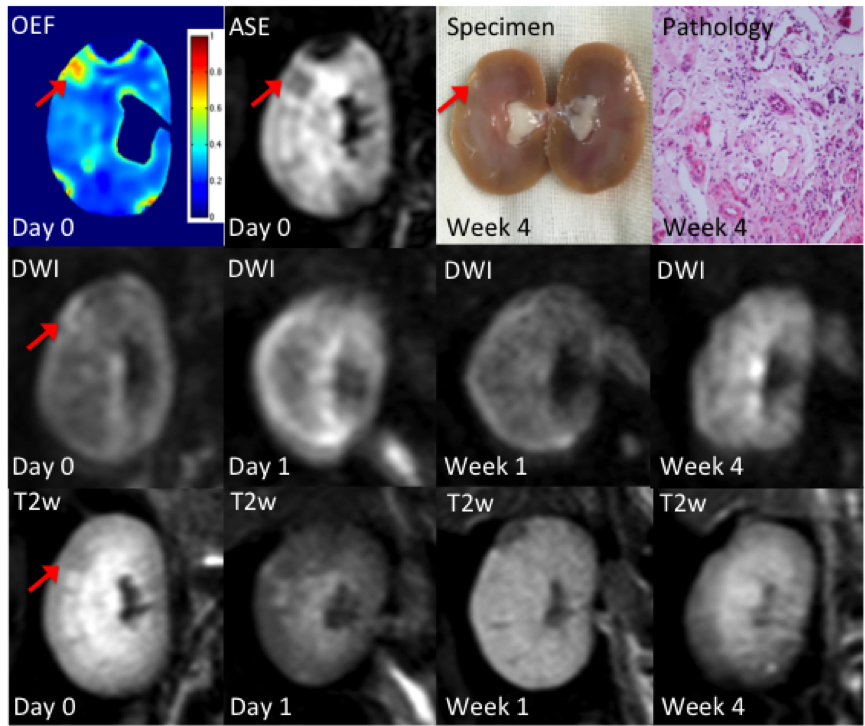
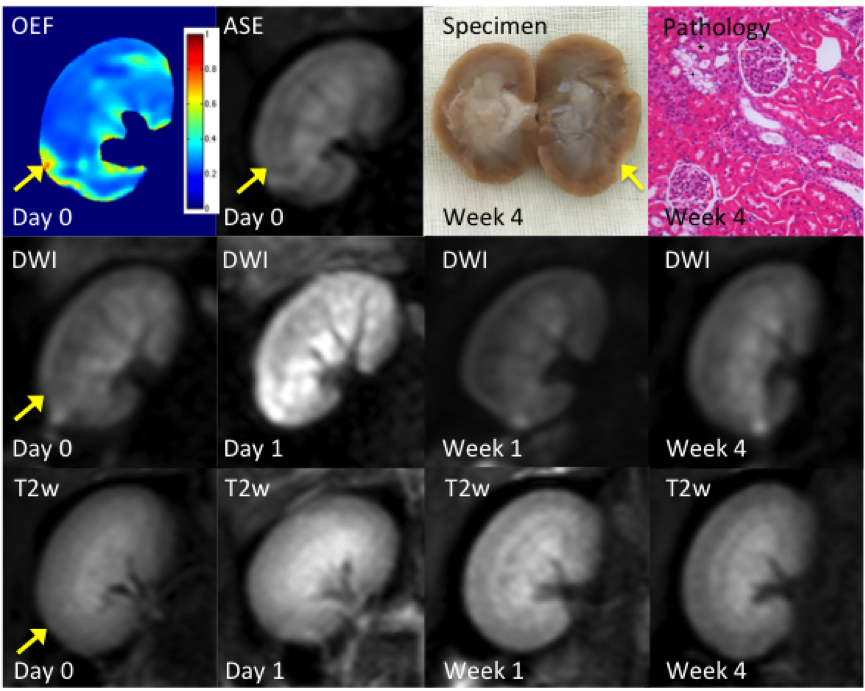
Three representative rabbits are shown in Fig 2-4, exhibiting decreasing levels of injure. The most severely embolized rabbit (Fig 2, red arrow) demonstrated a large region with markedly increased renal OEF soon after surgery, which could also be noticed in DW and T2w images. The region marked by yellow arrow shows elevated OEF but no abnormal signal in DW images. A moderately embolized rabbit (Fig 3) demonstrated a region of elevated OEF that is less obvious in both DW and T2w images (marked by red arrow). In both rabbits, regions of pronounced OEF increase appeared to be predictive of the final pathology-defined lesions. The rabbit with mild embolization (Fig 4) demonstrates modest increase in renal OEF after the immediate stage of ischemia. No infarct was found in the follow-up T2w scan but could be noticed in the pathological examination (yellow arrow).
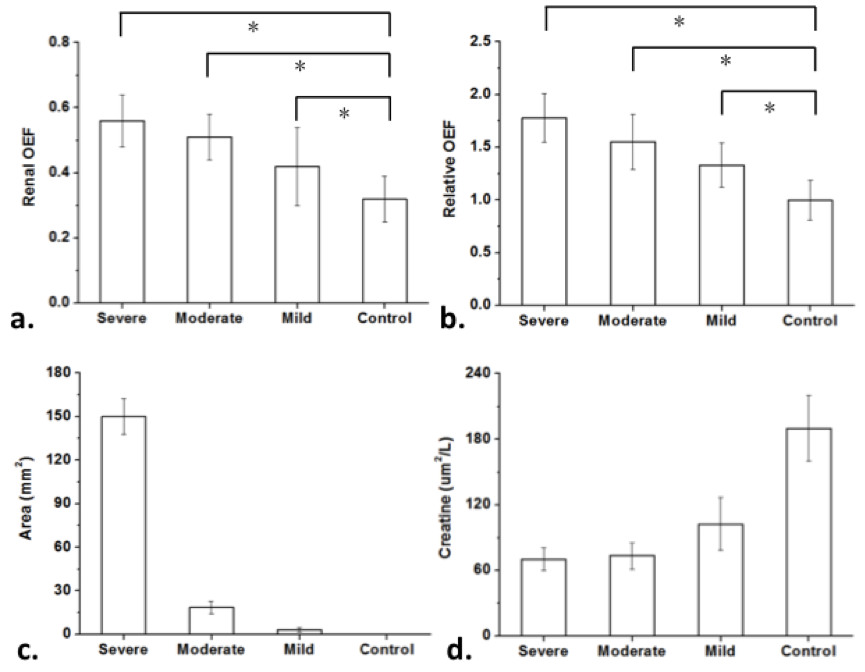
The average renal OEFs as well as the ratios between embolized kidney and contralateral kidney show significant differences between groups (Fig 5.a. and Fig 5.b). The areas of damaged lesions (defined by renal OEF measurements) increased with the increase number of microspheres injection (Fig 5.c). These results suggest that renal OEF could be a useful predictor to delineate different severities of renal ischemia.
Conclusion
This study demonstrates the feasibility of applying an MRI based oxygenation imaging to evaluate renal ischemia in an atheroembolic renal disease model. Renal OEF measurement appears to be able to delineate different severities of renal ischemia by revealing information about the balance between tubular workload and delivery of oxygen.Acknowledgements
No acknowledgement found.References
1. Jean WJ et al. (1994). Cathet Cardiovasc Diagn 32: 8–10
2. Weber-Mzell D et al. (2002). Eur Heart J 23: 1684–1691
3. Wang C, et al. , 2016, DOI: 10.1002/jmri.25163
Figures