3800
Quantification of cerebral venous oxygenation using a two-compartment model of local phase evolution1Sir Peter Mansfield Imaging Centre, University of Nottingham, UK, Nottingham, United Kingdom
Synopsis
We propose that a two-compartment model of the evolution of signal phase, processed using Frequency Difference Mapping, could be applied to study venous oxygenation and architecture at the microscopic scale. This study demonstrates proof-of-concept, quantifying Yv in large vessels, and tests the sensitivity of these values to hyperoxia. We discuss how this new method can be adapted to probe venous microstructure within grey matter, providing more sensitive measures of brain tissue function.
Purpose
MRI methods to quantify cerebral venous oxygenation, $$$Y_\text{v}$$$, offer an exciting biomarker for tissue metabolism. Existing techniques characterise intra-vascular magnitude or phase information to measure $$$Y_\text{v}$$$, however these are limited to studying vessels larger than the imaging resolution1,2. Smaller vessels with known geometry can be examined, modelling the gradient-echo signal decay as a two-compartment model containing tissue and venous contributions3. An alternative approach4 induces a change in perivascular signal phase by altering blood oxygen levels, removing dependence on vessel geometry, however this is also only appropriate for single, resolved veins.
We propose that a two-compartment model of the evolution of signal phase, processed using Frequency Difference Mapping5, could be applied to study venous oxygenation and architecture at the microscopic scale. This study demonstrates proof-of-concept, quantifying $$$Y_\text{v}$$$ in large vessels, and tests the sensitivity of these values to hyperoxia. We discuss how this new method can be adapted to probe venous microstructure within grey matter, providing more sensitive measures of brain tissue function.
Methods
Data Acquisition
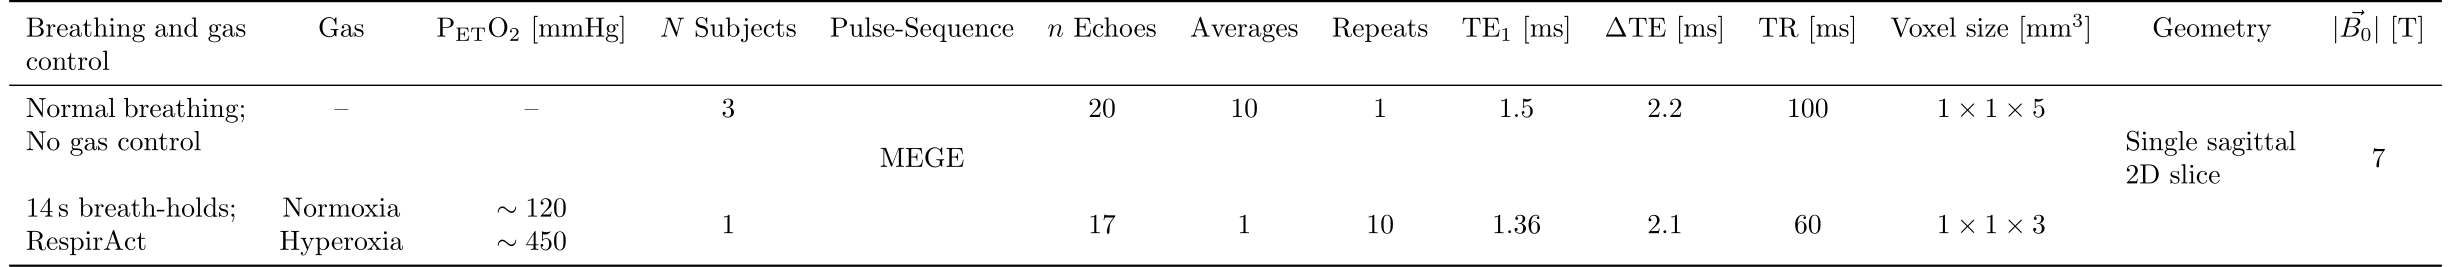
Multi-echo gradient-echo 2D sagittal single-slice magnitude and phase images were acquired from 4 healthy volunteers on a 7T Philips Achieva (Netherlands), scanning parameters are listed in Table 1. For one participant, normoxic/hyperoxic gas mixtures were delivered using the RespirActTM system (TRI, Canada) to modulate $$$Y_\text{v}$$$; this data was acquired during short breath-holds to reduce respiration-related phase artifacts, and 10 acquisitions for each gas mixture were averaged.
Two-compartment model
The complex signal evolution with echo-time $$$\text{TE}_n=\text{TE}_1+(n-1)\Delta\text{TE}$$$ from a voxel can be described using a 2-compartment model
$$$S_n=S(\mathrm{TE}_n)\sim{}S_\text{venous}+S_\text{tissue}=\lambda\cdot{}e^{-R^*_{2,\text{t}}\text{TE}_n}+(1-\lambda)\cdot e^{-R^*_{2,\text{v}}\text{TE}_n}\cdot{}e^{i\langle\Delta\omega\rangle\text{TE}_n},\qquad\qquad\qquad\qquad\qquad[1]$$$
where $$$R_2^*$$$ denotes the venous and tissue rates of relaxation, $$$\lambda$$$ is the venous signal fraction and $$$\langle\Delta\omega\rangle$$$ is the average orientation- and oxygenation-dependent frequency offset:
$$$\langle\Delta\omega\rangle=\frac{1}{2}\cdot\gamma{}B_0\cdot\Delta\chi_\text{do}\cdot\text{hct}\cdot(1-Y)\cdot\left(\cos^2\theta-\frac{1}{3}\right).\qquad\qquad\qquad\qquad\qquad[2]$$$
Fitting the 2-compartment model, assuming hct=0.45 and $$$\Delta\chi_\text{do}=4\pi\cdot0.18{}$$$ppm, and estimating the orientation of each vessel from the ROI geometry, we can then calculate $$$Y_\text{v}$$$ from the FDM results.
FDM analysis of signal phase
Prior to modelling the signal, the complex data were pre-processed by removing the RF-related phase offsets and large length-scale field variations. This can be established as described previously5, calculating the frequency difference map (FDM) at each TE as:
$$$\text{FDM}(\text{TE}_n)=\arg\left(\frac{S_n\cdot S_1^{n-2}}{S_2^{ni1}}\right)\cdot\frac{1}{s\pi\cdot(\text{TE}_n-\text{TE}_1)}\qquad\qquad\qquad\qquad\qquad[3]$$$
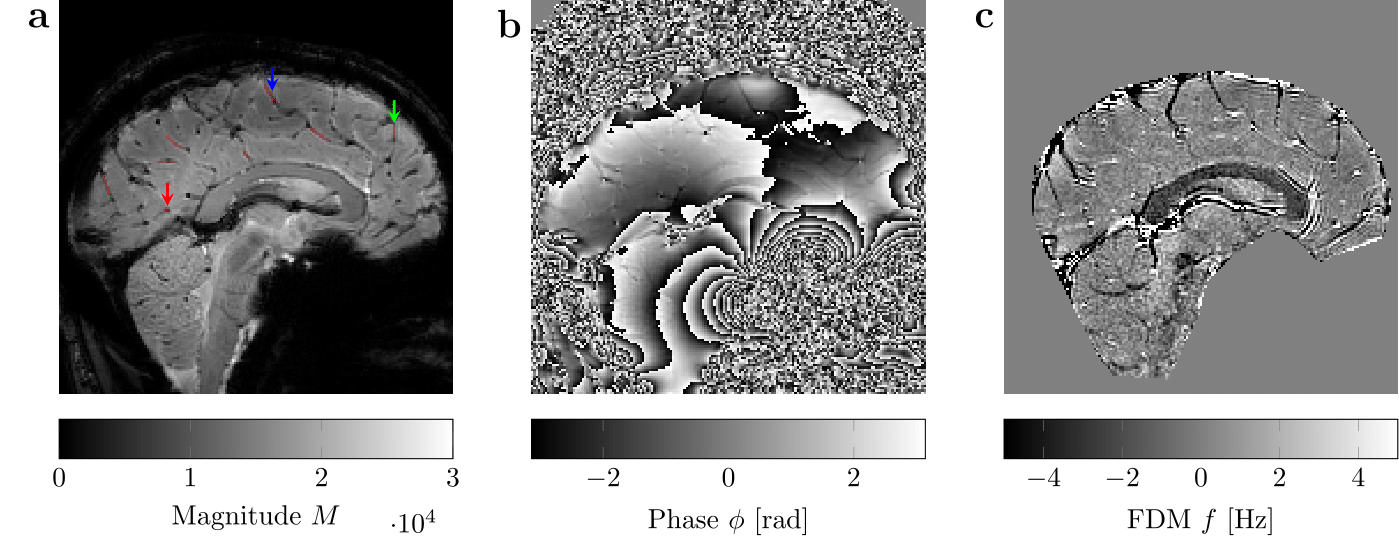
Large veins were identified in
the magnitude images at
$$$TE=20\,$$$ms
; ROIs were drawn around straight
segments of each vessel, and the vessel orientation with respect to $$$\vec{B}_0$$$ represented by angle was
estimated. Frequency difference and magnitude data
were averaged across each ROI for each echo.
Results
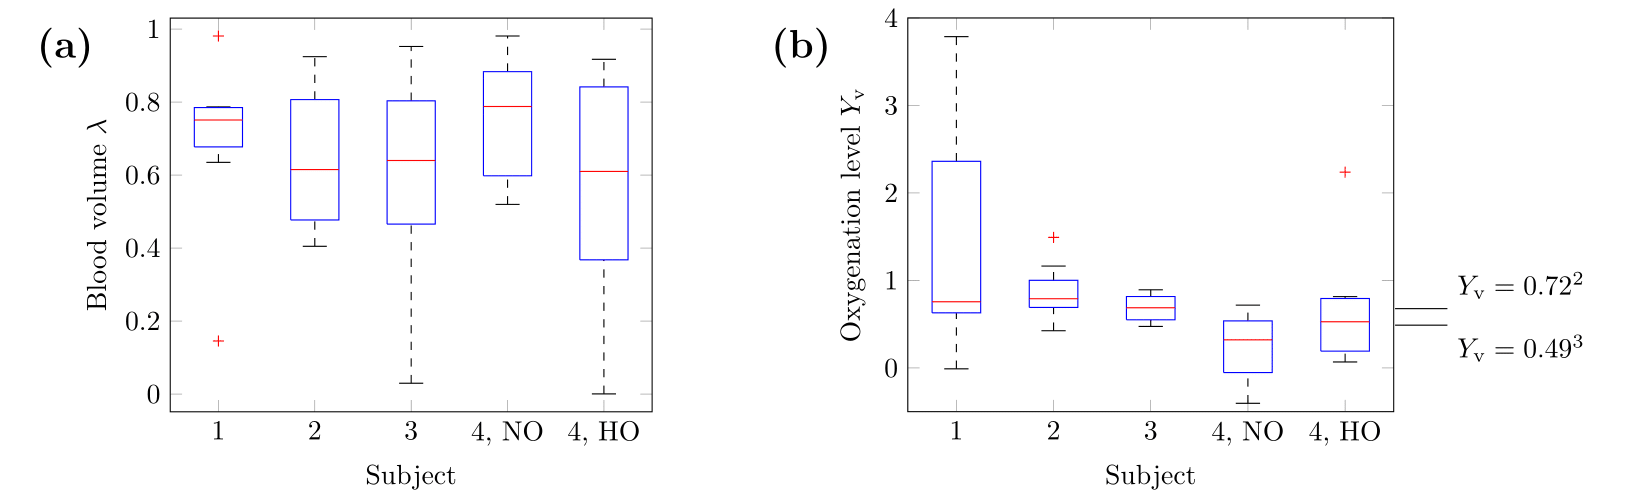
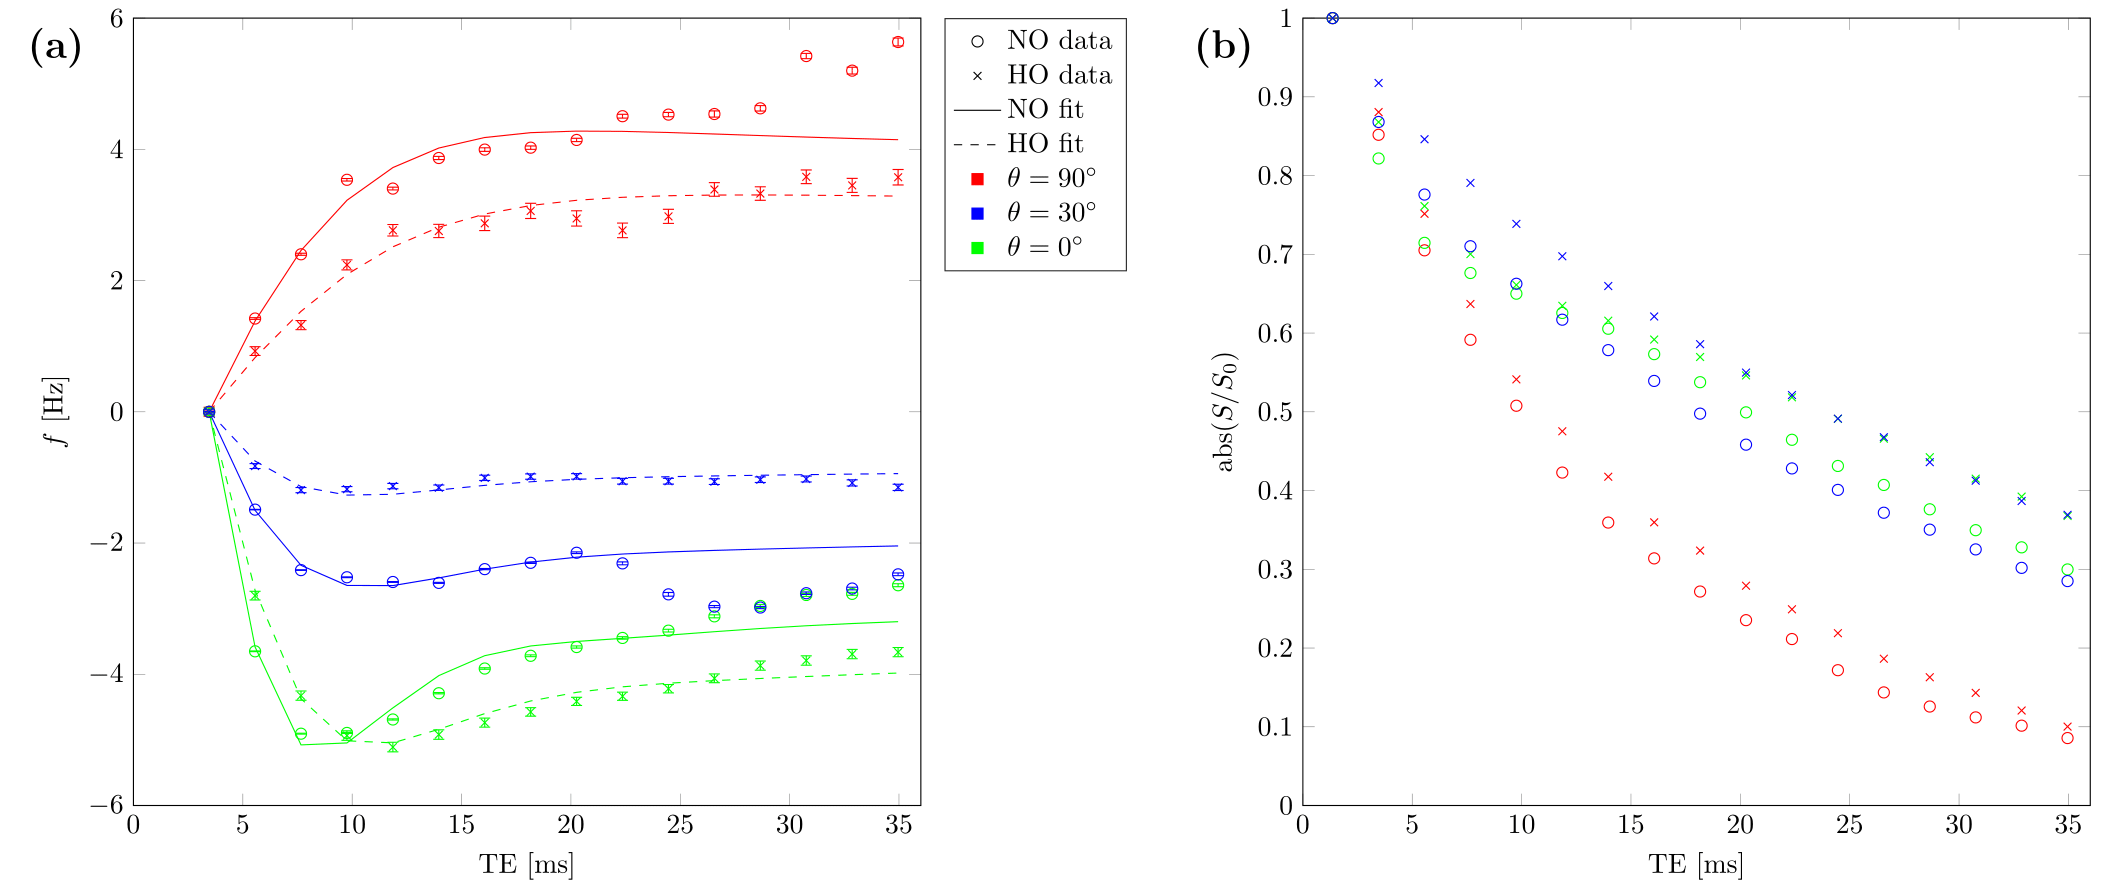
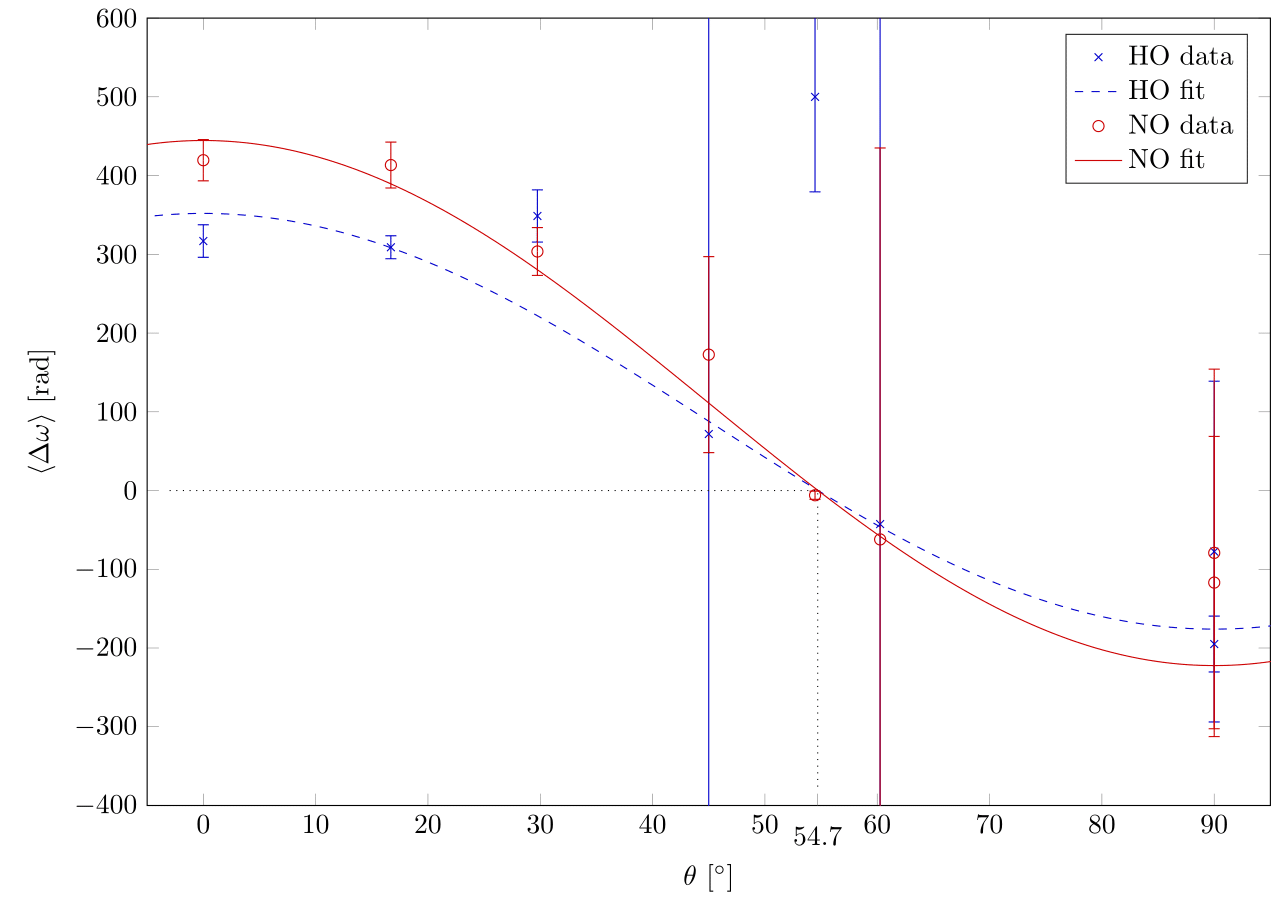
Figure 1 provides example magnitude, phase and calculated FDM images. The distributions of $$$\lambda$$$ and $$$Y_\text{v}$$$ values estimated from the best-fitting parameters for 8 vessels from each scan are presented in Figure2. To examine the sensitivity of these results to changes in orientation and oxygenation, the normoxia/hyperoxia magnitude and FDM data in 3 vessels of different orientations, and the 2-compartment model fits to these data, are presented in Figure3. Fitted values for $$$\langle\Delta\omega\rangle$$$ from all 8 ROIs in these scans are plotted as a function of (Figure4), and fit using Eq.2 to measure $$$Y_\text{v}(\text{normoxia})=0.30\pm0.05$$$ and $$$Y_\text{v}(\text{hyperoxia})=0.45\pm0.07$$$.Discussion
Quantification of $$$Y_\text{v}$$$
Several vessel ROIs produced non-physiological
$$$Y_\text{v}$$$ values above 1, as well as implausible blood volume
measurements. Figure 4 shows that inaccurate fitting of
$$$\langle\Delta\omega\rangle$$$ occurs when $$$\theta$$$ approaches the magic
angle, which reflects a fundamental limitation when studying susceptibility
effects. Other ROIs demonstrate more reasonable agreement with expected values
($$$Y_\text{v}=0.49\dots0.72$$$)1-4, however more robust fitting
procedures and measurement of haematocrit would improve estimation of both
$$$\lambda$$$ and $$$Y_\text{v}$$$.
Sensitivity to hyperoxia and orientation
In the combined data of Figure 4, we observe an
increase in $$$Y_\text{v}$$$ during hyperoxia, as expected, demonstrating our
method is sensitive to oxygenation changes. This increase translates to a
reduction in $$$\langle\Delta\omega\rangle$$$, which is manifested as a reduced
frequency difference at longer TE values (Figure 3).
Limitations and future work
Higher through-plane resolution and greater coverage
would improve estimation of vessel geometry, improving the accuracy of
$$$Y_\text{v}$$$ quantification. Breath-holding reduced phase artefacts, but
also limited the acquisition time and thus resolution/coverage in this study.
This new technique must be validated against existing methodologies for single,
sub-voxel veins; however, it can also theoretically be expanded to model venous
microstructure. Although signal models typically assume small vessels in brain
tissue can be described as randomly oriented cylinders6, any
coherence in the orientation of these cylinders would produce a frequency
offset between the intravascular and tissue compartments. We aim to adapt the
models presented here to assess whether there is coherent venous orientation in
the cortical ribbon of grey matter, and whether useful oxygenation diagnostics
can be mapped across the brain using phase data.
Acknowledgements
No acknowledgement found.References
[1] Lu, H. and Ge, Y. (2008), Quantitative evaluation of oxygenation in venous vessels using T2-Relaxation-Under-Spin-Tagging MRI. Magn. Reson. Med., 60: 357–363. doi:10.1002/mrm.21627
[2] Fan, A. P., Bilgic, B., Gagnon, L., Witzel, T., Bhat, H., Rosen, B. R., & Adalsteinsson, E. (2014). Quantitative Oxygenation Venography from MRI Phase. Magnetic Resonance in Medicine?: Official Journal of the Society of Magnetic Resonance in Medicine / Society of Magnetic Resonance in Medicine, 72(1), 149–159. doi:10.1002/mrm.24918
[3] Sedlacik J, Rauscher A, Reichenbach JR. Quantification of modulated blood oxygenation levels in single cerebral veins by investigating their MR signal decay. Z Med Phys. 2009;19(1) 48-57. doi:10.1016/j.zemedi.2008.07.005. PMID: 19459585.
[4] Driver, I. D., Wharton, S. J., Croal, P. L., Bowtell, R., Francis, S. T., & Gowland, P. A. (2014). Global intravascular and local hyperoxia contrast phase-based blood oxygenation measurements. Neuroimage, 101, 458–465. doi:10.1016/j.neuroimage.2014.07.050
[5] Wharton, S., & Bowtell, R. (2012). Fiber orientation-dependent white matter contrast in gradient echo MRI. Proceedings of the National Academy of Sciences of the United States of America, 109(45), 18559–18564. doi:10.1073/pnas.1211075109
[6] He, X. and Yablonskiy, D. A. (2007), Quantitative BOLD: Mapping of human cerebral deoxygenated blood volume and oxygen extraction fraction: Default state. Magn. Reson. Med., 57: 115–126. doi:10.1002/mrm.21108
Figures