3798
A novel MR-based framework for subject-specific guidance of TMS treatments1Center for Image Sciences, UMC Utrecht, Utrecht, Netherlands, 2Rudolf Magnus Institute of Neuroscience, UMC Utrecht, Utrecht, Netherlands
Synopsis
In the field of neurostimulation, Transcranial Magnetic Stimulation is gaining more and more momentum since it allows direct control on brain activation in a non-invasive and non-painful manner. However, accuracy of TMS administrations and precise knowledge on its biological effects are still limited. To better understand TMS induced effects, we propose a novel combined TMS-MRI framework which allows us to map the TMS induced magnetic field and to map subject-specific brain activation by means of concurrent TMS-MRI measurements. These subject-specific measurements, will allow us to validate neuronal models which are currently used to predict TMS induced brain activations.
Introduction
Transcranial Magnetic Stimulation (TMS) is a non-invasive focal neurostimulation technique that is used in both clinical and research settings1. However, knowledge on the deployed electromagnetic (EM) field is not yet controlled with sufficient accuracy, and the biological effects of TMS stimulation are still not well understood2. TMS effects depend upon different TMS parameters such as TMS frequency, intensity, coil models and orientation, and subject-specific parameters such as brain morphology and tissue electrical conductivity3,4. Different groups are currently simulating how TMS stimulation parameters affect the deployed electric field in the brain, responsible for neuroactivation5. However, in these simulations, subject-specific factors are not directly controllable6,7. In this work, we present a unique framework consisting in a combined TMS-MRI setup8,9 which will allow us to achieve direct control on subject-specific parameters. By using this unique combined TMS-MRI setup, we can first map subject-specific brain tissue morphology and electrical properties10-12. These information will be used to simulate subject-specific deployed TMS electric field from which neuroactivation maps could be computed. Additionally, with this setup we can measure the TMS induced BOLD signal by means of concurrent TMS-fMRI experiments8. Comparison between the measured BOLD response to subject-specific simulated neuroactivation maps will allow future validation of computational models of TMS-induced neuronal activation. Being able to predict the effects of TMS in the human brain would be valuable to design and guide subject-specific TMS treatments.Methods
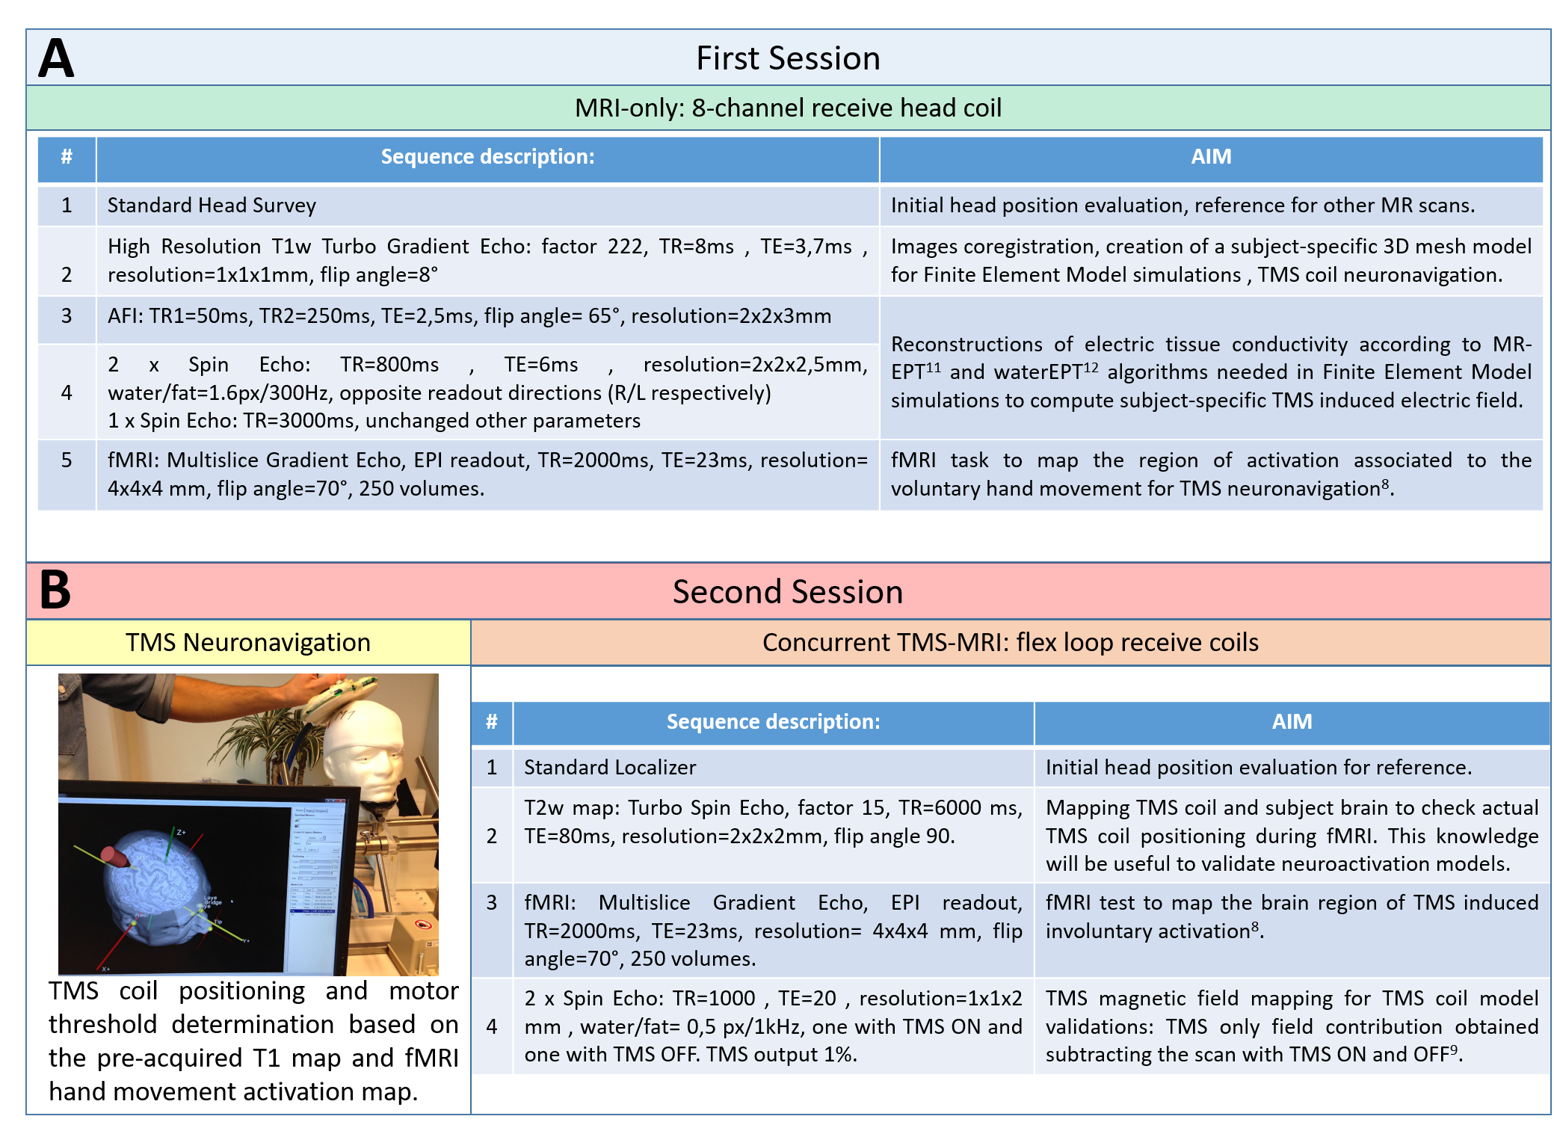
The study is subdivided in two parts.
In the first session, MR-only (Figure 1A), we map subject-specific parameters needed to predict the TMS induced electric field in the brain by means of Electromagnetic (EM) simulations. For this purpose, six MR sequences are performed in a 3T MR scanner (Philips Achieva, Best, The Netherlands). Additionally, we perform a fMRI experiment to map the voluntary activation of the motor area (M1). In this experiment, the subject is randomly asked to move the right thumb. To verify thumb movement, we use the standard MR-compatible ECG (Invivo, fs: 500 Hz) to measure the EMG of the flexor pollicis brevis and first dorsal interosseous muscles.
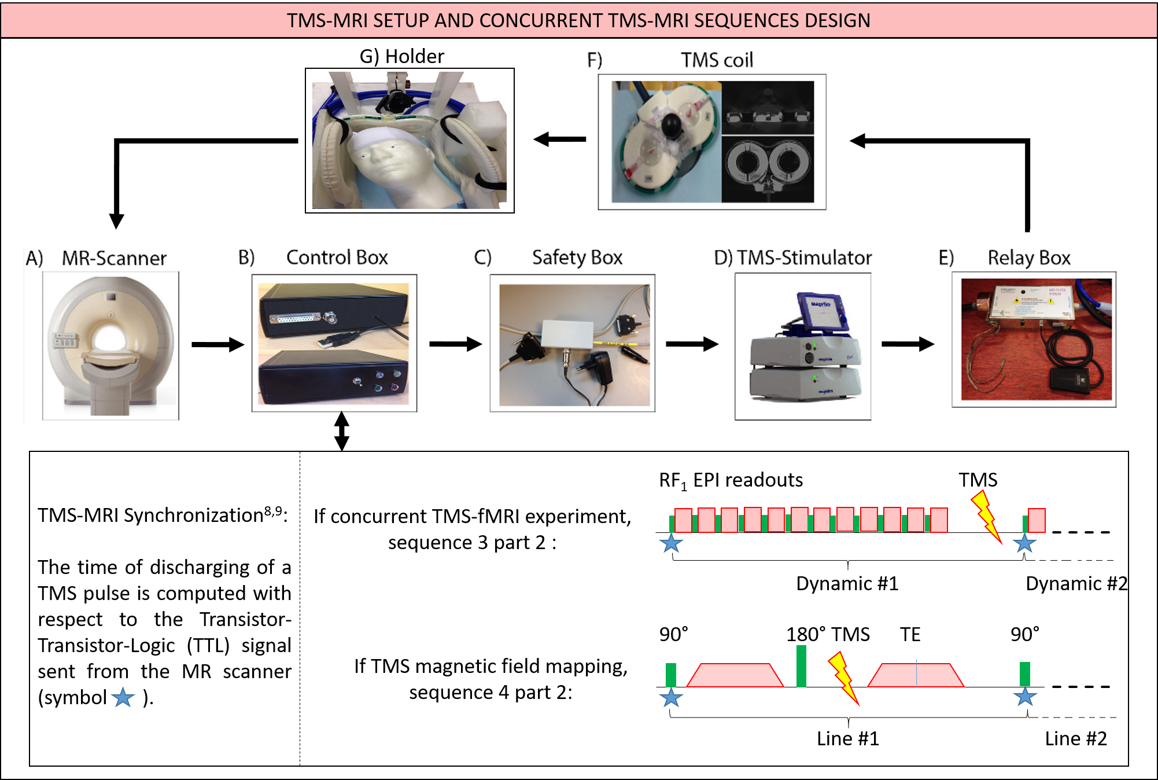
In the second part, by using a neuronavigator system13 (Figure 1,B) we first evaluate the exact TMS strength and coil position to stimulate M1 based on the subject-specific T1 map and fMRI activation maps acquired in the first session. Subsequently, by using a biphasic TMS stimulator (Magstim Rapid2,Whitland, UK) and maintaining the predetermined TMS coil position (Figure 1, B), we perform 2 concurrent TMS-MRI experiments: TMS magnetic field mapping and measurements of the TMS induce BOLD response. To avoid TMS induced artifacts in MR images, dedicated sequences and additional hardware have been developed (Figure 2).
Results and Discussion
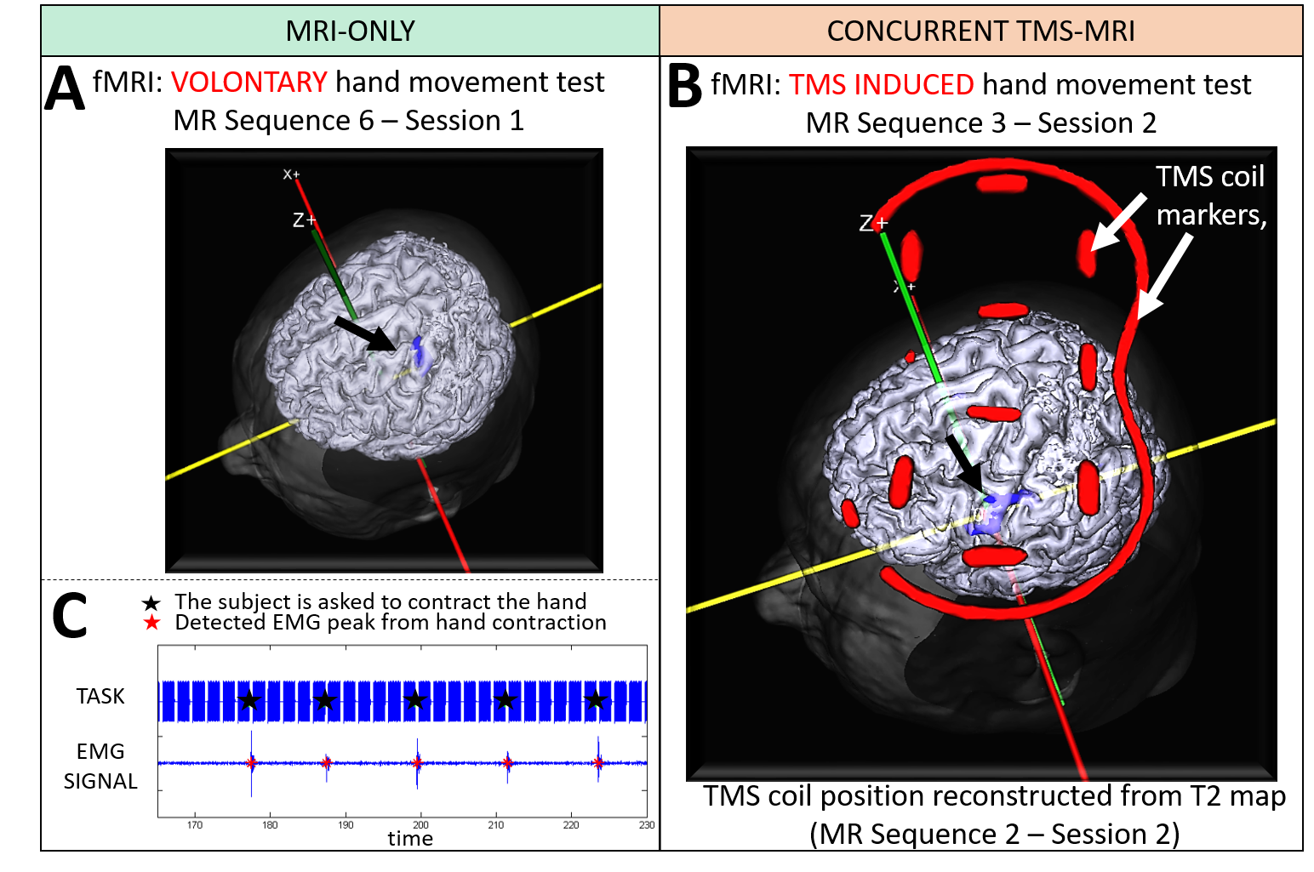
The regions of brain activation for voluntary and for TMS induced thumb contractions are shown in Figure 3A and 3B, respectively (P<0.05). This shows the feasibility of performing concurrent TMS-MRI experiments with our setup. Additionally, muscle contraction is successfully recorded using the MR-compatible ECG device modified to work as an EMG device (Figure 3C).
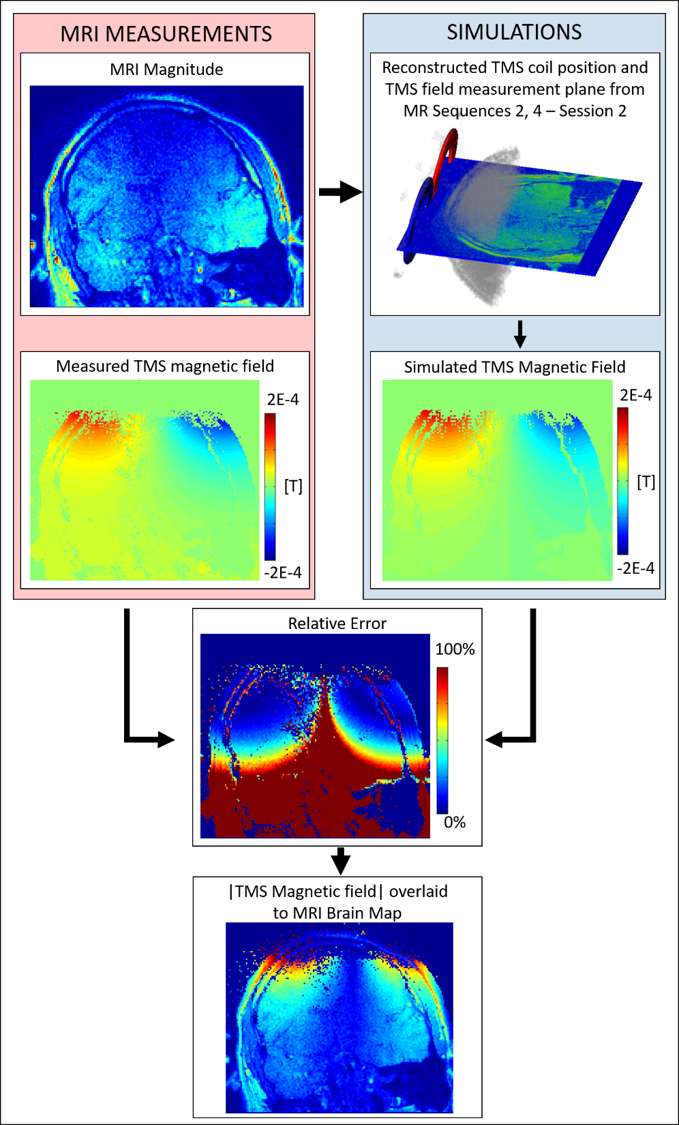
In Figure 4, we show for the first time that in-vivo measurement of the z-component of the TMS magnetic field are feasible at 1% machine output. From the relative error map, we observe good agreement between measurements and simulations (max 15% in the first 7 cm underneath the TMS coil).The TMS field in the first 2.5 cm (skin/skull) is instead not measurable due to strong signal dephasing. With these measurements, it will be possible to directly control the correct functioning of the TMS device and to validate the performed EM stimulation of the TMS deployed electric field.
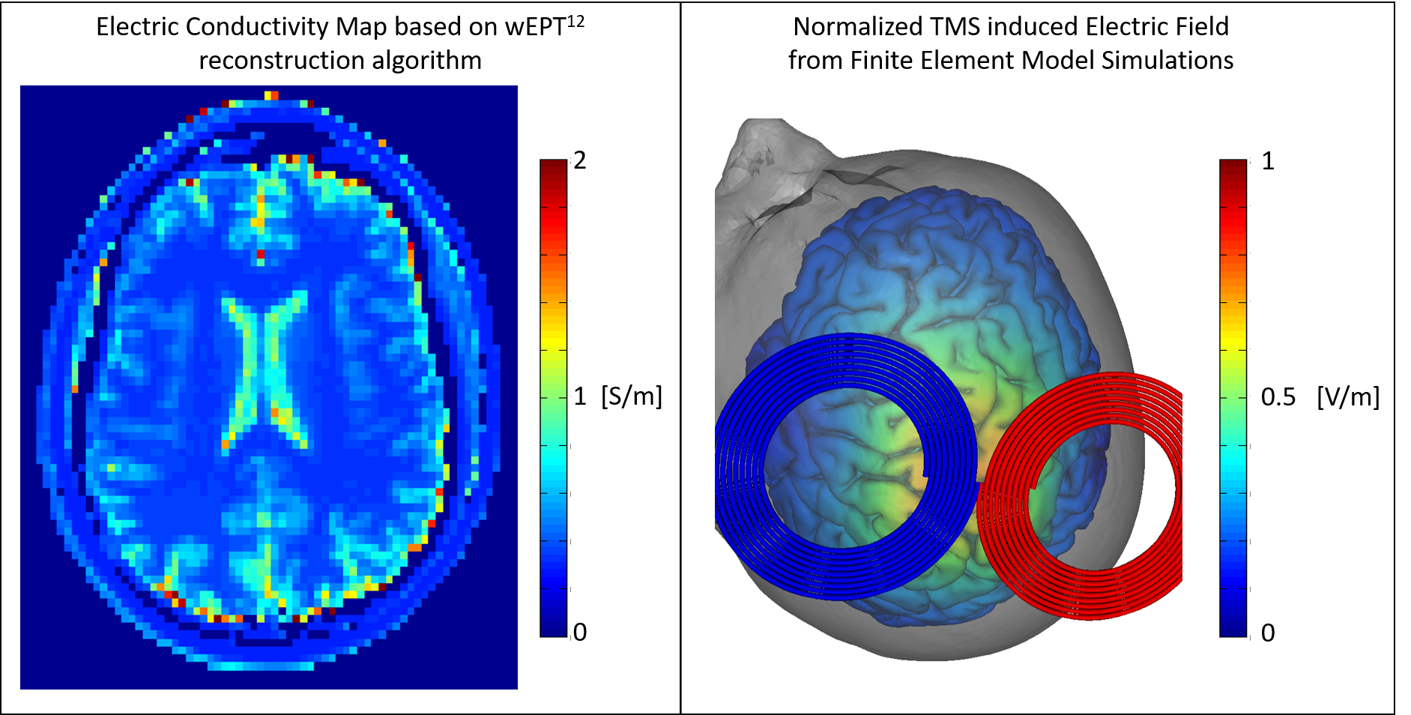
It is fundamental to understand that the deployed TMS electric field in tissues (Figure 5B) does not only depend on TMS parameters, but also on subject-specific parameters such as tissue geometry and electrical properties. While the former information can be obtained from the acquired T1 images, tissue electrical conductivity at RF frequencies can be obtained from different techniques such as MR-EPT and wEPT (Figure 5A). Still, scaling of tissue conductivity to low frequencies where TMS works is necessary14.
Conclusion
With this work, we present a novel framework that allows us to directly compare subject-specific concurrent TMS-MRI measurements and simulations. This will allow us in future works to directly compare the measured TMS induced BOLD response to activation maps computed using neuronal models, and thus to directly validate these EM models. Additionally, with this framework, we should be able to gain a better understanding on the biophysical effects of TMS, which knowledge is fundamental to allow subject-specific guidance of TMS treatments.Acknowledgements
This work was supported by the DeNeCor project being part of the ENIAC Joint Undertaking.References
1) Rossini PM, Rossi S.Neurology 2007;68:484–488.
2) Neggers SFW, Petrov PI, Mandija S, Sommer IEC, van den Berg CAT. Prog Brain Res, Comput Neurostimulation. 1st ed. Elsevier B.V.; 2015;222:229–59.
3) Peterchev A V., Wagner TA, Miranda PC, Nitsche MA, Paulus W, Lisanby SH, Pascual-Leone A, Bikson M. Brain Stimul. Elsevier Inc; 2012;5:435–53.
4) Roth BJ, Saypol JM, Hallett M, Cohen LG. Electroencephalogr Clin Neurophysiol Potentials Sect. 1991;81:47–56.
5) Thielscher A, Opitz A, Windhoff M. Neuroimage. Elsevier Inc.; 2011 Jan 1;54:234–43.
6) Opitz A, Windhoff M, Heidemann RM, Turner R, Thielscher A. Neuroimage. Elsevier Inc.; 2011 Oct 1;58:849–59.
7) Miranda PC, Hallett M, Basser PJ. IEEE Trans Biomed Eng. 2003;50(9):1074–85.
8) de Weijer A, Sommer I, Bakker E, Bloemendaal M, Bakker C, Klomp DWJ, Bestmann S, Neggers B. J Clin Neurophysiol. 2014; 31:474–87.
9) Mandija S, Petrov P, Neggers B, de Weijer A, Luijten PR, Van Den Berg CAT. NMRinBiomed 2016;29:1590-1600.
10) Katscher U, Voight T, Findeklee C, Vernickel P, Nehrke K, Dossel O, IEEE Trans Med Imaging 2009;28:1365-1374.
11) Van Lier A, Raaijmakers A, Voigt T, Lagendijk JJW, Luijten PR, Katscher U, van den Berg CAT, Magn Res Med 2014;71:354-363.
12) Michel E, Hernandez D, Lee SY, Magn Res Med 2016, early view.
13) Brain Science Tool BV, Utrecht, The Netherlands.
14) Tuch DS, Wedeen VJ, Dale AM, George JS, Billiveau JW, PNAS 2001;98:11697-11701.
Figures