3797
Comparison of MRI and optical CT measurements of murine kidney blood volume.1CRUK Cancer Imaging Centre, Institute of Cancer Research, Sutton, United Kingdom, 2CRUK Cancer Imaging Centre, Institute of Cancer Research
Synopsis
Functional MRI measurements of vasculature must be robustly validated pre-clinically. Optical computed tomography (CT) offers high-resolution ex vivo 3D imaging of perfused vasculature using India ink staining. We compared optical CT measurements of murine kidney blood volume with previously published MRI relative blood volume measurements. Fractional blood volumes of different kidney regions in optical CT images were calculated using Frangi vessel filtering, for three concentrations of India ink-staining. Significant positive correlations were found between optical CT and MRI measurements for 10% and 15% India ink staining. This is a potentially promising method for easily and cheaply validating MRI vasculature measurements.
Purpose
Functional MRI measurements of tumour vasculature can potentially provide biomarkers of vascular changes in response to vascular-targeted therapy.1,2 Before being deployed in clinical trials, imaging biomarkers need to be robustly validated pre-clinically.3 However, conventional histopathology provides only a 2D representation of a 3D vascular structure.
Optical computed tomography (CT) is a technique which can offer high-resolution ex vivo 3D imaging of the perfused vasculature using India ink. This method of imaging the vasculature is cheap and suffers from fewer practical difficulties in delivery of contrast agent than many vascular casting methods.
We report a preliminary comparison of published MRI measurements of murine kidney blood volume with high-resolution optical CT measurements of India ink-stained mouse kidneys.
Methods
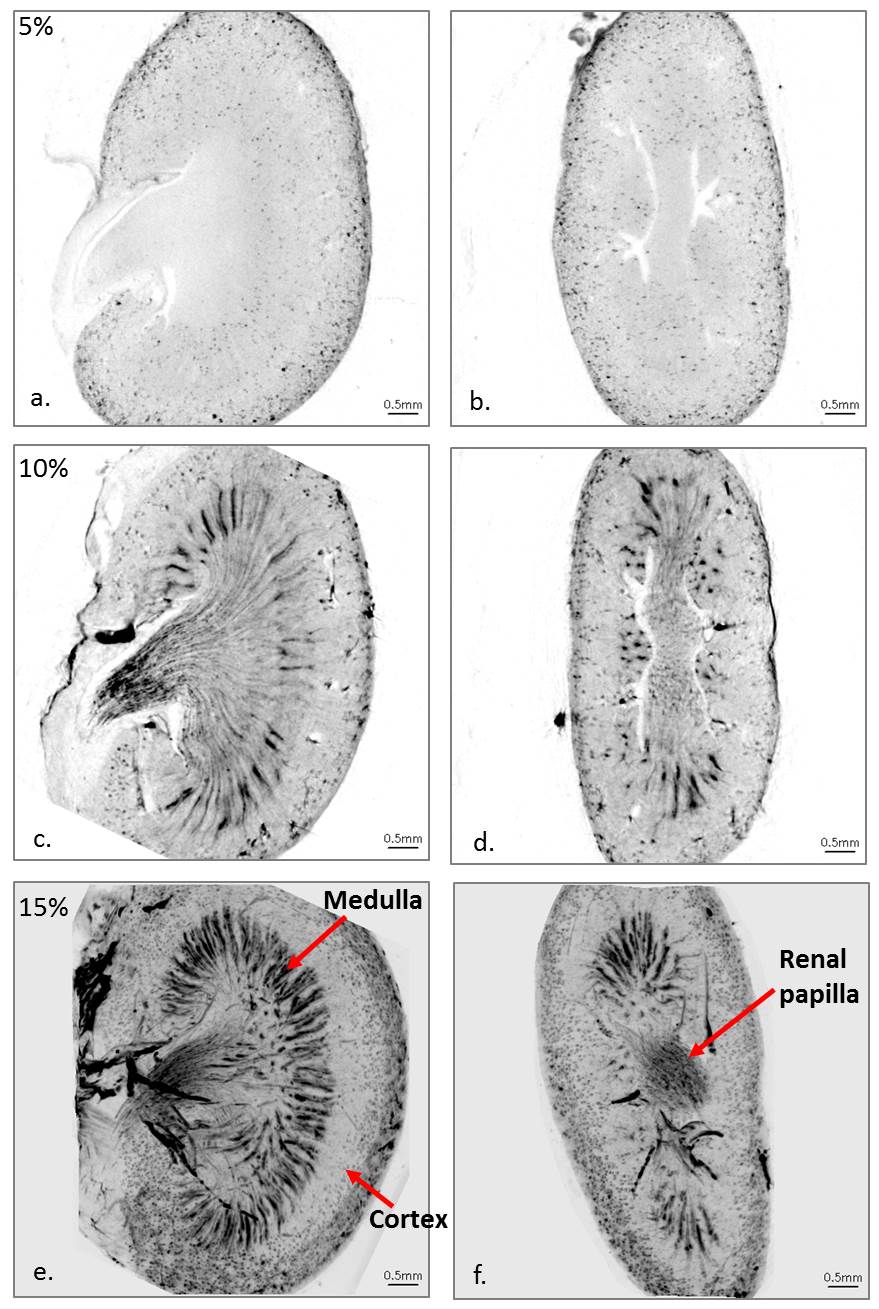
Three healthy, six-week-old, female Balb/c mice were injected with 5 ml/kg of either 5, 10 or 15% India ink (v/v) in saline via the tail vein and was allowed to circulate for 5 minutes before humane killing. One kidney from each mouse was excised and fixed in 70% ethanol in PBS overnight at 4˚C.
The samples were embedded in 0.75% agarose, dehydrated and optically cleared in a graded series of ethanol and 1:2 benzyl alcohol:benzyl benzoate (BABB) solution to reduce scattering attenuation in the tissue. India ink particles passively stain the vasculature by absorbing visible light even after clearing, giving optical contrast. The samples were imaged using a previously characterised optical CT in-house scanner4 with scans consisting of 2000 projections, of matrix size 512×512, acquired over 360˚ rotation with an illumination peak wavelength of 633 nm. Optical CT images were reconstructed via filtered back-projection to a 512×512×512 matrix with isotropic voxel size of 13×13×13 µm.
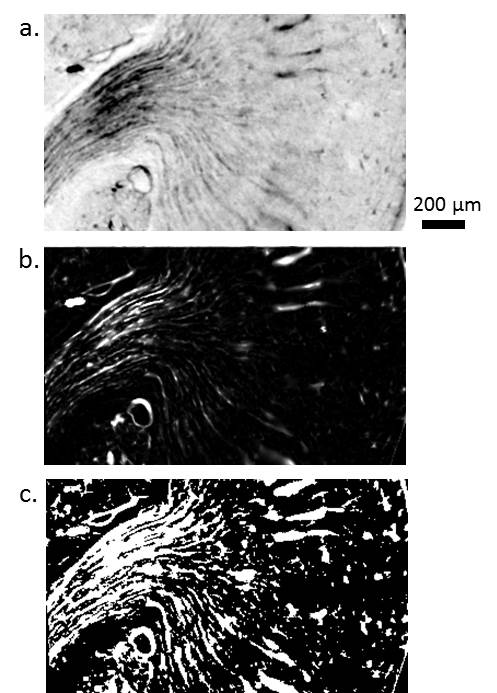
The India ink-stained vasculature was segmented using a vessel enhancement filter, as described by Frangi et al.5 This provides an estimate of the likelihood that a voxel lies within a vessel, by searching for tubular structures. The filter can be tuned to search for vessels of different diameters.
The kidney vasculature of each optical CT image dataset was segmented using a 3D Frangi vessel filter. A blood fraction measurement was developed using the vessel segmentation results. A threshold on the vessel-segmented datasets was used to create binary vessel volume datasets. For a given region of interest, the fractional blood volume (fBV) was calculated as the number of vessel voxels divided by the number of kidney voxels.
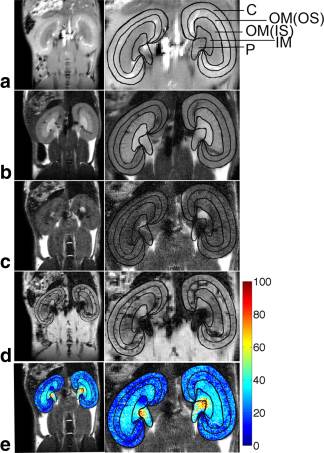
Optical CT fBV measurements were compared to literature values of MRI measured mouse kidney blood volume measurements. Wang et al. reported repeatable measurement of MRI-derived iron-oxide-based relative blood volume (RBV) in 10 six-week-old mice by comparing RBV values in different regions of the kidneys.6 Three of those regions were segmented by hand for the high-resolution optical CT kidney datasets. The optical CT-derived fBV for each of these regions was calculated and compared to the MRI-derived literature values.
Results and Discussion
High-resolution optical CT images of each kidney sample are shown in Figure 1. India ink staining provided excellent visualisation of the different vascular features of the kidney. Frangi filtering of the India ink-stained vessels provided good segmentation of the vasculature, as shown in Figure 2.
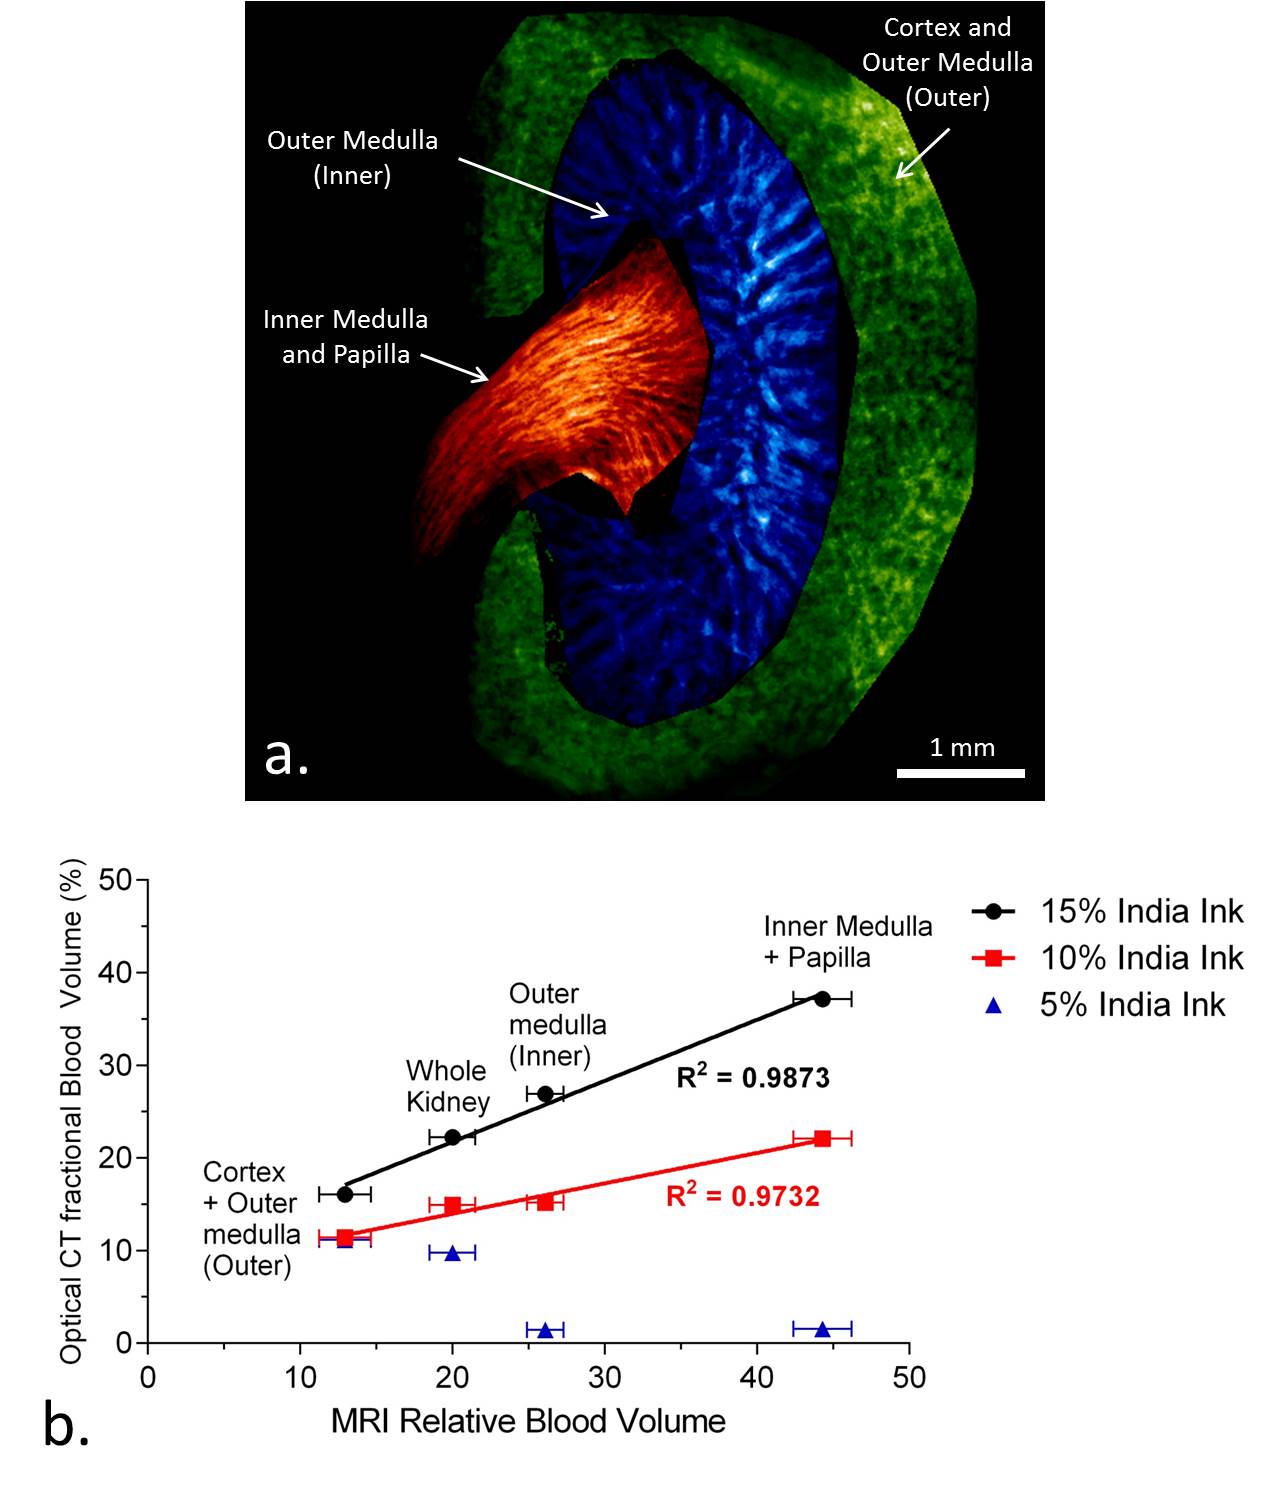
Each optical CT kidney image dataset was segmented into three regions, in a similar fashion to Wang et al. (Figure 3 and 4a). The optical CT fBV for each of these regions, and the entire kidney, were plotted against the mean MRI-derived RBV values, which were averaged over 10 samples (Figure 4b). Significant positive correlations between the MRI and optical CT data were found for the 10% and 15% India ink samples (Pearson’s r=0.9865, p=0.0135 and r=0.9936, p=0.0064 respectively).
In the future more optical CT kidney measurements should be made to validate these correlations, especially as the correlation was dependent on the concentration of India ink used. It was apparent that 5% India ink solution did not achieve staining of the some of the key vascular regions of the kidney, hence there was no correlation with the MRI data. Future experiments will be conducted to assess repeatability and sensitivity of the optical CT fBV measurement, and to assess the optimum India ink solution concentration.
Conclusions
These results show the potential of this method to easily and cheaply assess the murine kidney vasculature in 3D. This technique allows visualisation of the vasculature at high-resolution in 3D before histology, potentially providing a new method to validate functional MRI measurements of the vasculature. This method could be extended to assess vascular response to therapy in the kidney and possibly in pre-clinical tumour models.Acknowledgements
CRUK and EPSRC support to the Cancer Imaging Centre at ICR and RMH in association with MRC and Department of Health C1060/A10334, C1060/A16464 and NHS funding to the NIHR Biomedical Research Centre and the Clinical Research Facility in Imaging.References
[1] Robinson, S. P., Howe, F. A., Griffiths, J. R., Ryan, A. J., and Waterton, J. C. (2007). Susceptibility contrast magnetic resonance imaging determination of fractional tumor blood volume: A noninvasive imaging biomarker of response to the vascular disrupting agent ZD6126. International Journal of Radiation Oncology, Biology, Physics, 69(3):872–879.
[2] Howe, F. A., McPhail, L. D., Griffiths, J. R., McIntyre, D. J., and Robinson, S. P. (2008). Vessel size index magnetic resonance imaging to monitor the effect of antivascular treatment in a rodent tumor model. International Journal of Radiation Oncology, Biology, Physics, 71(5):1470–1476.
[3] O'Connor, James PB, et al. (2016). Imaging biomarker roadmap for cancer studies. Nature Reviews: Clinical Oncology
[4] Doran, Simon J., et al. (2013). Establishing the suitability of quantitative optical CT microscopy of PRESAGE® radiochromic dosimeters for the verification of synchrotron microbeam therapy. Physics in Medicine and Biology, 58(18):6279.
[5] Frangi, A. F., Niessen, W. J., Vincken, K. L., and Viergever, M. A. (1998). Multiscale vessel enhancement filtering. In International Conference on Medical Image Computing and Computer-Assisted Intervention, pages 130–137. Springer.
[6] Wang, F., Jiang, R. T., Tantawy, M. N., Borza, D. B., Takahashi, K., Gore, J. C., Harris, R. C., Takahashi, T., and Quarles, C. C. (2014). Repeatability and sensitivity of high resolution blood volume mapping in mouse kidney disease. Journal of Magnetic Resonance Imaging, 39(4):866–871.
Figures