3796
Dynamic Blood Volume Assessment in Extracranial Tissues using Gadofosveset1Leslie Dan Faculty of Pharmacy, University of Toronto, Toronto, ON, Canada, 2Ted Rogers Centre for Heart Research, Translational Biology & Engineering Program, Toronto, ON, Canada, 3Lab Animal Services, Hospital for Sick Children, 4Anesthesia, University of Toronto, Canada, 5The Edward S. Rogers Sr. Department of Electrical & Computer Engineering, University of Toronto, Toronto, ON, Canada, 6Institute of Biomaterials & Biomedical Engineering, University of Toronto, Toronto, ON, Canada
Synopsis
The ability of blood vessels to modulate vascular tone (i.e. blood volume) is an important normal physiological function, which is compromised in multiple diseases, including diabetes and heart diseases. To date, there is no non-invasive imaging technique to assess dynamic microvascular blood volume response. Herein we present a novel MRI technique to assess vasoactive response in “near” real-time in extra-cranial tissues. We employ a blood-pool agent Gadofosveset (Vasovist) together with a variety of vasoactive gas stimuli. In-vivo results in kidney and liver demonstrate we can visualize dynamic changes in gas-induced blood volume changes, as confirmed on laser Doppler perfusion.
Target Audience
physiologists, radiologists, oncologistsPURPOSE
The integration of MR imaging and a gas challenge stimulus (i.e. application of inspired gases containing different levels of O2 and CO2) is a method for non-invasively assessing cerebral vascular response in both health and disease. The application of this approach to assess extracranial tissue is an emerging research topic1-4, but these studies have shown that T2* and T1 response to gas challenges has multiple contributions in addition to that from blood volume. In this study, we demonstrate a novel technique using long-life blood pool agent Gadofosveset (Vasovist) combined with varying degrees of hypercapnia and hypoxia, for specific monitoring of vasoactive perfusion changes in extracranial tissues.Methods
This study was approved by our institutional animal care committee. A system consisting of a computer-controlled gas mixer, an MR-compatible isoflurane vaporizer and ventilator was built to control the delivery of precise levels of gases to small animals. Eight female adult Sprague Dawley rats (Charles River Laboratories) weighing 250-300g were anesthetized on 5% isoflurane, intubated with a 14-gauge angiocatheter, and transferred to a water blanket maintained at 38°C. An endotracheal tube was connected to the gas delivery system, and the animal was maintained on 2% isoflurane, resting supine in an 8-channel wrist coil and imaged on a 3-Tesla scanner (Achieva 3.0 T TX, Philips Medical Systems). Vasovist (0.3mmol kg-1) was administered via the tail vein, and 10 min sequential gas challenges beginning with normoxia (21% O2) were applied. Four different types of gas challenge were studied: extreme hypercapnia (20% CO2), mild hypercapnia (5% CO2), hypoxia (12% O2), and hypercapnic hypoxia (20% CO2 +12%O2). Four animals were used to study each level of gas stimulus. Coronal 3D T1-weighted spoiled-gradient echo fat-suppressed images were acquired: TR=3.73 ms, TE=1.85 ms, FA=20°, NSA=3, FOV=100mm, ten 3-mm slices, 0.7x0.7 mm in-plane was acquired at 2 minute intervals for each gas challenge. MRI data was analyzed using in-house software in Matlab (v.8.3). Regions of interest were outlined on the liver, kidney cortex, and paraspinal muscle to obtain mean signal intensity values. Changes in signal intensity from baseline were compared across animals using one-way ANOVA and post-hoc Tukey-Kramer tests performed at the 95% confidence level. Real-time relative perfusion measurements were obtained in the liver and kidney cortex on seven female rats in response to the gas challenge regime using a laser Doppler perfusion (LDP) (OxyFlo, Oxford Optronics Ltd., Oxford, UK) fiber-optic system. The fiber optic probes were inserted below the renal capsule to measure renal cortical perfusion and between the lobes of the liver to measure liver blood perfusion.Results
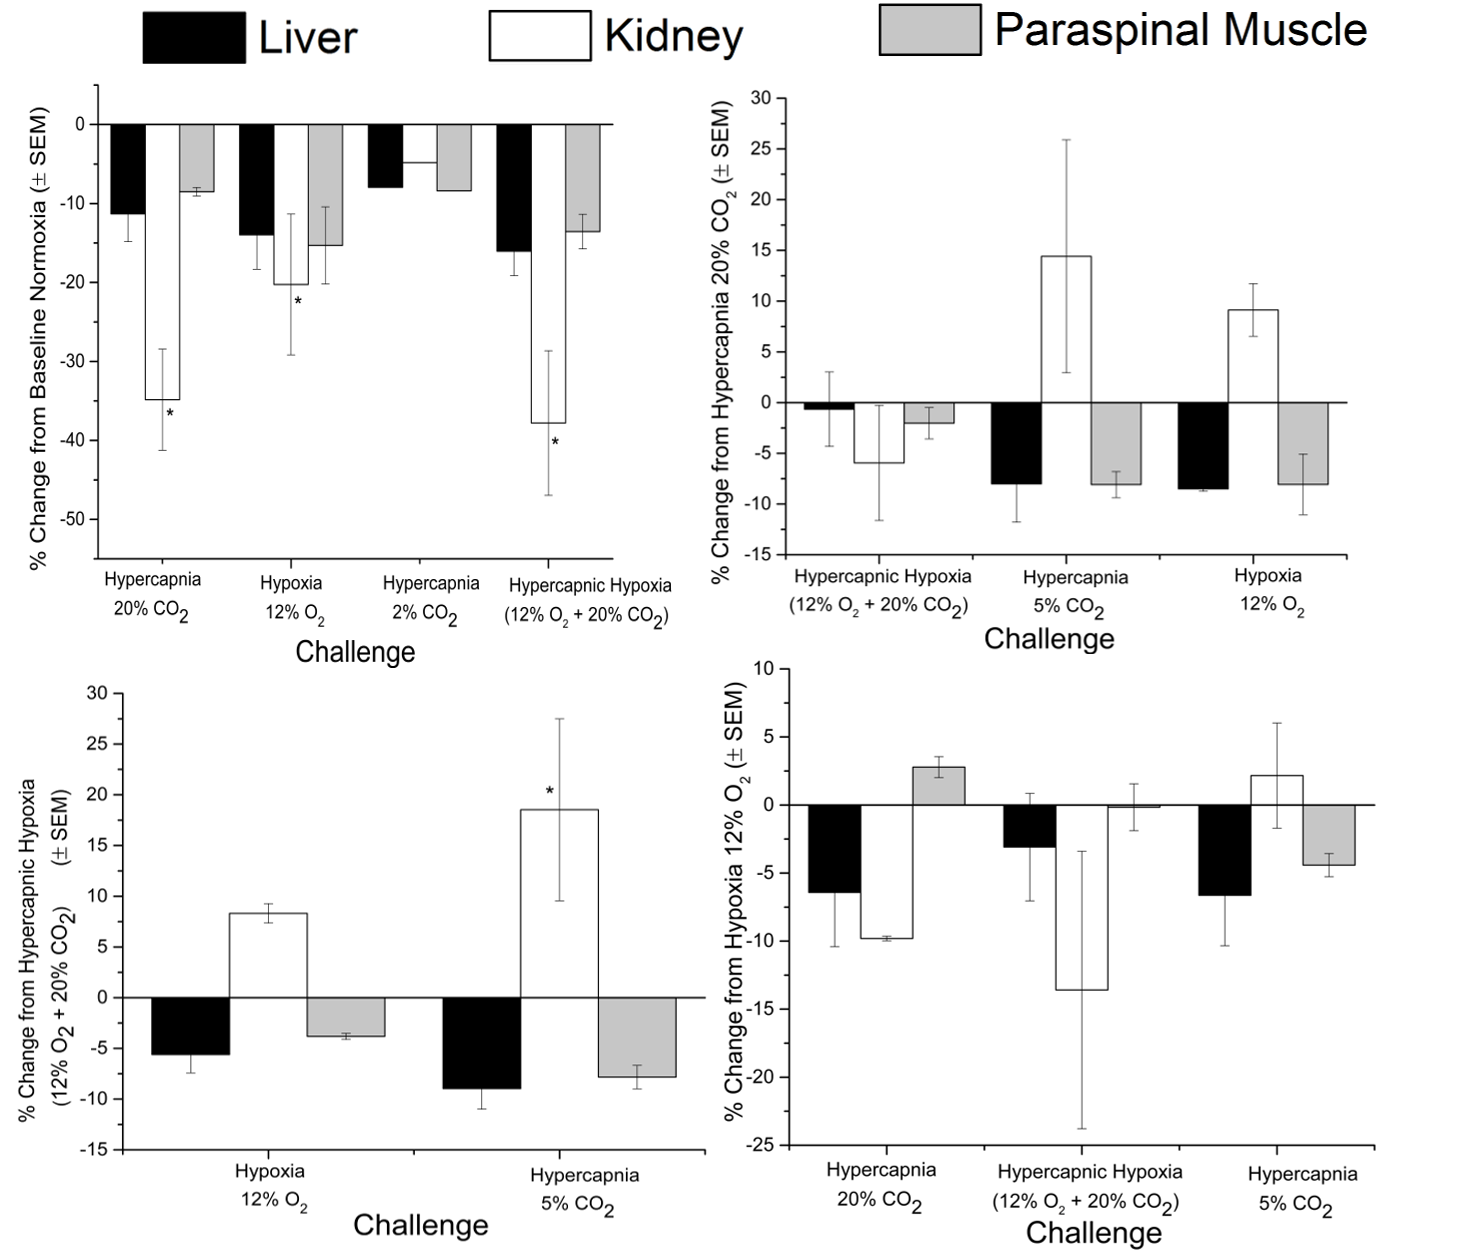
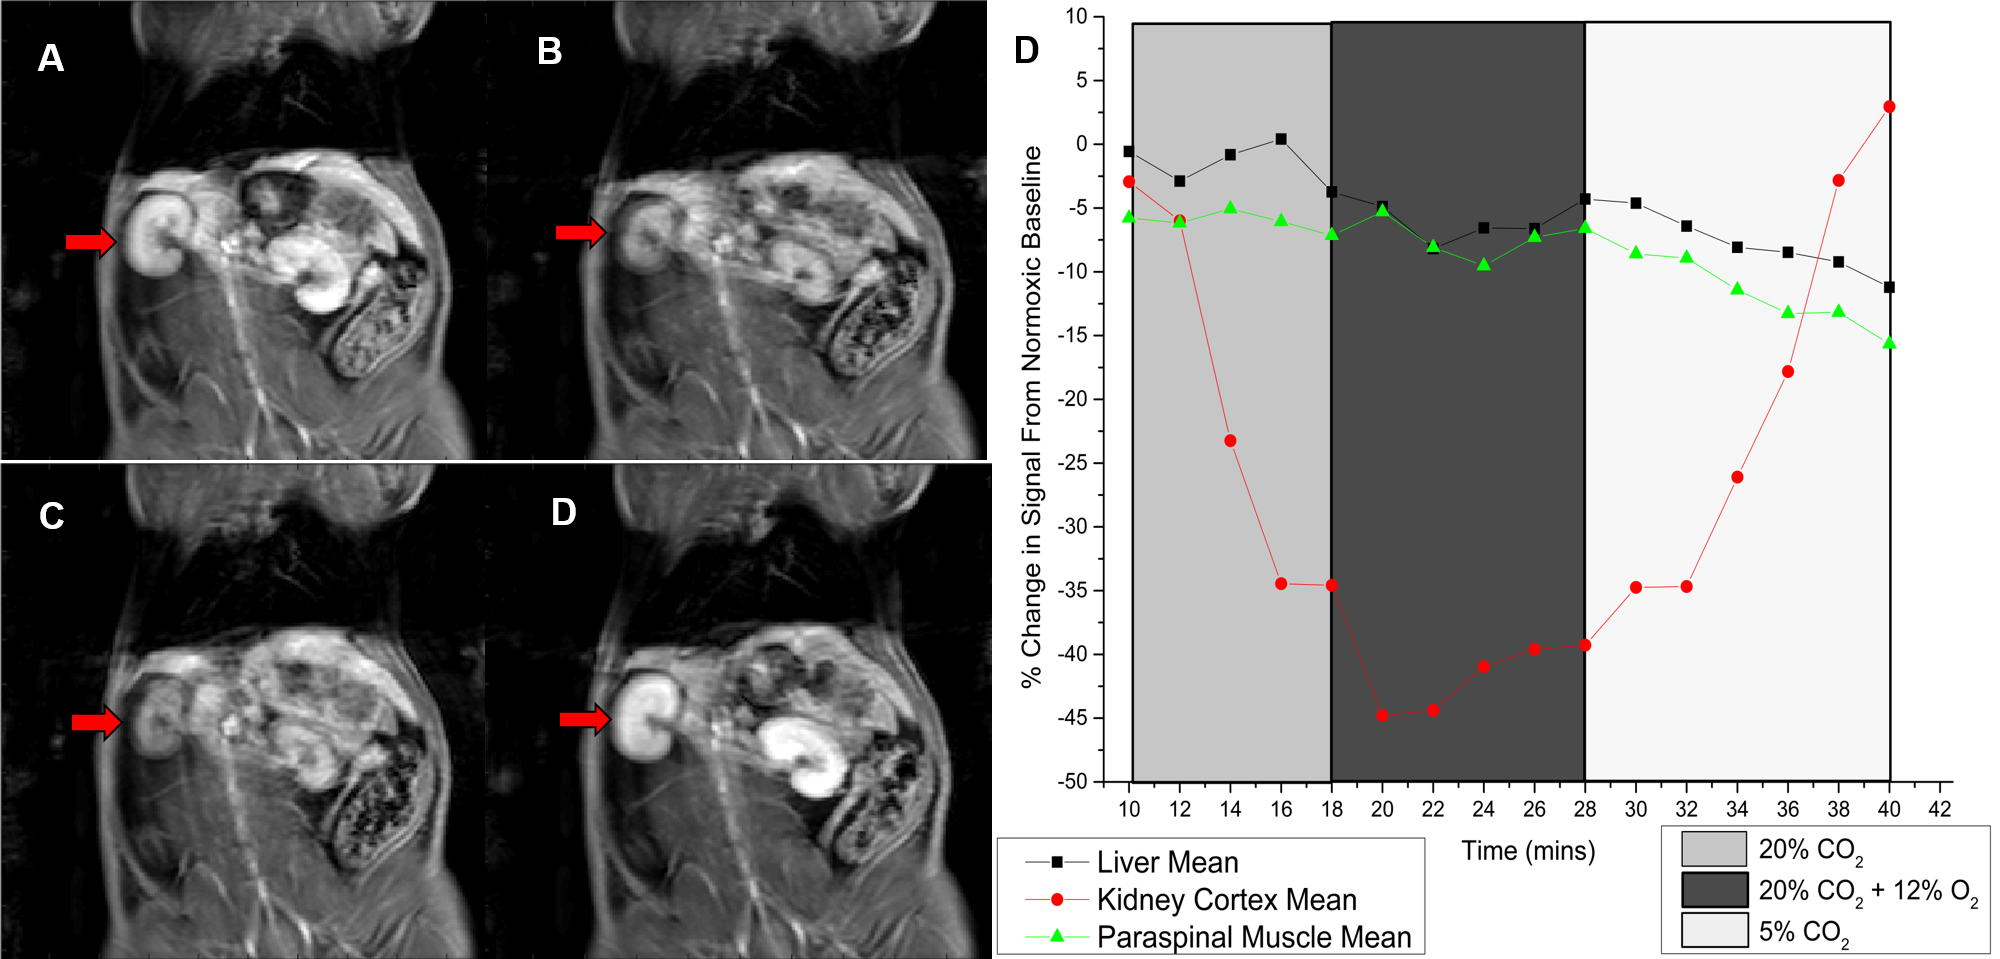
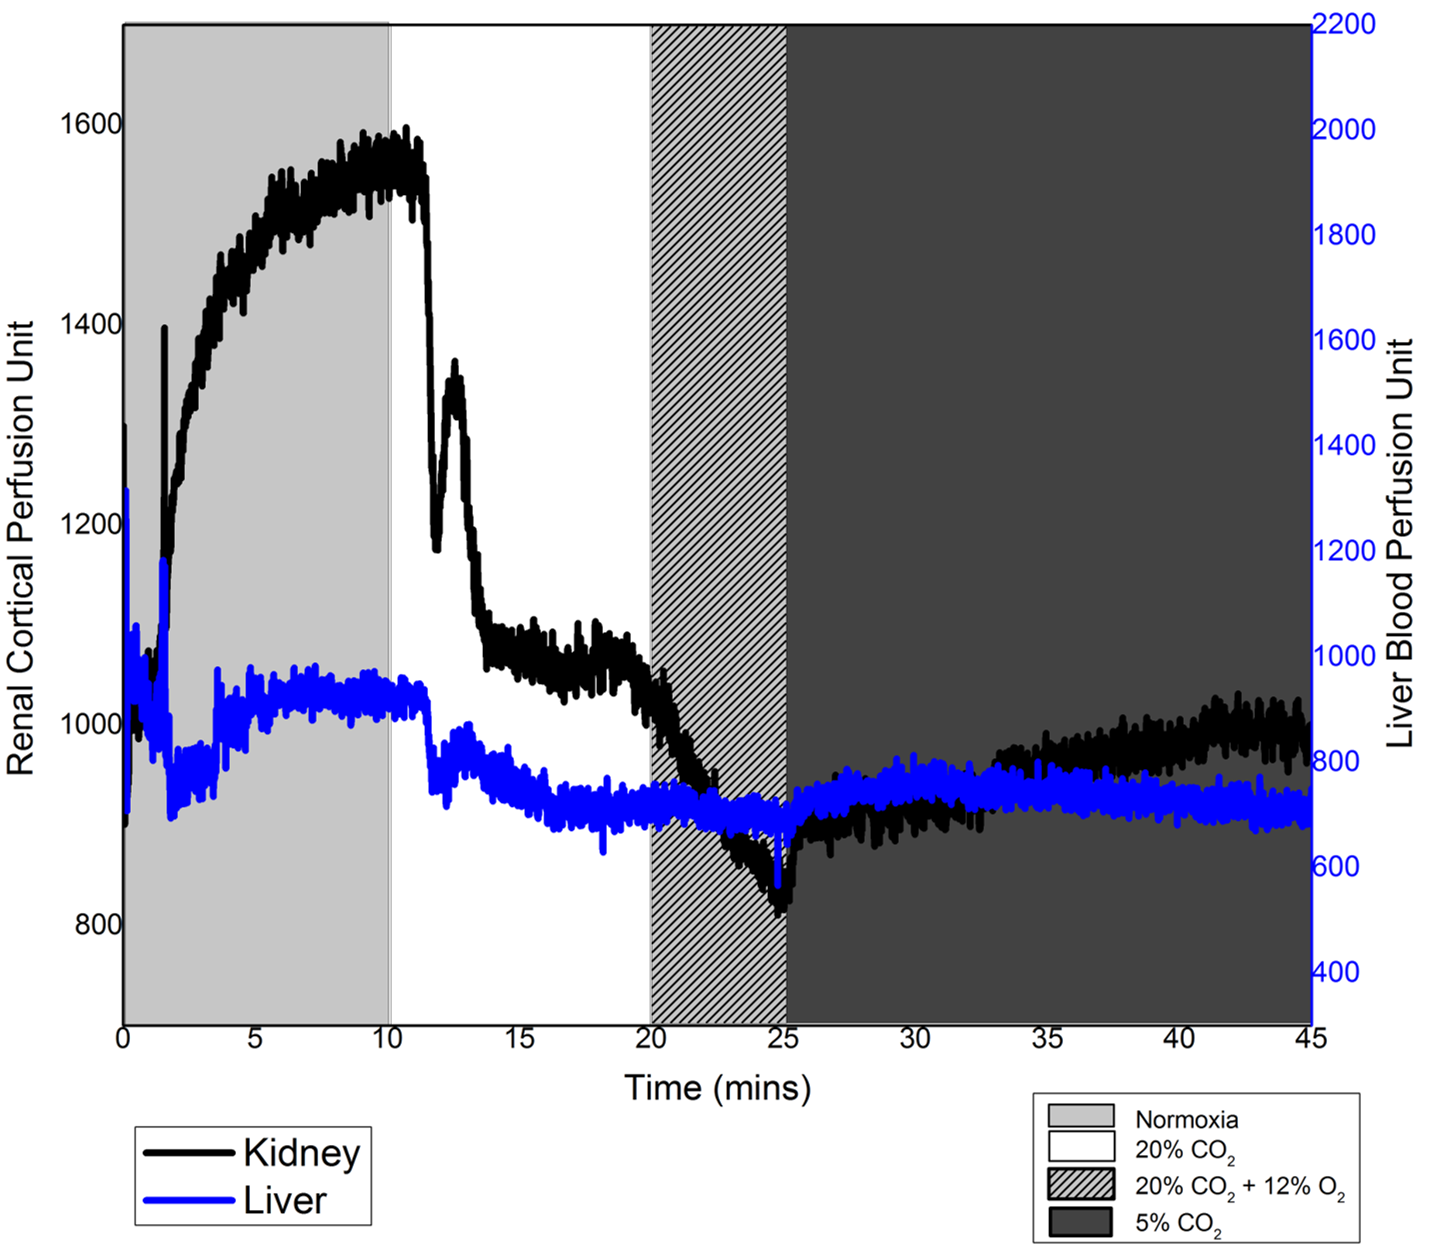
Fig. 1 shows relative changes in T1 signal in different abdominal tissues across all animals for all gas challenge levels. As seen in Fig. 1, T1 signal decreased consistently for hypercapnic, hypoxic, and hypercapnic hypoxic challenges when compared to baseline, with significance seen in the kidney cortex. The hypercapnic reduction was sustained with addition of a hypercapnic hypoxic stimulus, and these trends either from hypercapnia or hypercapnic hypoxia were reversed upon the administration of mild hypercapnia (5% CO2). Fig. 2 shows anatomical images of the kidney and changes in signal intensity in all tissues in response to one of the gas sequences. This figure exemplifies the large changes in signal obtained, particularly in the kidney cortex, for visual real-time monitoring of vasoactive response. The underlying perfusion changes observed on MRI were corroborated with LDP measurements (Fig. 3).Discussion
Using a long-life blood pool agent, we are able to visualize on MRI active modulation of blood volume in the kidney and liver. The hypercapnic and hypercapnic hypoxic mediated reduction in signal intensity and perfusion is attributed to the vasoconstrictive effects of extreme levels of CO2 and O2 on the renal vasculature, whilst mild hypercapnia resulted in vasodilatation. Comparison between MR and LDP showed good agreement. For example, as seen in Figs. 2 and 3, extreme hypercapnia resulted in a 35% reduction in the renal cortical signal intensity, in good agreement with the 31% reduction in relative perfusion seen on LDP. In contrast, mild hypercapnia led to vasodilatation, confirmed on LDP and seen as signal enhancement on MRI.Conclusion
We have presented a novel imaging approach for the real-time assessment of vasoactive response and, thereby, microvascular health of tissues. This approach may be extended to other imaging modalities for the investigation of microvessel-related diseases.Acknowledgements
T. Ganesh is supported by the Ontario Graduate Scholarship and NSERC PGS-D. H-L. M. Cheng is funded by the Heart & Stroke Foundation of Canada, NSERC Discovery Awards, the Canada Foundation for Innnovation, and the Ontario Research Funds.References
1. Winter JD et al. Normal tissue quantitative T1 and T2* MRI relaxation time responses to hypercapnic and hyperoxic gases. Acad Radiol 201 1 ; 1 8(9);1 1 59-1 1 67.
2. O’Connor JP et al. Organ-specific effects of oxygen and carbogen gas inhalation on tissue longitudinal relaxation times. Magn Reson Med 2007; 58(3):490-496.
3. Pohlmann A et al. Detailing the relation between renal T2* and renal tissue pO2 using an integrated approach of parametric magnetic resonance imaging and invasive physiological measurements. Invest Radiol 201 4;49(8):547-560.
4. Ganesh T, Estrada M, Duffin J, Cheng HL. “T2* and T1 assessment of abdominal tissue response to graded hypoxia and hypercapnia using a controlled gas mixing circuit for small animals,” Journal of Magnetic Resonance Imaging 44(2), 305-316, 2016.
Figures