3795
Quantitative, semiautomatic comparison of ferumoxytol and gadoteridol enhancement in treated glioma patients1Oregon Health and Science University, Portland, OR, United States, 2National Institute of Clinical Neurosciences, Budapest, Hungary, 3University of Pécs, Pécs, Hungary
Synopsis
Ferumoxytol is a nano-sized iron oxide particle approved for iron replacement therapy and may be used off label as an MRI contrast agent. While gadolinium-based contrast agents leak into the brain parenchyma where the blood brain barrier is not intact several minutes after administration, ferumoxytol remains intravascular for hours due to its high molecular weight, enabling excellent vascular visualization, with visible parenchymal enhancement peaking 24 hours after administration. In this study, we compared ferumoxytol T1 enhancement to standard of care gadoteridol enhancement with a quantitative method, which is an important step to develop ferumoxytol as an alternative MR imaging agent.
Purpose
Besides being associated with the development of nephrogenic systemic fibrosis in patients with renal dysfunction 1, gadolinium may deposit in neural tissue after multiple administrations, altering signal intensity in the dentate nucleus and the basal ganglia on pre-contrast T1-weighted scans 2-4. The issue of contrast agent safety is clinically relevant, and therefore the performance of possible alternative contrast agents should be examined. Ferumoxytol, a possible alternative, shows delayed hyperintense enhancement on T1-weighted images which appears visually similar to gadoteridol enhancement 5. However, it is still unknown whether or not ferumoxytol is a viable alternative contrast agent to gadoteridol. The purposes of this study were to quantitatively compare ferumoxytol T1 enhancement to standard of care gadoteridol enhancement with an objective, semiautomatic method and to examine whether ferumoxytol enhancement changes similarly to gadoteridol enhancement in response to various treatments.Methods
206 sets of post-gadoteridol and 24 hours post-ferumoxytol T1-weighted scans from 58 high grade glioma patients (37 males, 21 females, mean age 51.32±13.25 years) were analyzed. All MRI scans were performed on a 3T clinical scanner. Scans were categorized by the treatment the patients received before scan (pre-chemoradiation, within 90 days from chemoradiation, >90 days from chemoradiation, post-bevacizumab).
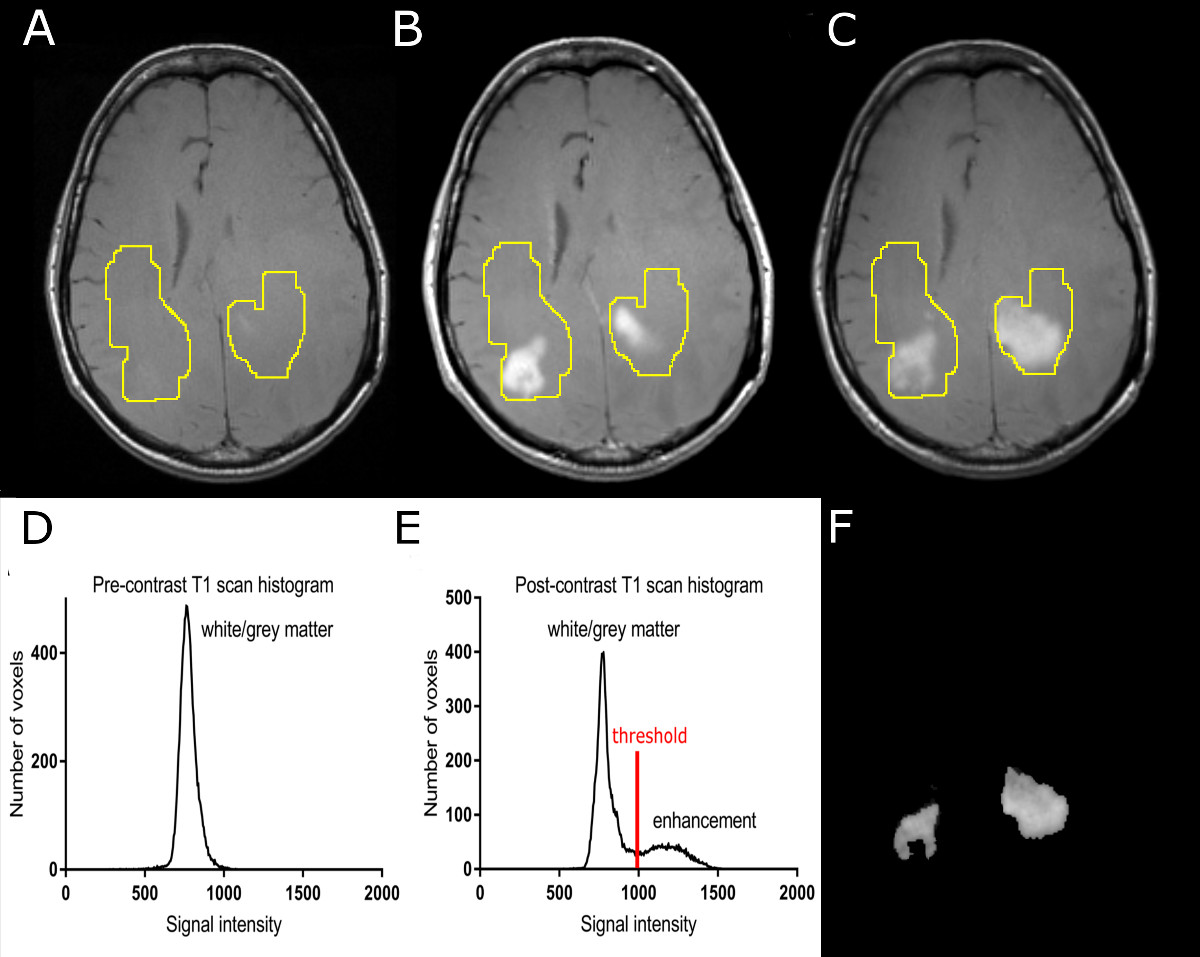
Image analysis: Post-gadoteridol and post-ferumoxytol images were co-registered to pre-contrast scans. Enhancing tumors were segmented with the following semiautomatic method (Figure 1): the same region of interest (ROI) was applied on pre-contrast, post-gadoteridol, and post-ferumoxytol scans. This ROI was defined to cover all enhancing voxels with both contrast agents on the overlayed, co-registered scans, and also included some normal appearing white and grey matter. Next, signal intensities from the ROIs were placed on voxel count- signal intensity histograms which resulted in a high peak representing normal white and grey matter signal intensity and a low peak including higher signal intensity values representing enhancing voxels on the post-contrast scans. After thresholding post-contrast scans, enhancing voxels remained while non-enhancing regions were excluded from resulting images Enhancement volumes and signal intensities normalized to white matter were calculated.
Statistical analysis: To satisfy the assumption of normal distribution, the cube root of volumes (D) was used in all statistical analyses. For enhancement D and signal intensities, Pearson’s correlation was used to assess the association between the two contrast agents and a linear mixed effect model was used to compare the difference between the two contrast agents using data from all time points, as well as within different treatment groups. Within subject relative difference of ferumoxytol and gadoteridol enhancement volumes and signal intensities were compared in patients before and after bevacizumab (n=26), and in patients before and after steroid (n=26). P<0.05 was considered statistically significant.
Results
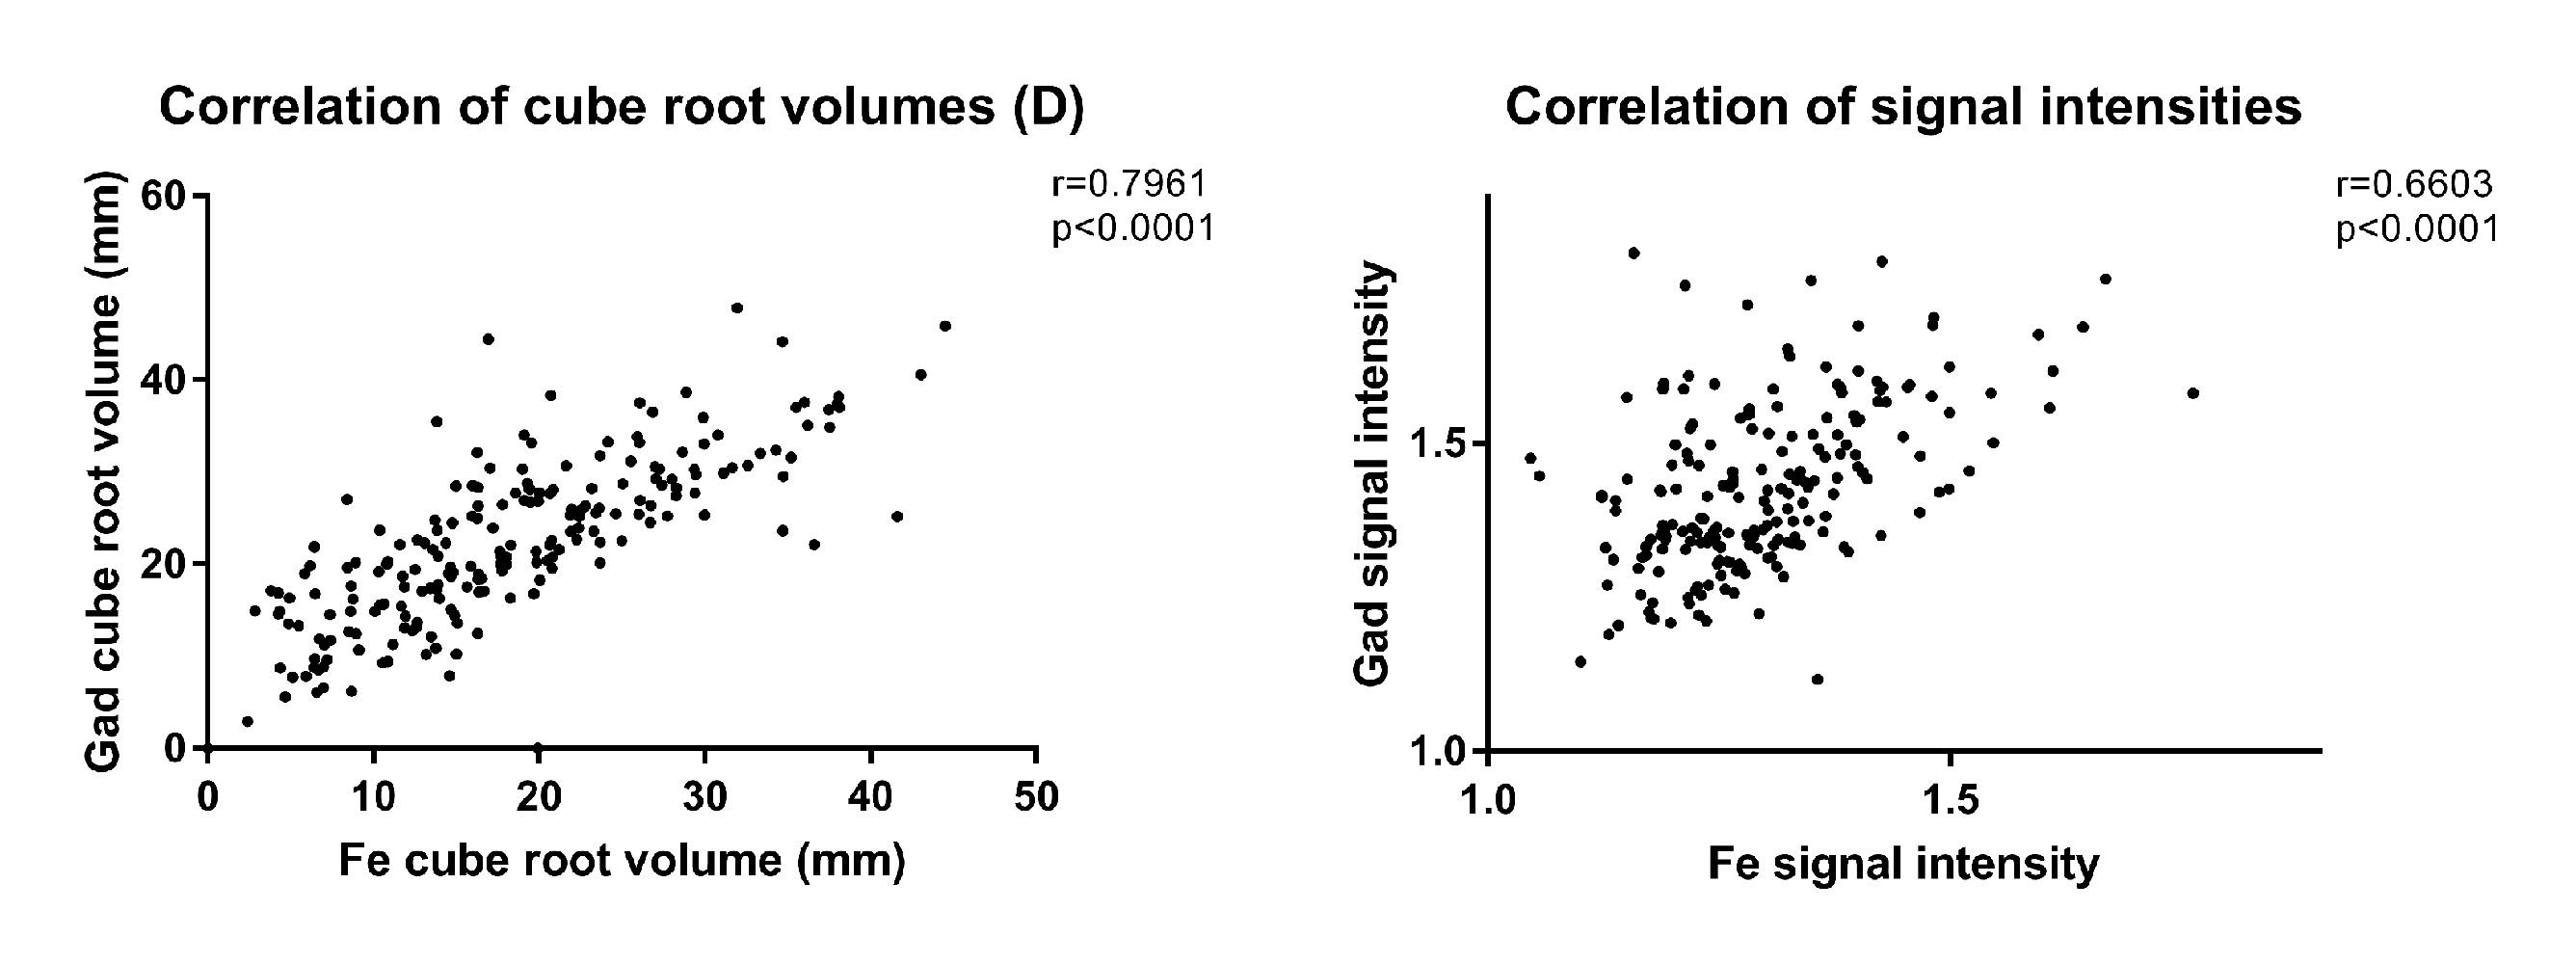
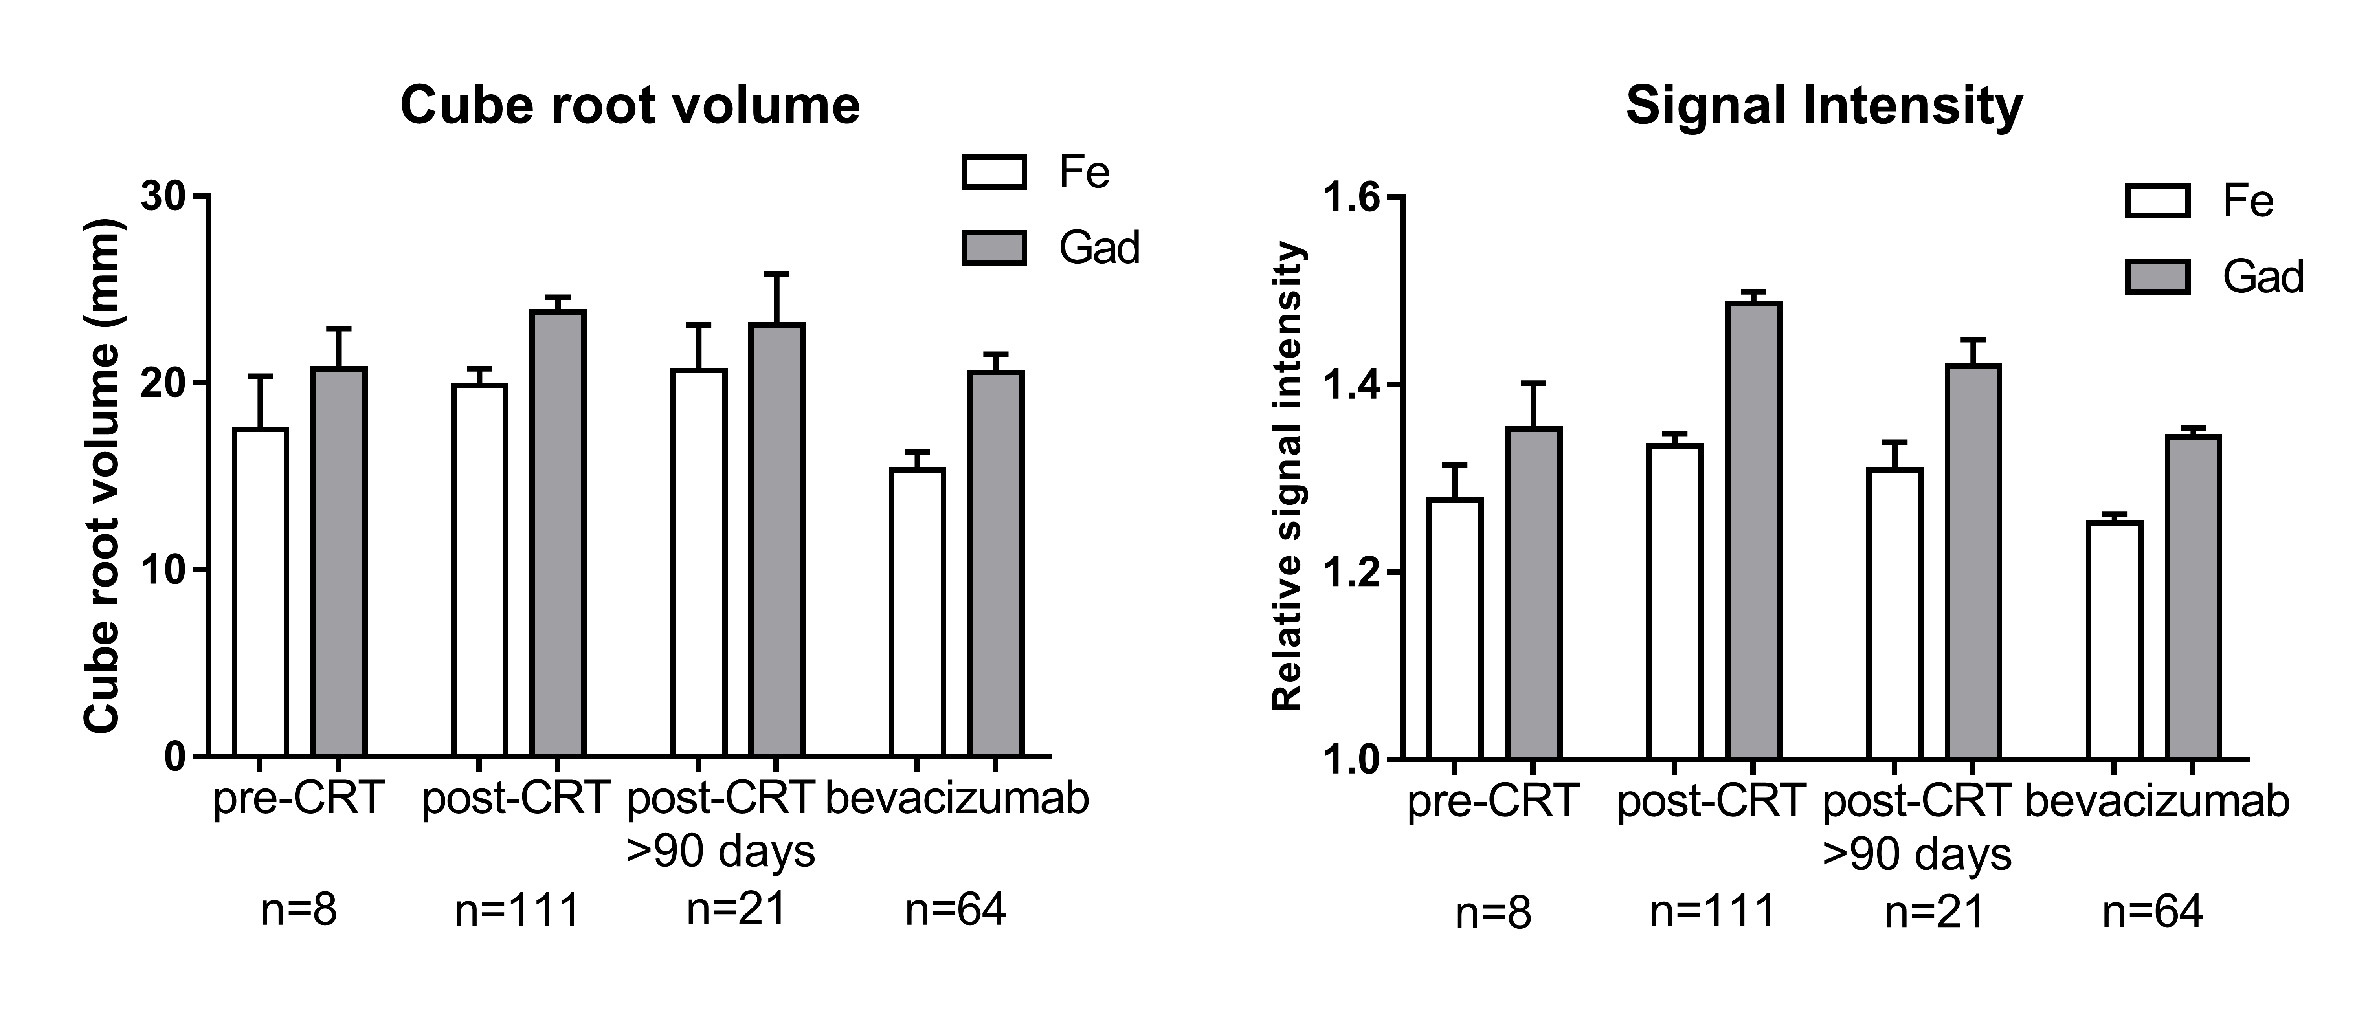
There was a strong correlation in enhancement D (r=0.7961, p<0.0001) and in signal intensities (r=0.6603, p<0.0001) between the two contrast agents (Figure 2). When compared to gadoteridol, ferumoxytol D was 18.71% lower, while signal intensity was 8.20% lower (p<0.0001). The relative differences between the two contrast agents’ D and signal intensity were not significantly different in various treatment groups (p>0.05) (Figure 3). Relative difference in D and signal intensity did not change significantly in response to bevacizumab (p=0.6303 and p=0.0576, respectively) or to steroid (p=0.1551, p=0.0546) in the within patient comparison.Conclusions
The strong correlation between the two contrast agents’ enhancement size and signal intensity and their similar behavior in response to therapy makes ferumoxytol a promising option for visualizing CNS pathologies. Enhancement size and signal intensity are affected by the timing of the scan and the administered contrast agent dose, therefore differences in enhancement size and signal intensity may have originated from inequivalent timing or dosing of ferumoxytol compared to gadoteridol. Objectively comparing delayed enhancement to standard of care post-contrast images with a commonly used ferumoxytol dose and the typical 24 hours post-injection scan timing is an important step towards the optimal calibration of ferumoxytol imaging and the development of ferumoxytol as an alternative MR imaging agent.Acknowledgements
This work was supported by a VA Merit Review Grant, National Institutes of Health grants NS44687, NS53468, NS076353, CA137488, and CA137488-15S1, and a National Cancer Institute SAIC-Frederick Subcontract 26XS293. Funding also provided by the Walter S. and Lucienne Driskill Foundation.References
1. Grobner, T. and F.C. Prischl, Gadolinium and nephrogenic systemic fibrosis. Kidney Int, 2007. 72(3): 260-4.
2. Kanda, T., T. Fukusato, M. Matsuda, et al., Gadolinium-based Contrast Agent Accumulates in the Brain Even in Subjects without Severe Renal Dysfunction: Evaluation of Autopsy Brain Specimens with Inductively Coupled Plasma Mass Spectroscopy. Radiology, 2015: 142690.
3. Kanda, T., M. Osawa, H. Oba, et al., High Signal Intensity in Dentate Nucleus on Unenhanced T1-weighted MR Images: Association with Linear versus Macrocyclic Gadolinium Chelate Administration. Radiology, 2015: 140364.
4. McDonald, R.J., J.S. McDonald, D.F. Kallmes, et al., Intracranial Gadolinium Deposition after Contrast-enhanced MR Imaging. Radiology, 2015: 150025.
5. Weinstein, J.S., C.G. Varallyay, E. Dosa, et al., Superparamagnetic iron oxide nanoparticles: diagnostic magnetic resonance imaging and potential therapeutic applications in neurooncology and central nervous system inflammatory pathologies, a review. J Cereb Blood Flow Metab, 2010. 30(1): 15-35.
Figures