3793
Vector field perfusion imaging1Radiology, Weill Cornell Medicine, New York, NY, United States, 2Weill Cornell Medicine, 3Radiology, Weill Cornell Medicine, New York, NY, 4Biomedical Engineering, Cornell University, Ithaca, NY
Synopsis
A vector field perfusion (VFP) approach is proposed to quantify three dimensional blood flow in tissue. The traditional lumped-element Kety equation for characterizing perfusion is fundamentally flawed with the indetermination of arterial input function. The standard continuity equation based on velocity vector field is proposed for fitting tomographic data. Preliminary analysis of dynamic contrast enhanced MRI and arterial spin labelled MRI of the brain demonstrate the feasibility of this VFP approach.
Introduction
Monitoring blood passage through organ tissue or perfusion
is critical for managing stroke, heart attack, and cancer. Perfusion quantification
has traditionally been modeled by using the
phenomenological lumped element Kety’s equation, which ignores the delay,
dispersion and 3D distribution of tracer in tissue. This causes large errors
and poor reproducibility. In this abstract, we develop a biophysically based
alternative approach called Vector Field Perfusion (VFP). Preliminary results
in dynamic contrast enhanced MRI and arterial spin labelled (ASL) MRI show the
feasibility of this approach.Theory
Tissue perfusion is described
using a velocity vector field that satisfies
the mass preservation equation without arterial input function
$$\partial c(\mathbf{r},t)/\partial t=-\nabla\cdot c(\mathbf{r},t)\mathbf{u}(\mathbf{r}) \qquad [1]$$
It is estimated from 4D image data in a manner similar to the optical flow method in computer vision1. High spatial and temporal resolution CT and MRI data is fit against Eq $$$[1]$$$ in a Bayesian approach. When image data decay at a known rate $$$\beta$$$, Eq $$$[1]$$$ can be extended to
$$\partial c(\mathbf{r},t)/\partial t=-\beta c(\mathbf{r},t) -\nabla\cdot c(\mathbf{r},t)\mathbf{u}(\mathbf{r}) \qquad [2]$$
For ASL $$$\beta = 1/T_1$$$. The vector flow $$$\mathbf{f}$$$ into a voxel with cross sectional areas $$$a_x, a_y$$$ and $$$a_z$$$ is then
$$\mathbf{f}(\mathbf{r}) = a_x u_x(\mathbf{r})\mathbf{e}_x + a_y u_y(\mathbf{r})\mathbf{e}_y + a_z u_z(\mathbf{r})\mathbf{e}_z \qquad [3]$$
The traditional Kety flow (ml/100g/min) is obtained as
$$f_K = \|\mathbf{f}\|CBV(100/\rho v)^{2/3} \qquad [4]$$
Here $$$\rho=1.08g/ml$$$ is tissue density, the cross-section scaling factor $$$(100/\rho v)^{2/3}$$$ for 100g tissue, $$$CBV$$$ the cerebral blood volume and $$$v$$$ the voxel volume.
Materials
Two types of 4D MRI data were acquired:
Pseudo-continuous ASL (PCASL) 3D FSE data was acquired in 3 healthy subjects using a GE MR750 3T scanner (GEHC, Milwaukee, WI) using a 8 interleave stack of spiral, 512 points/leaf, ±62.5 kHz BW h, 10.5 ms TE, 1.9x1.9x4 mm3 voxel size, 128x128x36 matrix, three signal averages, ~5 min scan time. Five post-label delay times were acquired (1025, 1525, 2025, 1525, 3025 ms). Cerebral blood flow (CBF) maps (ml/100 g/min) were generated using FuncTool (GEHC).
2) MR Perfusion (MRP) Dynamic 3D flow compensated golden ratio stack-of-spiral gradient echo data was acquired in 5 healthy subjects at 1.5T (GEHC) with an 8-channel head coil, 4 echoes, stack-spirals, TR/TEfirst/TElast = 34.3/0.7/25.3 ms, BW = ± 125 kHz, FA = 15˚, matrix size 200×200×22, FOV 22cm, ~2.5 min scan time and 3ml/s injection of 0.1mmol/kg gadobutrol. 3D R2* maps were reconstructed every 748ms using TRACER. PCASL was obtained before contrast.
For each 4D data set, a cumulative integration across time was done to reduce noise sensitivity and the time intensity curve for each voxel normalized such that the final frame was equal to 1 for each voxel. Using a Bayesian formulation, the resulting 4D data were fit against Eq $$$[2]$$$ with an added gradient based regularization term, which was done using conjugate gradient.. Arterial CBV was set to 0.74%3.
Results
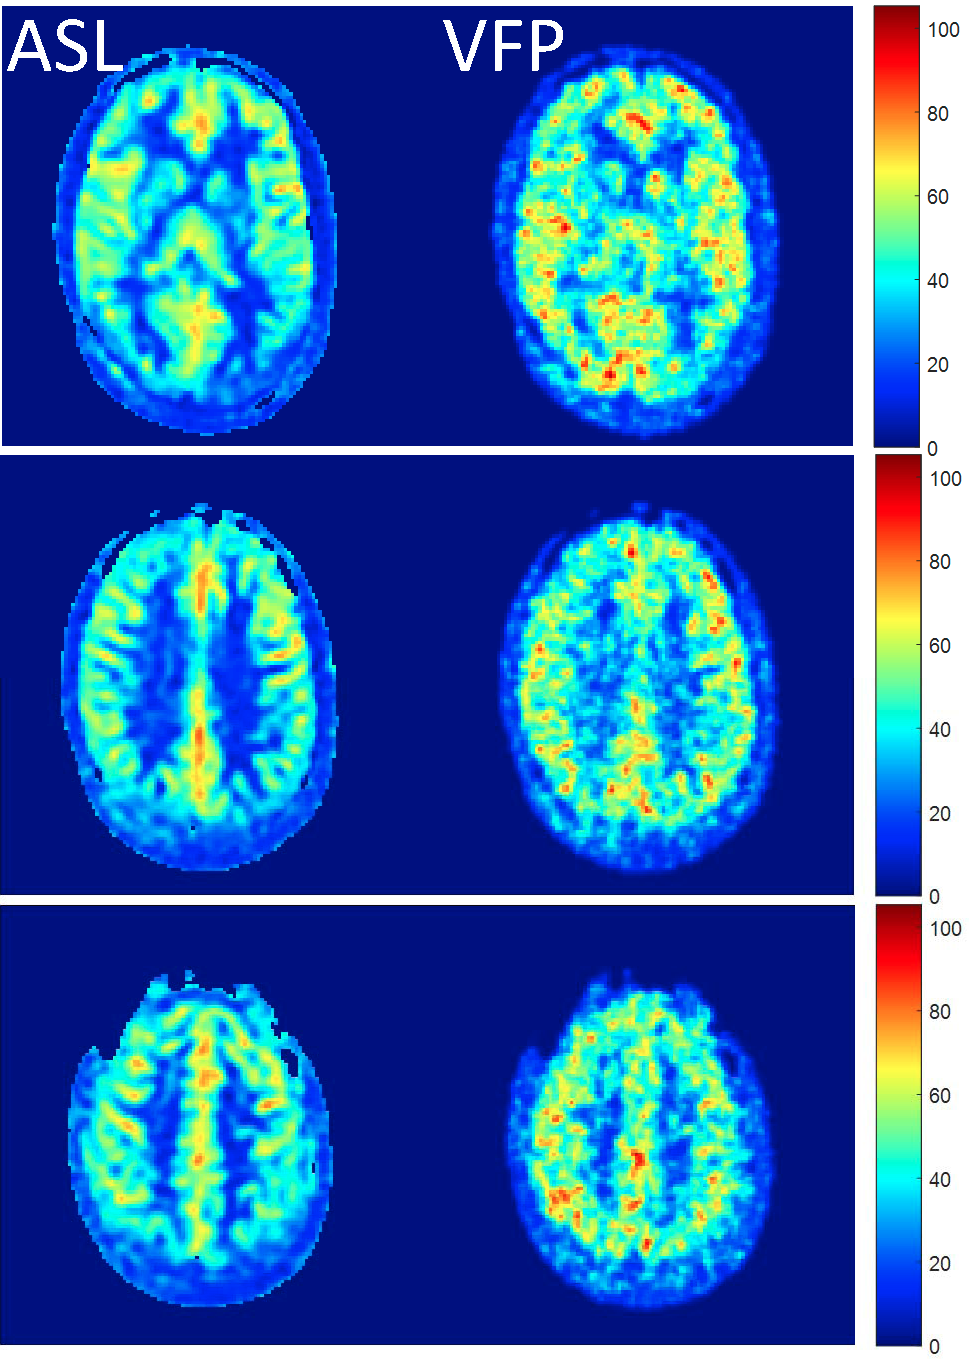
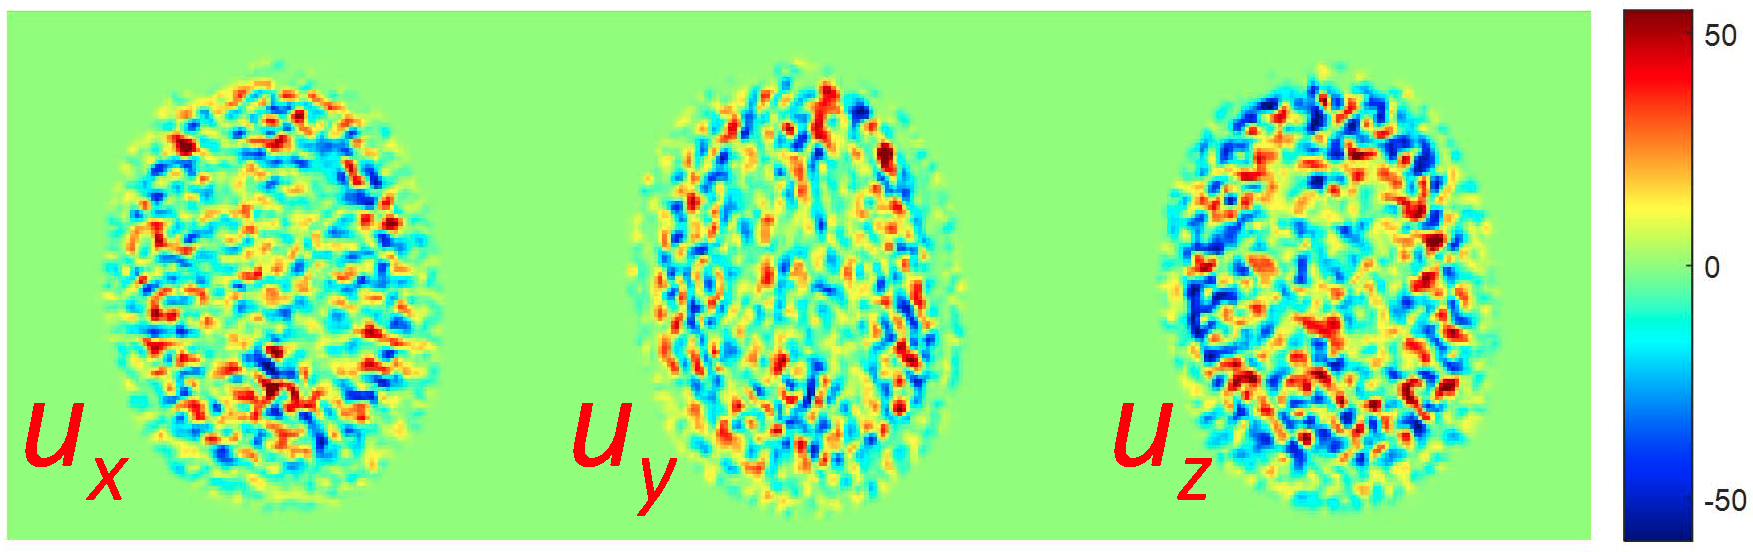
Figure 1 shows a comparison between ASL based CBF map and VFP based MD-ASL derived flow map in one healthy subject. Good anatomical agreement and comparable flow values are observed across the brain. Across the 3 subjects, average gray matter flow in was 46.10 ml/100g/min for ASL vs 51.89 ml/100g/min for VFP. Figure 2 shows the three spatial components of the velocity vector field in a single slice in the same subject. Similar results were obtained for MRP data.Discussion and Conclusion
The preliminary data presented here show the feasibility of using optical flow like optimization problems for computing velocity vector fields in vivo. From multiple modalities (MD ASL MRI, MRP and CTP) a velocity and flow map can be computed across the tissue of interest. It has been recognized that tissue perfusion should be directional3,4, but these attempts have been limited to Kety’s approach5. A more realistic model is proposed here that quantifies the distributional tissue perfusion by decoding space-time resolved imaging data that captures tracer transport through the tissue. By using a Bayesian approach, biological priors can be added in a straightforward manner.Conclusion
A novel method to analyze tissue transport properties is presented by computing a velocity vector field from 4D image data, enabling tissue perfusion quantification without arterial input function.Acknowledgements
No acknowledgement found.References
1. Horn BKP, Schunck BG. Determining Optical-Flow. Artif Intell. 1981;17(1-3):185-203. doi: Doi 10.1016/0004-3702(81)90024-2.
2. An H1, Lin W. Cerebral venous and arterial blood volumes can be estimated separately in humans using magnetic resonance imaging. Magn Reson Med. 2002 Oct;48(4):583-8.
3. Thacker NA, Scott ML, Jackson A. Can dynamic susceptibility contrast magnetic resonance imaging perfusion data be analyzed using a model based on directional flow? J Magn Reson Imaging. 2003;17(2):241-55
4. Frank LR, Lu K, Wong EC. Perfusion tensor imaging. Magn Reson Med. 2008;60(6):1284-91
5. Sourbron S. A tracer-kinetic field theory for medical imaging. IEEE transactions on medical imaging. 2014;33(4):935-46. doi: 10.1109/TMI.2014.2300450. PubMed PMID: 24710162
Figures