3792
Measurement of R2 dispersion profiles using Fast Field Cycling MRI1IR4M (Imagerie par Résonance Magnétique Médicale et Multi-modalités), Univ. Paris-Sud, CNRS, UMR8081, Université Paris-Saclay, Orsay, France, 2Aix Marseille Univ., CNRS, CRMBM UMR 7339, Marseille, France
Synopsis
Fast Field Cycling (FFC) MRI enables rapid and precise relaxometry measurements as a function of magnetic field B0. Up to now, it was possible to measure longitudinal R1-NMRD profiles and to generate innovative R1-dispersive contrasts. However, the ability to measure transverse R2-NMRD profiles has still to be investigated. Here, a spin-echo based FFC sequence is developed to measure R2-dispersion, and is applied to ferritin and Gd-DOTA in the range 1.15 to 1.85 T. It is shown that measurements of R2 dispersion could be obtained accurately with the FFC-MRI technology.
Introduction
Fast Field Cycling (FFC) MRI1 enables rapid and precise relaxometry measurements as a function of magnetic field B0. State-of-the-art FFC systems generate, within milliseconds, magnetic field offsets of up to ±500mT for preclinical applications2,3, and up to 200mT for clinical ones4. FFC technology based on a coil inserted into an existing MRI has the advantage of providing nuclear magnetic resonance dispersion (NMRD) profile characterization together with the full capabilities at fixed B0. Up to now, it was possible to measure longitudinal R1-NMRD profiles and to generate innovative R1-dispersive contrasts5,6. However, the ability to measure transverse R2-NMRD profiles has still to be investigated. Here, a spin-echo based FFC sequence is developed to measure R2-dispersion, and is applied to ferritin and Gd-DOTA in the range 1.15 to 1.85 T.Materials and methods
A fast field cycling magnet (Stelar s.r.l., Mede, Italy) capable of providing ΔB=±0.5 T with ramp times of ~3ms (R=0.1 Ω, L=0.3 mH) was inserted into a 1.5 T MRI system (Philips Achieva). The insert is a solenoidal coil designed for small animal imaging with dimensions: 17cm diameter, 30cm length and 4cm diameter bore. A Tecmag pulse sequencer was used to control field shifts as well as RF transmission and reception with a home-built volume RF coil. Precision and stability of ΔB pulses were checked using the current monitor of the power amplifier.
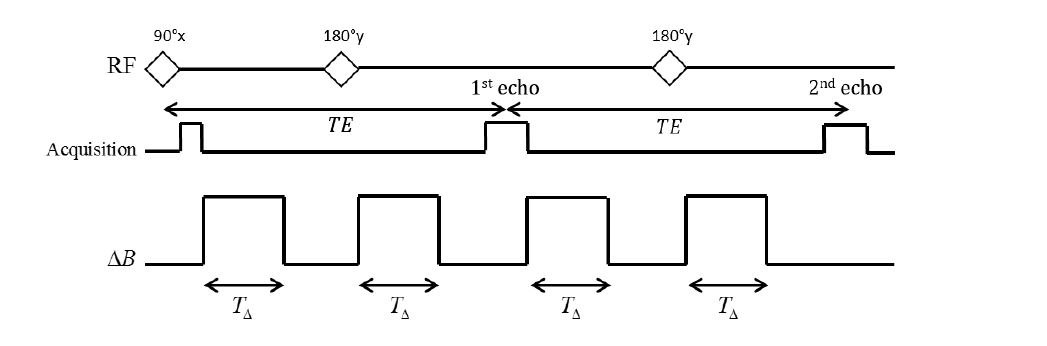
The CPMG sequence modified for FFC is depicted in Fig.1. First, a 90° pulse flips the magnetization into the transverse plane at B0. Then the transverse magnetization relaxes at the offset field B0+ΔB during a time TΔ. The dephasing introduced during the FFC pulse is refocused after a 180° pulse by a second ΔB pulse with identical shape. For small ΔB compared to B0, the relaxation rate can be assumed to evolve linearly with ΔB as R2,0 + β2.ΔB, with β2 the slope of the R2-dispersion profile at B0. The transverse magnetization at echo number N is then provided by the following expression:
$$M_{xy}=M_{0}\cdot\exp(-R_{2,0}.N.TE-\beta_{2}.\int_{0}^{N.TE} \Delta B.dt)$$ (Eq.1)
In the limit 2.N.β2.ΔB.TΔ<<1, the contrast generated at echo number N is given by:
$$M_{xy}(B_0+\Delta B)-M_{xy}(B_0)\approx -2.N.\beta_{2}.\Delta B.T_{\Delta}.M_{0}\cdot\exp(-R_{2,0}.N.TE)$$ (Eq.2)
The factor 2.N.β.ΔB.TΔ produces a linear increase due to dispersion, and the signal decays exponentially with a rate R2,0. Thus, the highest R2-dispersive contrast is obtained for N.TE=1/R2,0.
Solutions of non-dispersive (13mM [Gd] Dotarem; Guerbet; β2/R2,0=0 T-1)7 and dispersive (170mM [Fe] horse spleen ferritin F4503; Sigma Aldrich; β2/R2,0=0.5 T-1) contrast agents were placed in 18-mm diameter spheres. Ferritin R2-NMRD profile is linear over an extended range of magnetic fields, at least from 0.2 T to 11.7 T8,9.
In practice, in the inhomogeneous fields produced by the FFC system, additional irreversible attenuation is caused by diffusion. Assuming an average gradient, the Stejskal-Tanner equation10 predicts a Gaussian attenuation of the echo amplitude with ΔB for the CPMG sequence. To reduce diffusion effects, shorter inter-echo times can be used and effects can be modeled. Data were thus acquired using N=2 with TE=28.5ms, TΔ=2ms and multiple ΔB field shifts (4.7mT steps). Attenuation due to diffusion was first removed by fitting a Gaussian function to the echo amplitudes as a function of ΔB. Corrected echo amplitudes were then fitted to Eq.1 to estimate R2,0 and β2.
Results
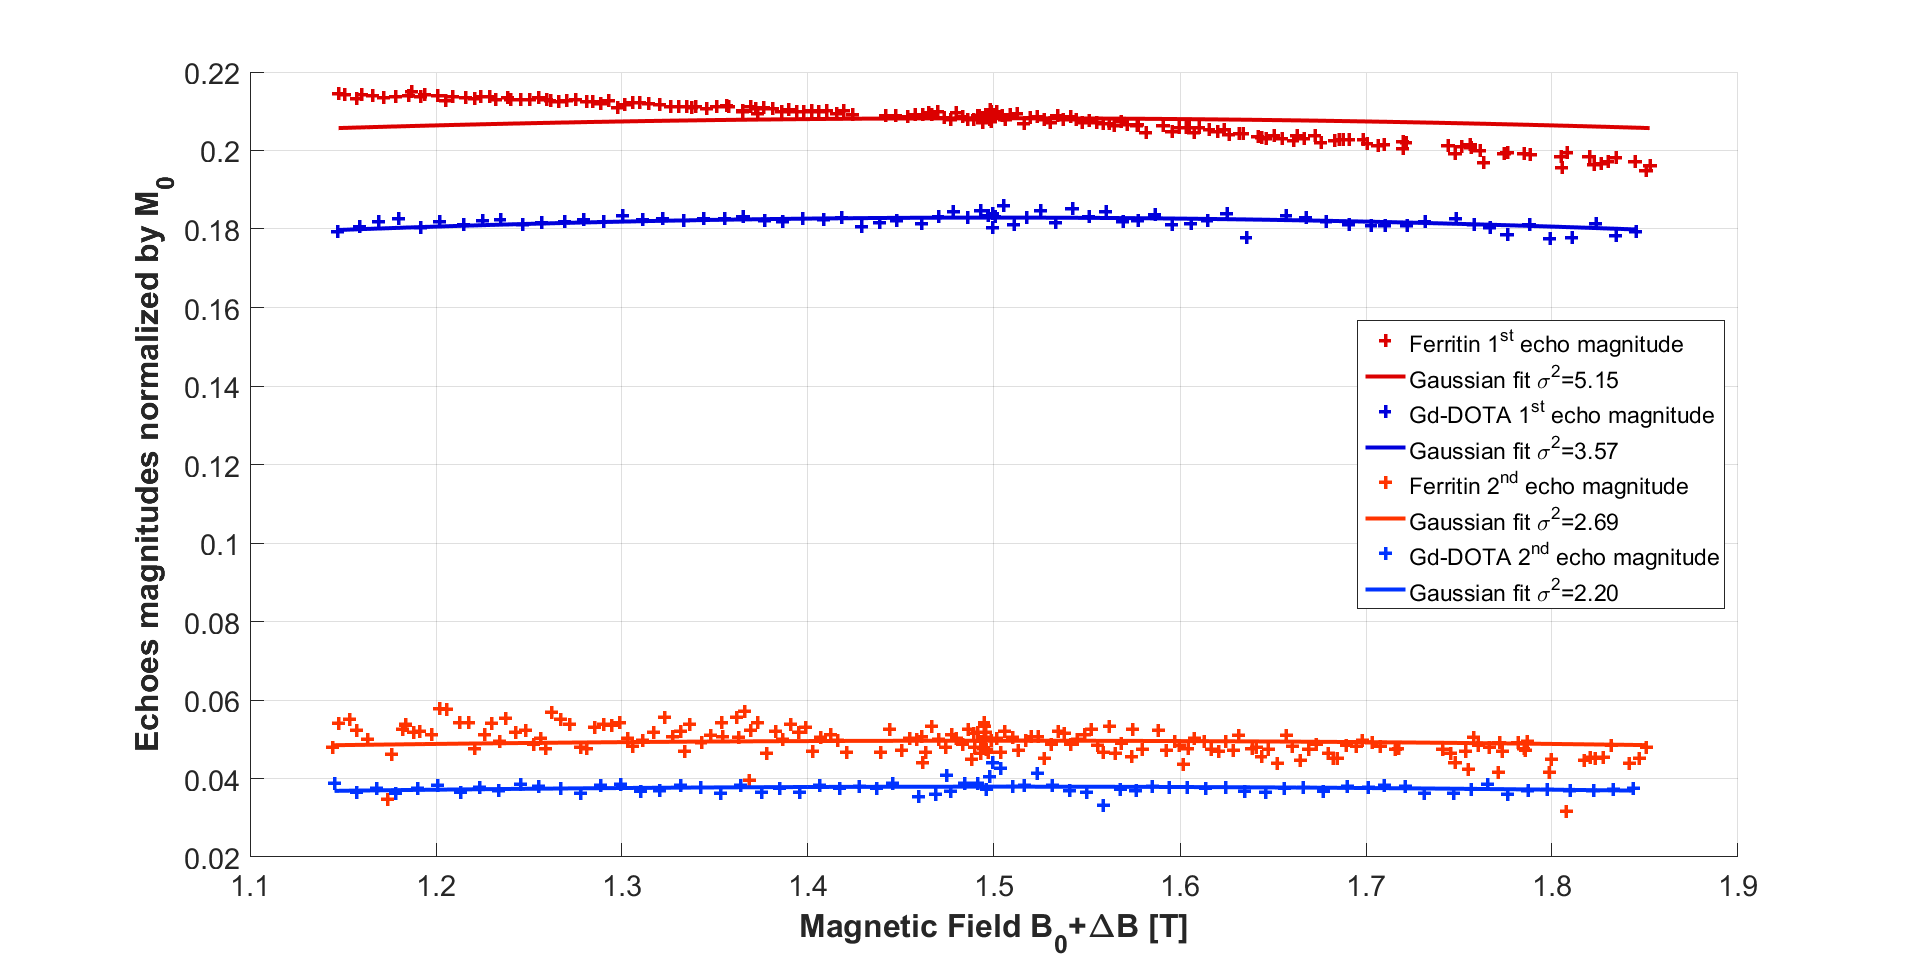
Fig.2 shows the acquired echo magnitudes along the magnetic field offset ΔB for ferritin and Gd-DOTA solutions. As can be seen, attenuation arises from diffusion (even Gaussian shape) and from R2-dispersion (odd linear evolution). The Gaussian fit enables to estimate the order of magnitude of the gradients from the Stejskal-Tanner equation ≈15mT/m at ΔB=±0.2 T.
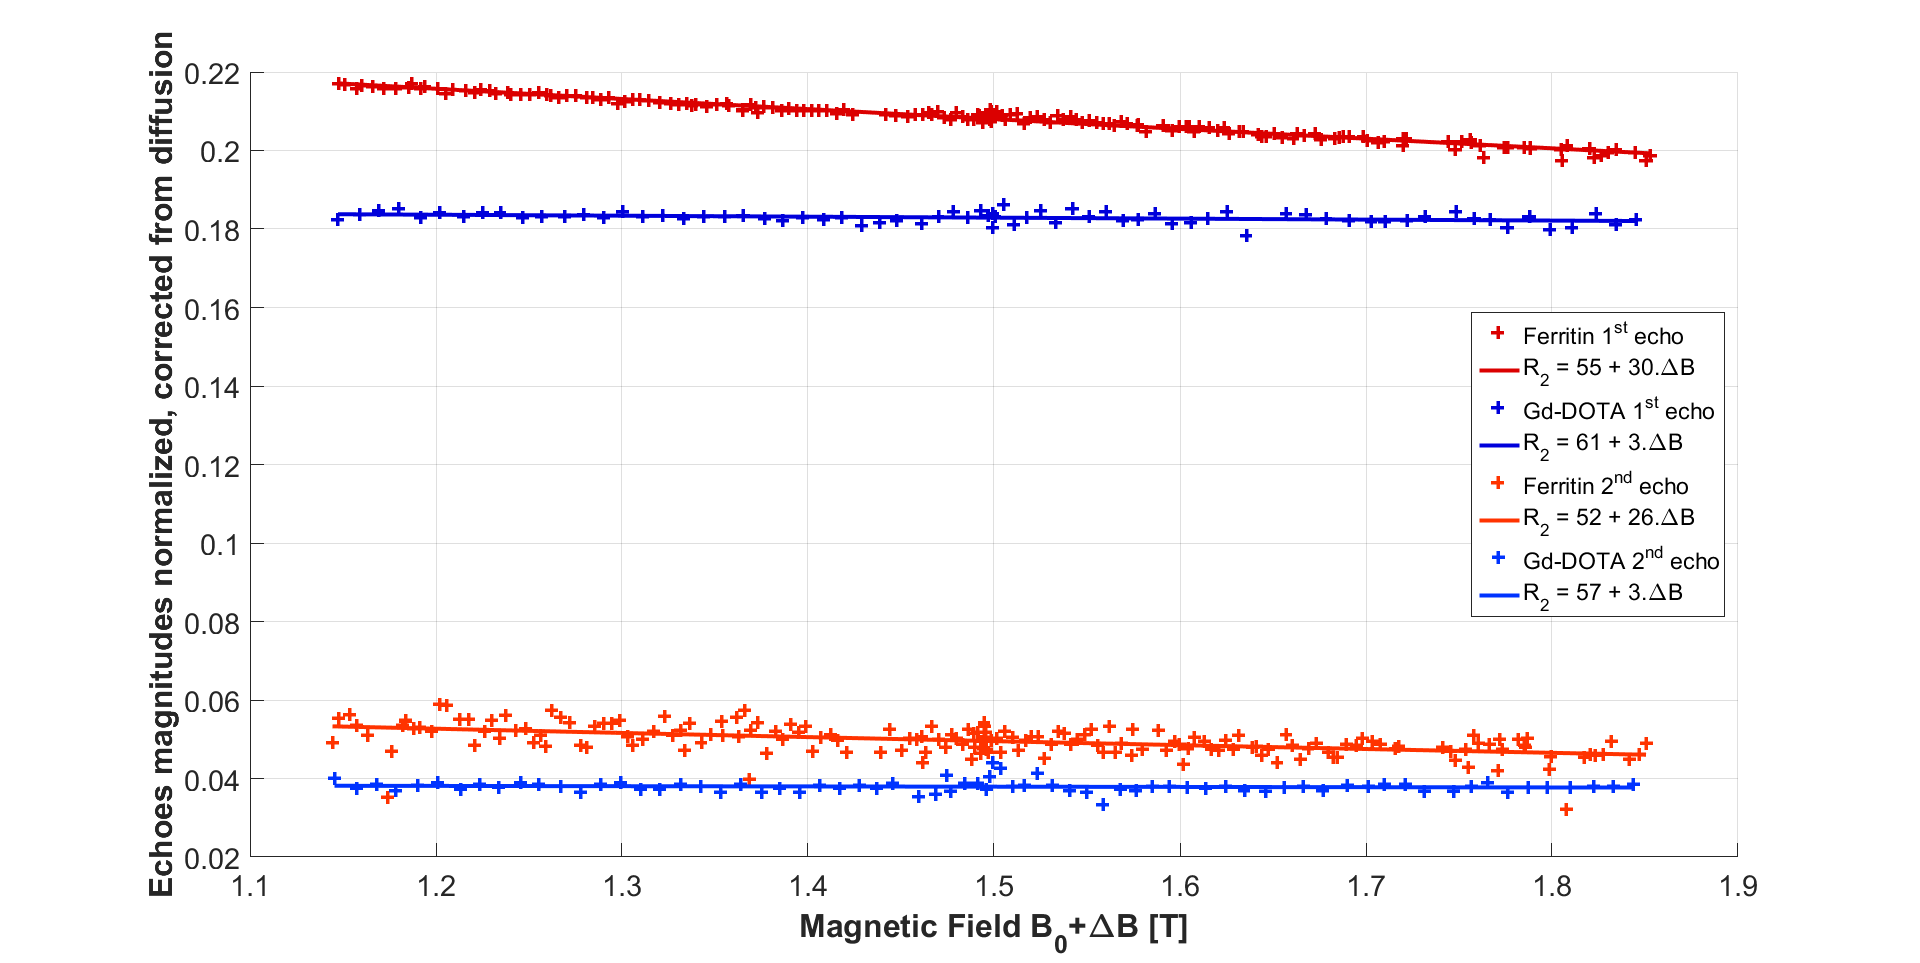
Fig.3 shows the acquired echo magnitudes corrected from diffusion attenuation. As predicted8 by Eq.2 the ferritin solution displays a linear dispersion with the expected values for R2,0=55.00±0.04 s-1 and β2=30.34±1.62 s-1.T-1 for the first echo and R2,0=51.88±0.38 s-1 and β2=25.55±13.91 s-1.T-1 for the second echo. By contrast, the Gd-DOTA solution displays poor dispersion: R2,0=61.41±0.08 s-1 and β2=3.46±2.96 s-1.T-1 for the first echo and R2,0=57.01±0.88 s-1 and β2=3.21±33.41 s-1.T-1 for the second echo.
Discussion and conclusion
Measurements of R2-dispersion could be obtained accurately with the FFC-MRI technology. R2-dispersive parameters were obtained by adapting a CPMG sequence with identical FFC pulses. The theoretical analysis of the contrast was performed providing means to optimize R2-dispersion effects. Diffusion effects, while present, could be modeled and removed, and could be further reduced with shorter echo times, in the limit of the system ramp times (~3ms here). Future work will focus on imaging this new R2-dispersion contrast with possible biomedical applications starting with ferritin, a protein already present in vivo that will provide endogenous contrast11.Acknowledgements
No acknowledgement found.References
[1] Lurie D.J., et al., C. R. Physique (2010);11 :136-148. [2] SM Lee E., et al., Proc. Intl. Soc. Mag. Reson. Med. 20, abstract 2577 (2012). [3] Harris C.T., et al., MRM (2014);72:1182-1190. [4] Pine, K.J. and D.J. Lurie., ESMRMB (2012). [5] Alford, J.K., et al, MRM (2009);61:796-802. [6] Hoelsher U.C., et al., Magn Reson Mater Phy (2012);25:223–231 [7] Unpublished Guerbet Data [8] Gossuin Y., et al., Mag. Reson. Med. (2000);43:237–243 [9] Vymazal J., et al., MRM 36:61-65 (1996) [10] Stejskal E.O., et al., The Journal of Chemical Physics 42, 288 (1965) [11] Hocq. A., et al., Contrast Media Mol. Imaging (2014).Figures