3789
In Vivo Deuterium Labeling and Detection Of Organs Containing Rapidly Dividing Cells1Mouse Imaging Facility, NINDS, National Institutes of Health, Bethesda, MD, United States, 2Experimental Transplantation and Immunology Branch, NCI, National Institutes of Health, Bethesda, MD, 3Laboratory for Functional and Molecular Imaging, NINDS, National Institutes of Health, Bethesda, MD, United States, 4Experimental Transplantation and Immunology Branch, NCI, National Institutes of Health, Betesda, MD, United States, 5Experimental Transplantation and Immunology Branch, NCI, National Institutes of Health, Bethesda, MD, United States
Synopsis
In vivo deuterium labeling via ingestion of deuterated water was combined with magnetic resonance imaging to demonstrate a method for studying diseases with groups of rapidly dividing cells. This method was applied to a mouse model of chronic graft versus host disease to demonstrate feasibility.
Purpose:
Deuterated water labeling, parenteral and/or by ingestion into the diet results in metabolic incorporation of deuterium into cellular constituents, such as DNA, proteins, lipids, carbohydrates, and metabolites1,2. The presence of groups of rapidly dividing cells, which are preferentially enriched with deuterium will result in local preferential uptakeincreased deuterium signal in organs infiltrated by such cells, as measured by deuterium magnetic resonance imaging (dMRI).Methods:
This technique was applied to a minor antigen mismatch mouse model of chronic graft versus host disease (cGVHD), B10.D2 into BALB/c. Mice received hematopoietic stem cells (8 million/mouse) and splenocytes (15 million/mouse) (n=4) in the graft, with total body irradiation conditioning, which preceeded graft infusion. Two cohorts of mice were used, those with minor antigen mismatch between host and donor (cGVHD model) and without (n=4) (syngeneic controls). A control group was not given any stem cells (n=3). After 14 days, seven days after the transplant, the mice received an intraperitoneal bolus of 0.9% saline in 100% 2H2O (by volume), and the cage water was switched to water containing 58% 2H2O (by volume). After 21 days of labeling, the mice were euthanized and then scanned by magnetic resonance imaging ( MRI). All magnetic resonance imaging (MRI) experiments were performed on a 9.4 Tesla. Immediately following euthanasia, the mouse was wrapped in plastic and taped onto a plastic cradle in a flat, level position. Following acquisition of a set of standard locator images, a set of three coronal planes were prescribed covering the spleen and liver. A 5-mm diameter tube containing 5% 2H2O in H2O was placed adjacent to the mouse as a reference and calibration standard. Reference images of these regions were acquired using the MSME sequence and the following parameters: Field of View = 40x40mm, slice thickness = 1mm, TR/TE= 1000/14ms, and the matrix was 256x256. Subsequently, the same planes were imaged using the Chemical Shift Imaging (CSI) sequence with the following parameters: Field of View = 40x40mm, slice thickness = 3mm, TR/TE = 398/1.6ms, spatial matrix = 128x64, and spectral matrix = 512. The excitation flip angle was adjusted to meet the Ernst angle condition. All data was analyzed using custom code written in Python. Following CSI reconstruction, regions of interest were placed on the reference sample, the spleen (when visible), the liver, and muscle. The average intensity and the standard deviation of the intensity was measured and tabulated for each region on the CSI and reference images. Anatomical regions were normalized using the reference intensity to compensate for experimental variation.Results:
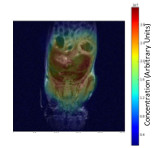
Standard anatomical and CSI images were collected for the groups of mice. Region of Interest (ROI) analysis was performed for the reference, spleen, liver, and miscellaneous muscle in the 2H image and for identical regions in the proton reference image (Figure 1). At day 28, the liver (cGVHD target organ) ROI’s for 2H showed significant differences (p=0.0012), but those for the the muscle (not targeted by cGVHD) did not. The ROI’s computed from the 1H images showed no significant difference between any of the experimental cohorts.Discussion:
Several MRI approaches have been employed to visualize and diagnose tissue sites affected by dysregulated immunity3-7. The simplest approaches based on endogenous contrast have not yielded reliable results due to lack of sensitivity. Subsequent approaches based on the administration of immune cells labeled with either iron or gadolinium bearing contrast agents have also not been reliable due to the pharmacokinetic properties of the tissues involved. 2H2O rapidly distributes through the body and is readily incorporated into tissue. In the allogeneic transplant recipient animals, the involvement of target organ (liver) by immune cells was large enough to affect the local metabolic balance, while the tissue itself appeared unaffected by anatomical imaging.
Conclusions:
Consumption of deuterated water combined with 2H MRI methods distinguishes allogeneic from syngeneic (control) transplants in a mouse model of cGVHD. The method described here is not limited only to this disease, but to can be applied to any disease characterized by a population of cells with rapid turnover or growth compared to normal, for example cancer.Acknowledgements
No acknowledgement found.References
1. Busch R, Neese RA, Awada M, Hayes GM, Hellerstein MK., “Measurement of cell proliferation by heavy water labeling.”, Nat Protoc. 2007;2(12):3045-57.
2. Farthing DE, Buxbaum NP, Bare CV, Treadwell SM, Kapoor V, Williams KM, Gress RE.., “Sensitive GC-MS/MS method to measure deuterium labeled deoxyadenosine in DNA from limited mouse cell populations”, Anal Chem 85, 4613-4620 (2013)
3. Lee HW, Gangadaran P, Kalimuthu S, Ahn BC. “Advances in Molecular Imaging Strategies for In Vivo Tracking of Immune Cells.”, Biomed Res Int. 2016;2016:1946585
4. Modo M, Hoehn M, Bulte JW., “Cellular MR imaging.”, Mol Imaging. 2005 Jul-Sep;4(3):143-64
5. Arbab AS, Frank JA., “Cellular MRI and its role in stem cell therapy.”, Regen Med. 2008 Mar;3(2):199-215
6. Busch R, Neese RA, Awada M, Hayes GM, Hellerstein MK., “Measurement of cell proliferation by heavy water labeling.”, Nat Protoc. 2007;2(12):3045-57.
7. Duda J, Karimi M, Negrin RS, Contag CH., “Methods for imaging cell fates in hematopoiesis.”, Methods Mol Med. 2007;134:17-34
Figures