3787
Non-invasive 3T lymphangiography using 3D velocity-suppressed T2-weighted MRI1Radiology and Radiological Sciences, Vanderbilt University Medical Center, Nashville, TN, United States, 2Physical Medicine and Rehabilitation, Vanderbilt University Medical Center, Nashville, TN, United States, 3Vanderbilt Dayani Center for Health and Wellness, Nashville, TN, United States, 4Neurology, Vanderbilt University Medical Center, Nashville, TN, United States, 5Psychiatry, Vanderbilt University Medical Center, Nashville, TN, United States, 6Physics and Astronomy, Vanderbilt University, Nashville, TN, United States
Synopsis
We demonstrate for the first time abilities to perform lymphangiography non-invasively using turbo-spin-echo 3.0T MRI pulse sequences. Contrast consistent with lateralizing disease was observed in patients with known secondary lymphedema from breast cancer treatment-related lymphedema, which also adjusted in an expected manner following manipulation of lymphatic stasis through manual lymphatic drainage therapy. These findings suggest that MRI may be well-suited to evaluate lymphatic functioning and lymphedema treatment response, and may have relevance for informing personalized lymphedema risk before surgery or following breast cancer therapies.
Purpose
Despite the central role of the lymphatic system in disease and circulatory homeostasis, MRI methods for visualizing lymphatic architecture require 45-60 minutes and monitoring of exogenous contrast uptake and transport1. Here, the long 3.0T relaxation times (T1/T2=3100/610ms)2 and low flow velocity (velocity~0.6cm/min) of lymphatic fluid are exploited to propose a 10 minute, non-invasive lymphangiography sequence.Methods
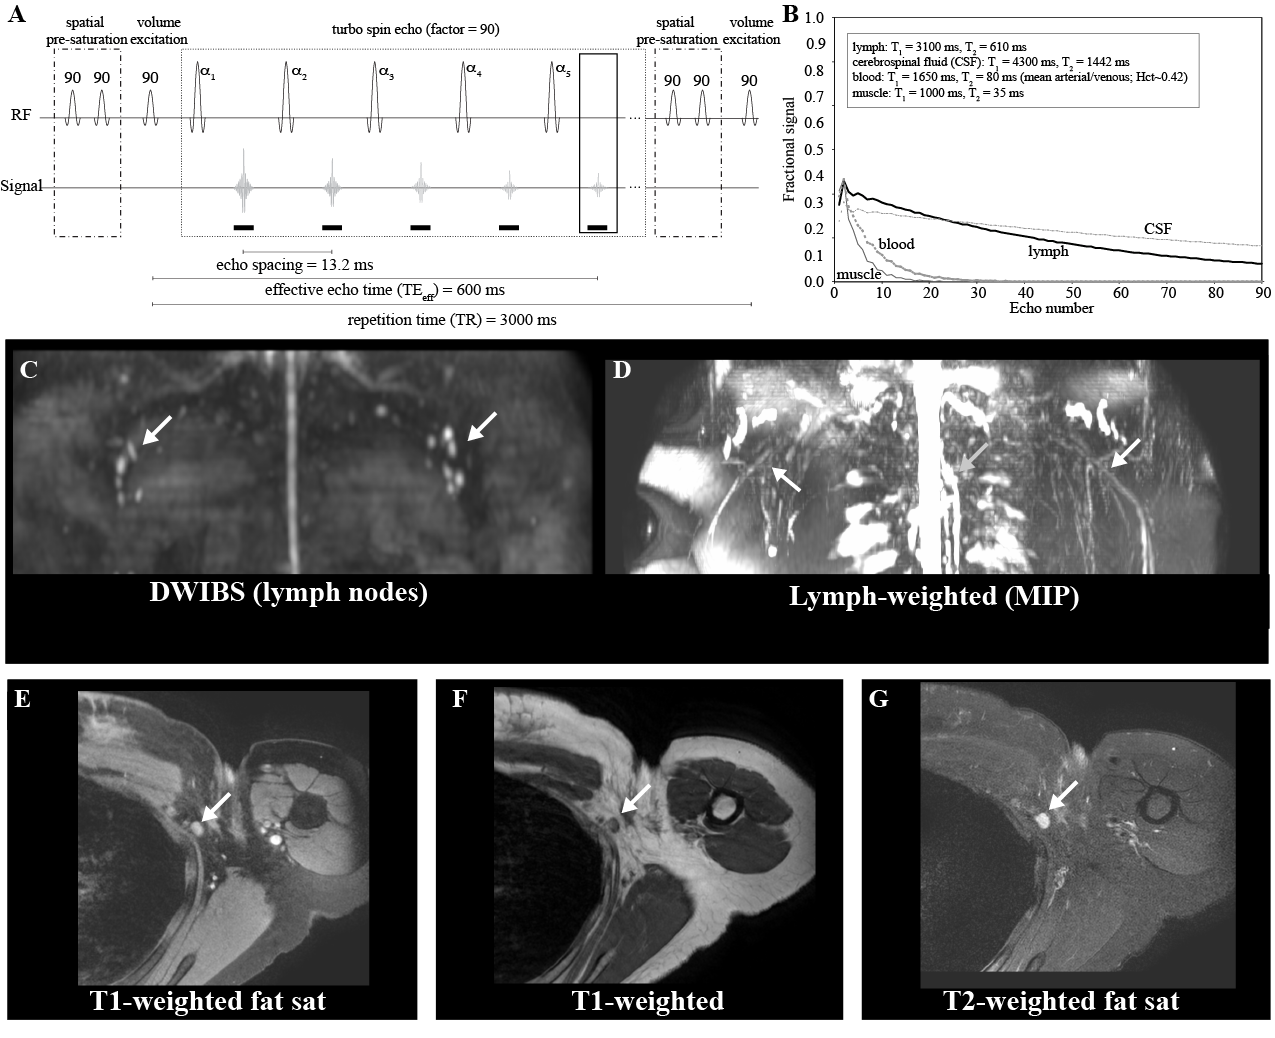
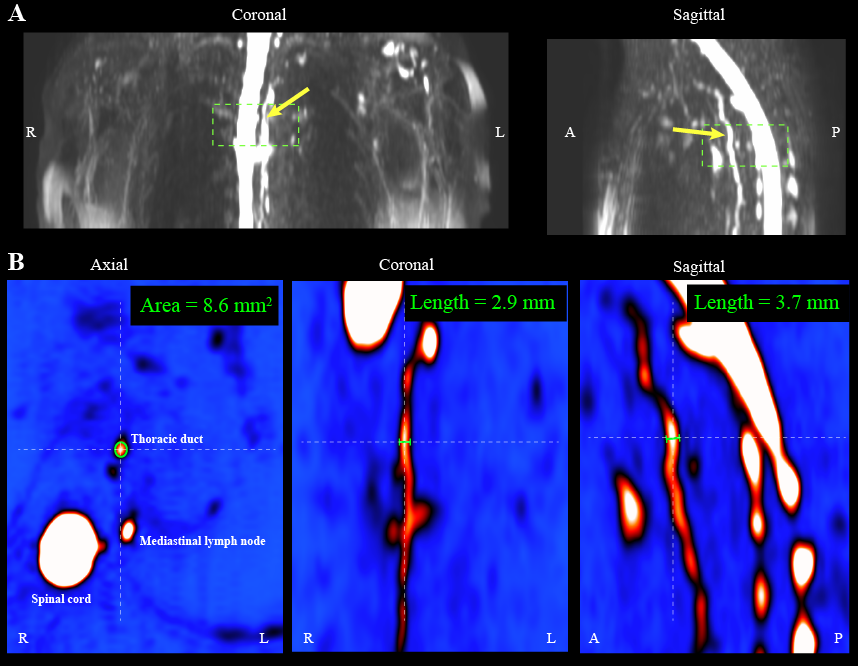
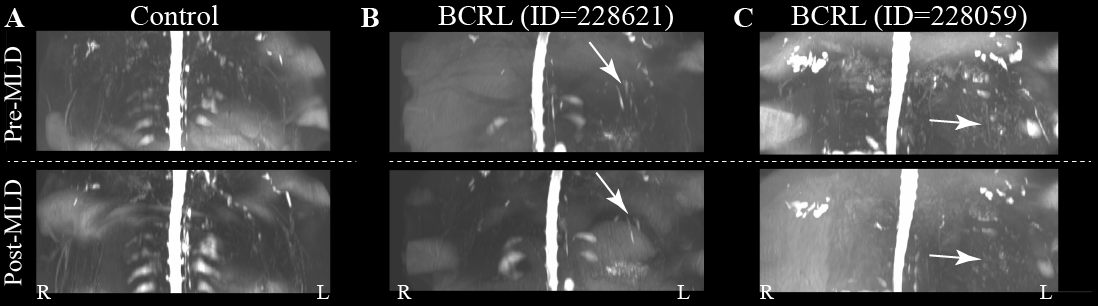
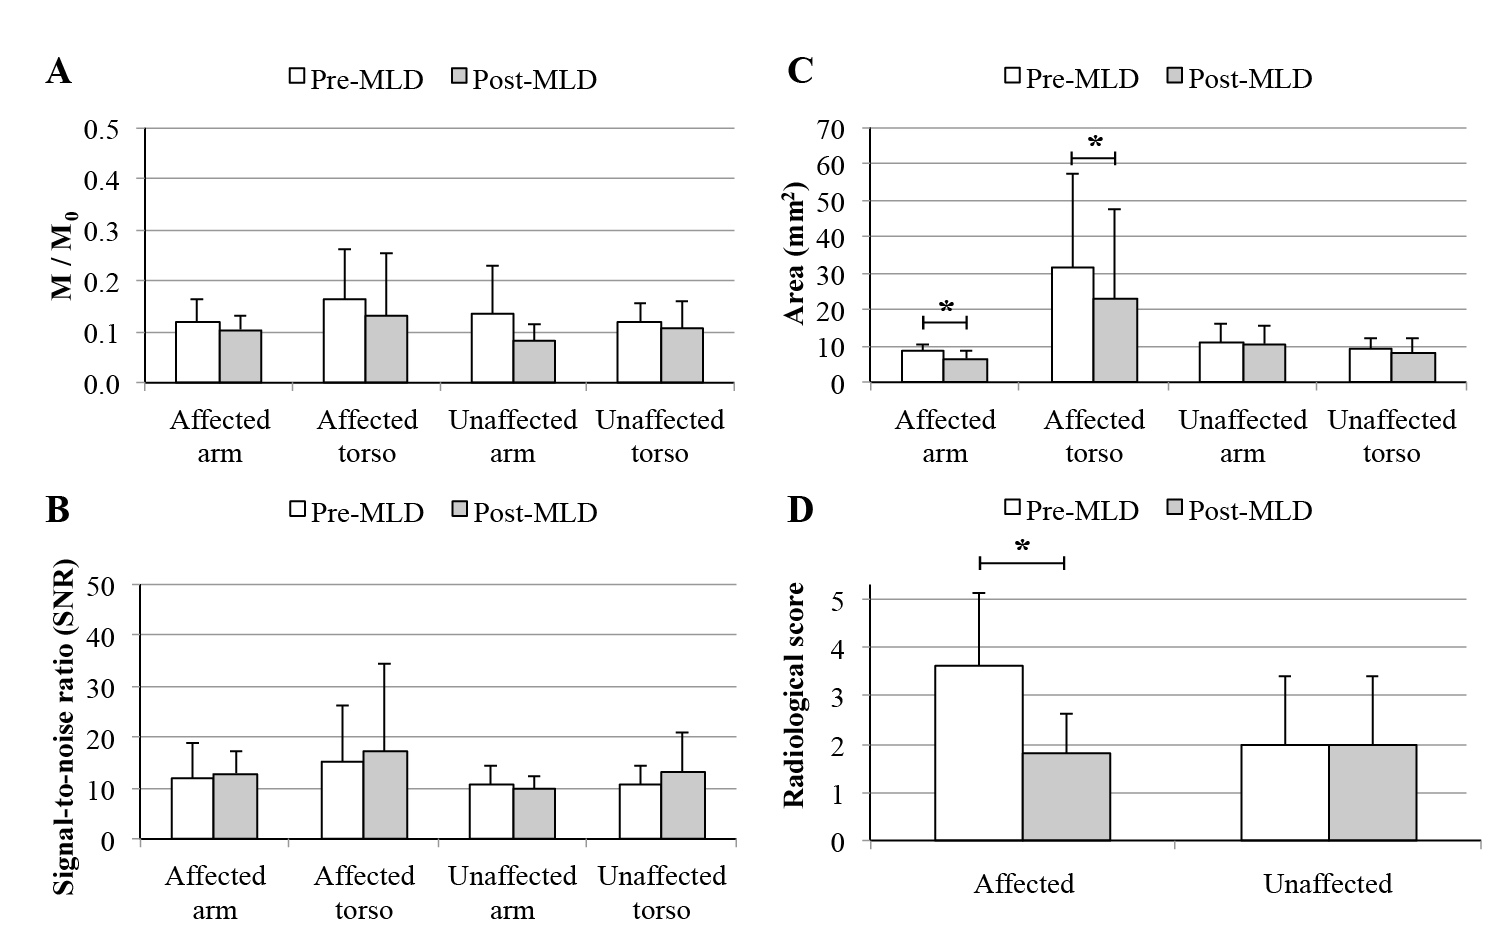
A turbo-spin-echo (TSE) pulse train (Fig. 1) with long echo time (TEeffective=600ms; shot-duration=13.2ms) and TSE-factor (TSE-factor=90), spatially-selective pre-saturation pulses, and parallel B1-transmit was developed and magnetization evolution simulated. Additional parameters: spatial resolution=1.39x1.39x3mm3, refocusing angle=110 degrees, oversampling=120 mm (in A/P direction), SPIR fat suppression (190 Hz), averages=2, k-space ordering=linear-cartesian. The method was evaluated in healthy adults (n=10) and volunteers with unilateral breast cancer treatment-related lymphedema (BCRL; n=17), with a subgroup (n=7) of participants scanned before and after manual lymphatic drainage (MLD) therapy3, which is intended to manually relocate lymphatic fluid from the affected to unaffected quadrant of the torso. For analysis, a 3D maximum-intensity-projection (MIP) image was constructed, and the largest discernable lymphatic collector vessel was identified in each arm and side of the torso. The signal-to-noise-ratio (SNR), lymphatic collector area (Fig. 2), and magnetization were measured in these regions. M0 was measured in the CSF, and converted from steady-state to equilibrium by normalizing by a factor (1+e-TR/T1)e-TEequivalent/T2, where TR=3000 ms, TEequivalent=493 ms, and CSF relaxation time values were T1=4300 ms and T2=1442 ms4. Results from a five-point radiological scoring system (higher scores indicating higher levels of lymphatic impairment) were recorded from three observers. To test the difference in study parameters between groups, the Wilcoxon rank sum test was applied and a corrected p-value<0.05 was required for significance.Results
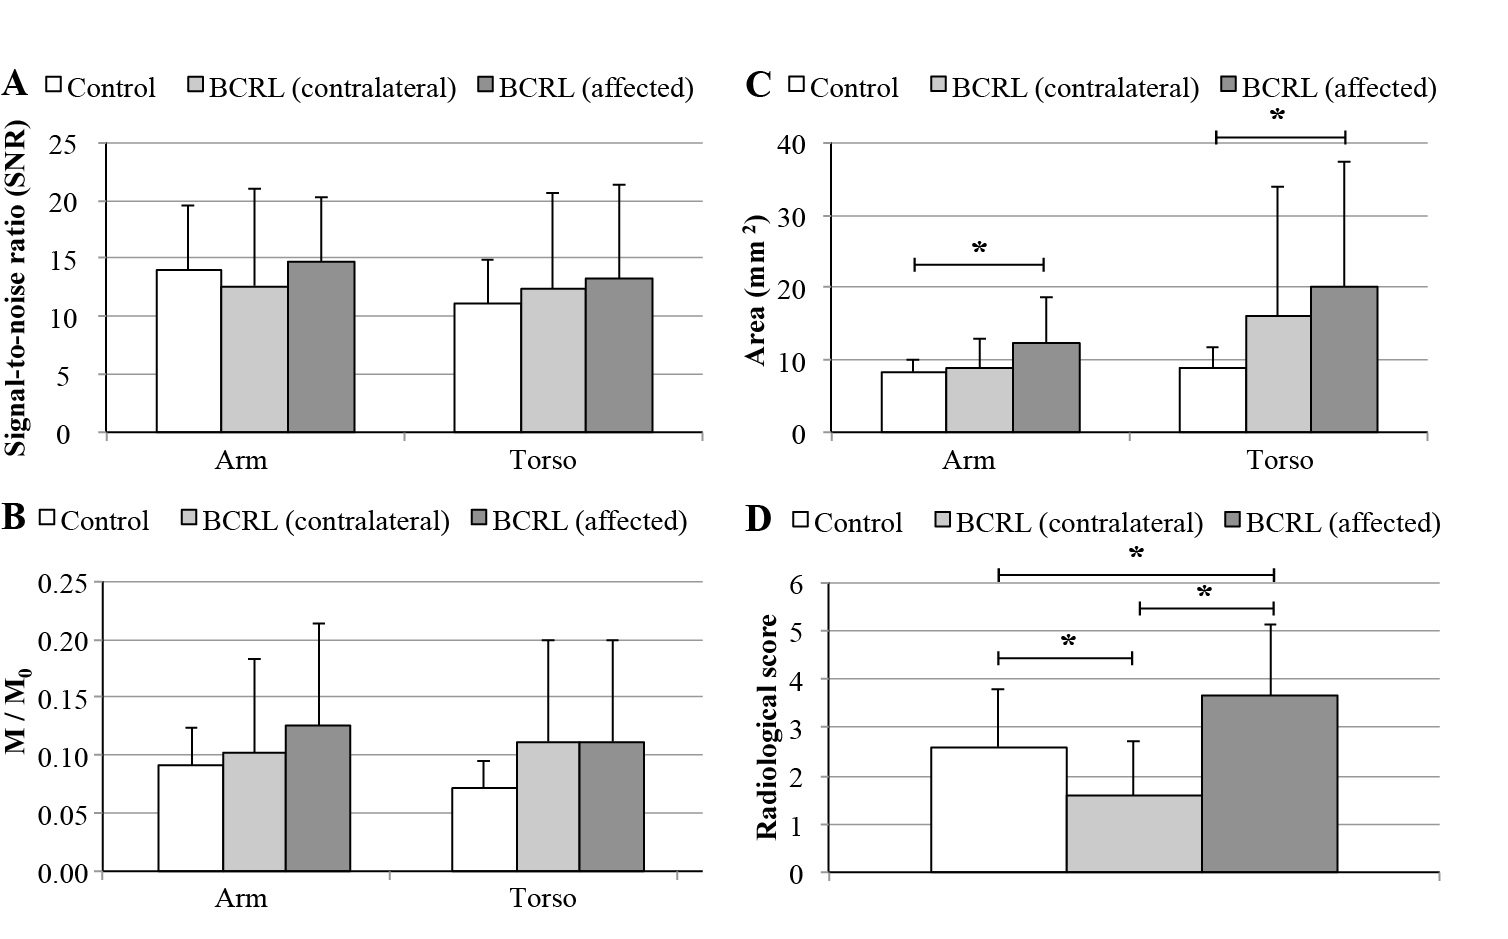
SNR was constant across volunteers (range=12.5-14.3), but lymphatic stasis indicators were increased in the torso and arm on the affected (cross-sectional area=12.2±6.3mm2; radiologic score=3.7±1.5) relative to contralateral (cross-sectional area=8.8±3.4 mm2; radiologic score=1.6±1.1) side of patients (Figs. 3,4). The cross-sectional area and lymphatic impairment score were significantly reduced in vessels from the affected arm and torso of patients following MLD therapy (Fig. 5C-D). Magnetization values in collector vessels (group range=0.082-0.131, Figs. 3B,5A) were consistent with simulated values for lymphatic fluid (Fig. 1B).Discussion
We utilized recently-measured 3.0T MRI relaxation times of lymphatic fluid and known ranges of lymphatic and blood flow velocities to propose a non-invasive lymphangiography MRI pulse sequence. In healthy subjects, we found the largest lymphatic arm and torso collectors to have a cross-sectional area of approximately 8-9 mm, thus corresponding to a diameter of 3-3.4 mm for the largest vessels observed. This is approximately consistent with expected sizes for larger lymphatic vessels in these regions, which have been suggested to fluctuate in diameter of 2-4 mm for a lymphatic flow of 1-3 ml/min and pressure of 1.5 mmHg5.Conclusion
These findings suggest that MRI may be well-suited to evaluate lymphatic vessel structure noninvasively and lymphedema treatment response, and may have relevance for informing personalized lymphedema risk and early detection following breast cancer therapies.Acknowledgements
No acknowledgement found.References
1. Lucarelli RT, Ogawa M, Kosaka N, Turkbey B, Kobayashi H, Choyke PL. New approaches to lymphatic imaging. Lymphatic research and biology. 2009;7(4):205-14. doi: 10.1089/lrb.2009.0021. PubMed PMID: 20143919; PubMed Central PMCID: PMC2883526.
2. Rane S, Donahue PM, Towse T, Ridner S, Chappell M, Jordi J, Gore J, Donahue MJ. Clinical feasibility of noninvasive visualization of lymphatic flow with principles of spin labeling MR imaging: implications for lymphedema assessment. Radiology. 2013;269(3):893-902. doi: 10.1148/radiol.13120145. PubMed PMID: 23864103; PubMed Central PMCID: PMC4485559.
3. Shah C, Arthur DW, Wazer D, Khan A, Ridner S, Vicini F. The impact of early detection and intervention of breast cancer-related lymphedema: a systematic review. Cancer medicine. 2016;5(6):1154-62. doi: 10.1002/cam4.691. PubMed PMID: 26993371; PubMed Central PMCID: PMC4924374.
4. Donahue MJ, Juttukonda MR, Watchmaker JM. Noise concerns and post-processing procedures in cerebral flood flow (CBF) and cerebral blood volume (CBV) functional magnetic resonance imaging. Neuroimage. 2016. Epub ahead of print. doi: 10.1016/j.neuroimage.2016.09.007. PubMed PMID: 27622397.
5. Quick CM, Venugopal AM, Gashev AA, Zawieja DC, Stewart RH. Intrinsic pump-conduit behavior of lymphangions. American journal of physiology Regulatory, integrative and comparative physiology. 2007;292(4):R1510-8. doi: 10.1152/ajpregu.00258.2006. PubMed PMID: 17122333.
Figures