3785
Image contrast at sub-millisecond echo times1Center for Neuroscience Imaging Research, Institute for Basic Science (IBS), Suwon, Korea, Republic of, 2Department of Biomedical Engineering, Sungkyunkwan University, Suwon, Korea, Republic of, 3Department of radiology, Seoul National University Hospital, Seoul University College of Medicine, Seoul, Korea, Republic of
Synopsis
Some contrast mechanisms like in- and out-of-phase contrasts of fat and water come into play at sub-millisecond echo times(TE) at high field strengths above 3T, and under-recognition of them can lead to misunderstanding of signal intensities and inappropriate interpretation of normal and disease pathology. Here the TEs including the sub-millisecond ones were estimated at various field strengths and it was demonstrated by phantom and human lung imaging that contrast mechanisms are apparently seen at the sub-millisecond TE and thus should not be overlooked at high field strengths when using UTE imaging techniques that can cover the range of sub-millisecond TE.
Purpose
With an advance of pulse sequences and hardware in MRI, sub-millisecond echo-time(TE) imaging including ultrashort-TE(UTE) imaging has been available for detecting short T2/T2* species on both clinical and preclinical scanners(1-3). Image contrast at sub-millisecond TE regimes is known to be given by a combination of T1 weighting and proton-density weighting, and the degree of each weighting can be controlled by some parameters such as TR, flip angle, and a preparation pulse. However, some contrast mechanisms like in- and out-of-phase contrasts of fat and water come into play at sub-millisecond echo times at high field strengths above 3T(4), and under-recognition of them can lead to misunderstanding of signal intensities and inappropriate interpretation of normal and disease pathology. Here TE values including sub-millisecond ones at various field strengths were examined when in- and out-of-phase contrasts of fat and water occur and their effects on image contrasts were demonstrated in human lung and phantom imaging at 3T and 9.4T, respectively. It was also shown that Dixon images obtained using shorter TEs of sub-millisecond provide a better SNR than using longer TEs.Method
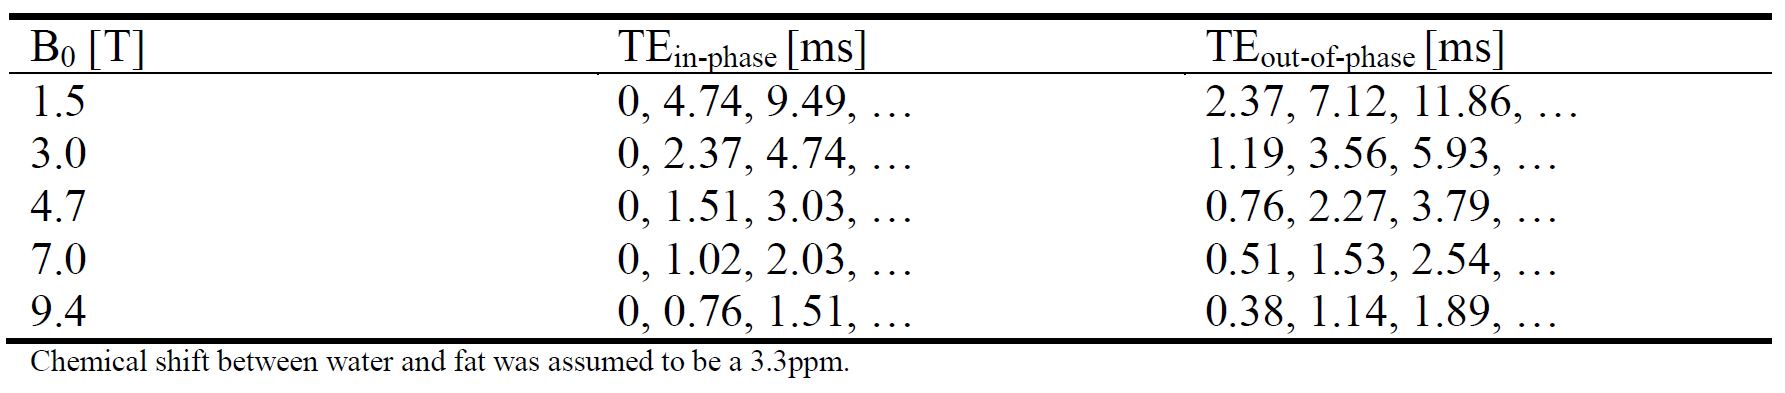
The echo times when in- and out-of-phase of fat and water magnetizations take place were calculated by
$${\tau}={\triangle}{\phi}{f}{_w}{_,}{_f}$$
where τ is a time needed to accrue Δφ, fw,f is a fat-water frequency difference, and Δφ is a phase difference corresponding to fw,f. The values of echo times estimated at various field strengths are listed in Table 1. To determine fw,f at different field strengths, chemical shift between water and fat was assumed to be 3.3 ppm. For all experiments, CODE(Concurrent Dephasing and Excitation) pulse sequence was used which is a recently proposed 3D radial gradient-echo-based UTE sequence(2). Imaging of phantom with a mixture of sesame oil and water was performed in Agilent 9.4T animal system. Scan parameters were: TR= 3.58ms, TE = 0.38(1stout-of-phase), 0.76(1stin-phase), 1.14(2ndout-of-phase), 1.51(2ndin-phase)ms, FOV=80×80×80mm3, FA=5°, number of views=30,000, matrix size=320×320×320. healthy adult volunteers participated in this HIPAA-compliant, IRB-approved human lung study on 3-T(Magnetom Trio; Siemens,Erlangen,Germany) clinical scanners. Scan parameters were: TR=7.34ms, TE=0.14(shortest TE), 0.67, 1.19(1stout-of-phase), 1.51, 2.37(2ndin-phase), 3.56(2ndout-of-phase), 4.74ms(3rdin-phase), FOV=384×384×384mm3, FA=2°, number of views=100,000, Matrix size=500×500×500. The minimum TE (=0.14 ms) was approximately assumed to be the 1st in-phase echo time. To obtain fat-only and water-only images, three-point Dixon method was applied using sub-millisecond TEs for 9.4-T phantom data. In case of 3T human lung data, two groups of three echo times were used, each of which corresponds to [1stin-phase,1stout-of-phase,2ndin-phase] and [2ndin-phase,2ndout-of-phase,3rdin-phase], for comparison of SNR of Dixon images obtained from both cases.
Results
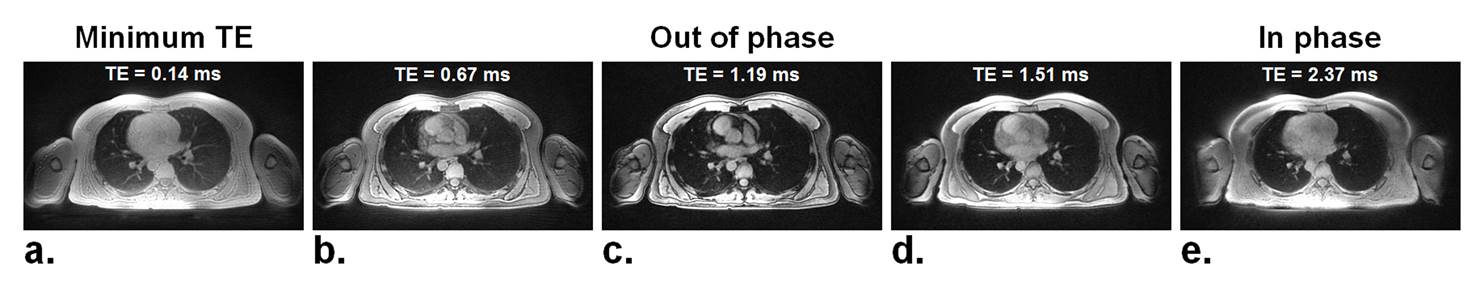
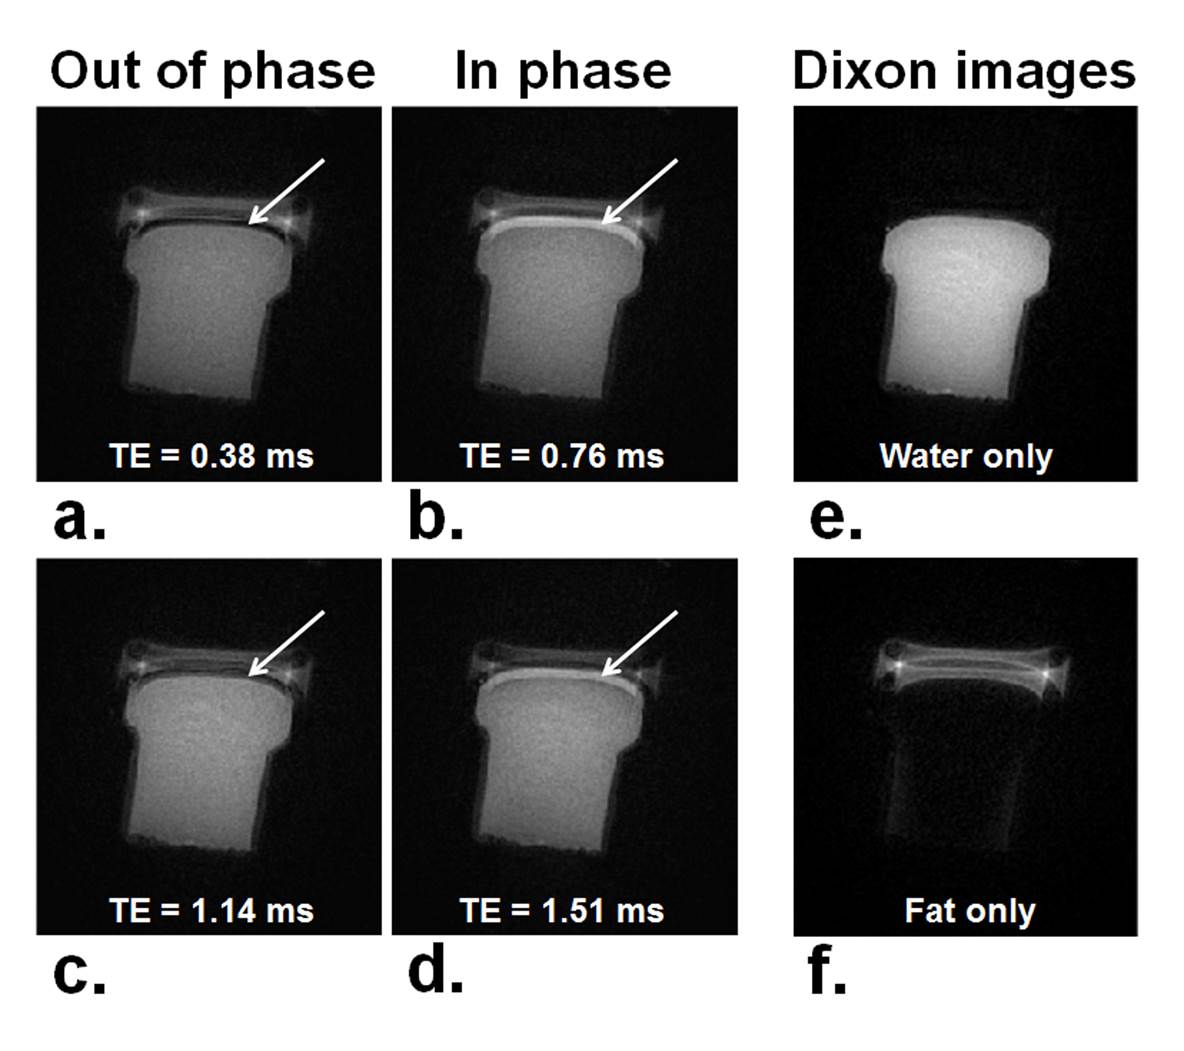
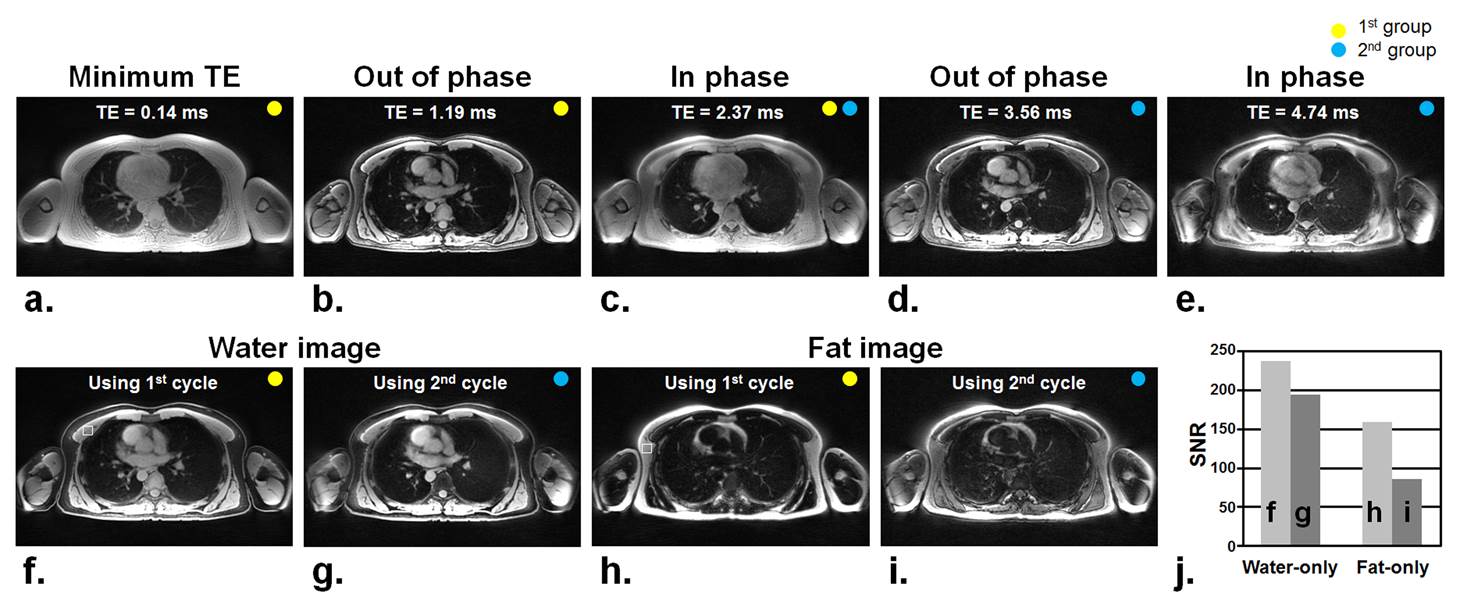
Figure 1 shows how image contrast changes according to the echo time especially in the sub-millisecond range in human lung imaging at 3T. At the minimum TE, the image contrast was heavily proton-density weighted and, as TE increases, it was mainly affected by T2* decay except for the first out-of-phase of fat and water magnetizations at TE=1.19ms. In Figs.2a-2d, in- and out-of-phase contrasts of fat and water are clearly seen at the water-oil interface (white arrows). Water and fat images were separated by three-point Dixon method using two in-phase (b,d) and one out-of-phase image (Fig.2c). Figure 3 shows the representative axial human lung images of healthy volunteers at various echo times corresponding to in- and out-of-phases of fat and water (Figs.3a-3e). Dixon images were obtained from two groups with different echo times: One group consisted of relatively short echo times below ~2ms (Figs.3a-3c) and the other group included echo times above ~2ms achievable in conventional gradient-echo imaging (Figs.3c-3e). In the former group, the minimum echo time of CODE (=0.14ms) was approximately used for the first in-phase echo time. With shorter echo times, water-only (Fig.3f) and fat-only (Fig.3h) images showed a water-fat separation with higher SNR except for some isolated pixels near the water-fat boundary.Discussion and Conclusion
Here the echo times including the sub-millisecond ones were estimated at various field strengths and it was demonstrated by phantom and human lung imaging that contrast mechanisms like in- and out-of-phase contrasts of fat and water are apparently seen at the sub-millisecond echo times and thus should not be overlooked at high field strengths above 3T especially when using UTE imaging techniques that can cover the range of sub-millisecond echo time, e.g., original 3D UTE(5) and CODE(2) imaging techniques. In addition, it was also shown that Dixon images obtained using shorter TEs provided a better SNR than using longer TEs, which was validated by applying three-point Dixon method to two groups of in- and out-of-phase images with two different sets of echo times (i.e., shorter vs. longer ones).Acknowledgements
Supported by National Research Foundation of Korea (NRF) 2010-0025744, 2013R1A1A2063746, and IBS-R015-D1.References
1. Bergin CJ, Pauly JM, Macovski A. Lung parenchyma: projection reconstruction MR imaging. Radiology 1991;179(3):777-781.
2.Park JY, Moeller S, Goerke U, Auerbach E, Chamberlain R, Ellermann J, Garwood M. Short echo-time 3D radial gradient-echo MRI using concurrent dephasing and excitation. Magn Reson Med 2012;67(2):428-436.
3. Johnson KM, Fain SB, Schiebler ML, Nagle S. Optimized 3D ultrashort echo time pulmonary MRI. Magn Reson Med 2013;70(5):1241-1250.
4. Berker, Yannick, et al. "MRI-based attenuation correction for hybrid PET/MRI systems: a 4-class tissue segmentation technique using a combined ultrashort-echo-time/Dixon MRI sequence." Journal of nuclear medicine 53.5 (2012): 796-804.
5. Glover GH, Pauly JM, Bradshaw KM. Boron-11 imaging with a three-dimensional reconstruction method. J Magn Reson Imaging 1992;2(1):47-52.
Figures