3784
Longitudinal in vivo 19F MR imaging by ZTE of 19F labeled calcium phosphate cement implanted in bone defects in the rat1Radiology, Radboud University Medical Centre, Nijmegen, Netherlands, 2Biomaterials, Radboud University Medical Centre, Nijmegen, Netherlands, 3Tumor Immunology, Radboud University Medical Centre, Nijmegen, Netherlands
Synopsis
To enhance MR image contrast of calcium phosphate cement (CPC) to bone, CPC was tagged with 19F loaded nanoparticles. This 19F labeled CPC material, after implantation into bone defects in rat legs, was monitored in vivo at 11.7T by longitudinal 19F zero echo time (ZTE) MR imaging. We demonstrate that the overlay of 19F ZTE images on 1H images allows for an excellent qualitative view of CPC with no background. By a quantitative evaluation of the 19F signal the in vivo degradation of CPC over weeks can be followed by MRI.
Introduction
Calcium phosphate cement (CPC), a widely used material for bone defect restoration, has poor MRI contrast relative to bone, due to similar T1 and T2 relaxation properties.1 Thus,to enhance contrast CPCs have been tagged with gadolinium or iron-oxide agents, but these unfavorably affect the properties of CPC and MRI of iron-oxide particles suffers from a blooming effect.1 Previously, we reported that incorporation of 19F loaded nanoparticles2 into CPC material allowed for a better MRI visualization of CPC in bone.3 Results from 19F MRI of in vitro and ex vivo samples with these nanoparticles demonstrated the possibility of qualitative and quantitative evaluation of the presence of CPC.
In this study we assessed the real potential of this approach in a longitudinal study with in vivo 1H and 19F MRI of 19F labeled CPC implanted into rat legs. We investigated whether 19F labeled CPC can be measured qualitatively and quantitatively by a comparison with the volumes of CPC implants estimated by computer tomography (CT), and whether the in vivo degradation of CPC can be traced over time by quantifying the 19F signal.
Methods
CPC material consisted of 59.1wt% alpha-tricalcium phosphate, 1.5wt% carboxymethyl cellulose and 39.4wt% cryo-grinded poly-lactic-co-glycolic acid (PLGA) particles. As 19F tracer we selected perfluoro-15-crown-5-ether (PFCE)2 embedded into PLGA nanoparticles through a single emulsion reaction.4 This was incorporated into CPC at a concentration of 16.7%. After incorporated with the 19F nanoparticles CPC did not show different injectability and cohesion properties.
In vitro sample
20mg PFCE nanoparticles were dissolved into distilled water in a 200μl eppendorf tube as a control sample for 19F quantifications.
In vivo rat legs
All animal surgeries were performed with approval of the ethics committee for the care and use of laboratory animals. Three healthy male Wistar rats (weight: 250-300g) were included in this study. A cylindrical defect (diameter:2.5mm; depth:3mm) was drilled in both right and left posterior legs of each rat. Each defect was then filled with injectable CPC material mixed with PFCE nanoparticles. Both legs of each rat, along with the control sample, were separately imaged by MR at day 0, at 4 weeks and at 8 weeks.
Experiments
Measurements were performed on an 11.7T MR-system (BioSpec, Bruker) using a 1H-19F dual-channel volume coil with 40mm inner diameter. 1H/19F ZTE images for each rat leg were acquired with TR=2ms, image resolution=0.31mm3/1.25mm3, 1averages/32averages and FA=2°/4° in less than 7mins/14mins.
Data Analysis
The 19F signals in rat legs as well as in the control sample were quantified in MRIcro software. Regions of interest (ROIs) were manually outlined. 19F signal per ROI was quantified through multiplying the mean pixel intensity by the pixel number of the ROI and slice thickness.5 The total 19F amount was then summed over slices and expressed in arbitrary units (a.u.). For each leg, the 19F signals at three time points were corrected by normalizing the quantified 19F signals of the control sample at 4 and 8 weeks to the one at day 0.
Pearson correlation (SPSS) was used to evaluate the correlation between the normalized 19F signals and the CPC volumes in each rat leg across three time points. These volumes were estimated from corresponding images acquired by CT (details not shown).
Results
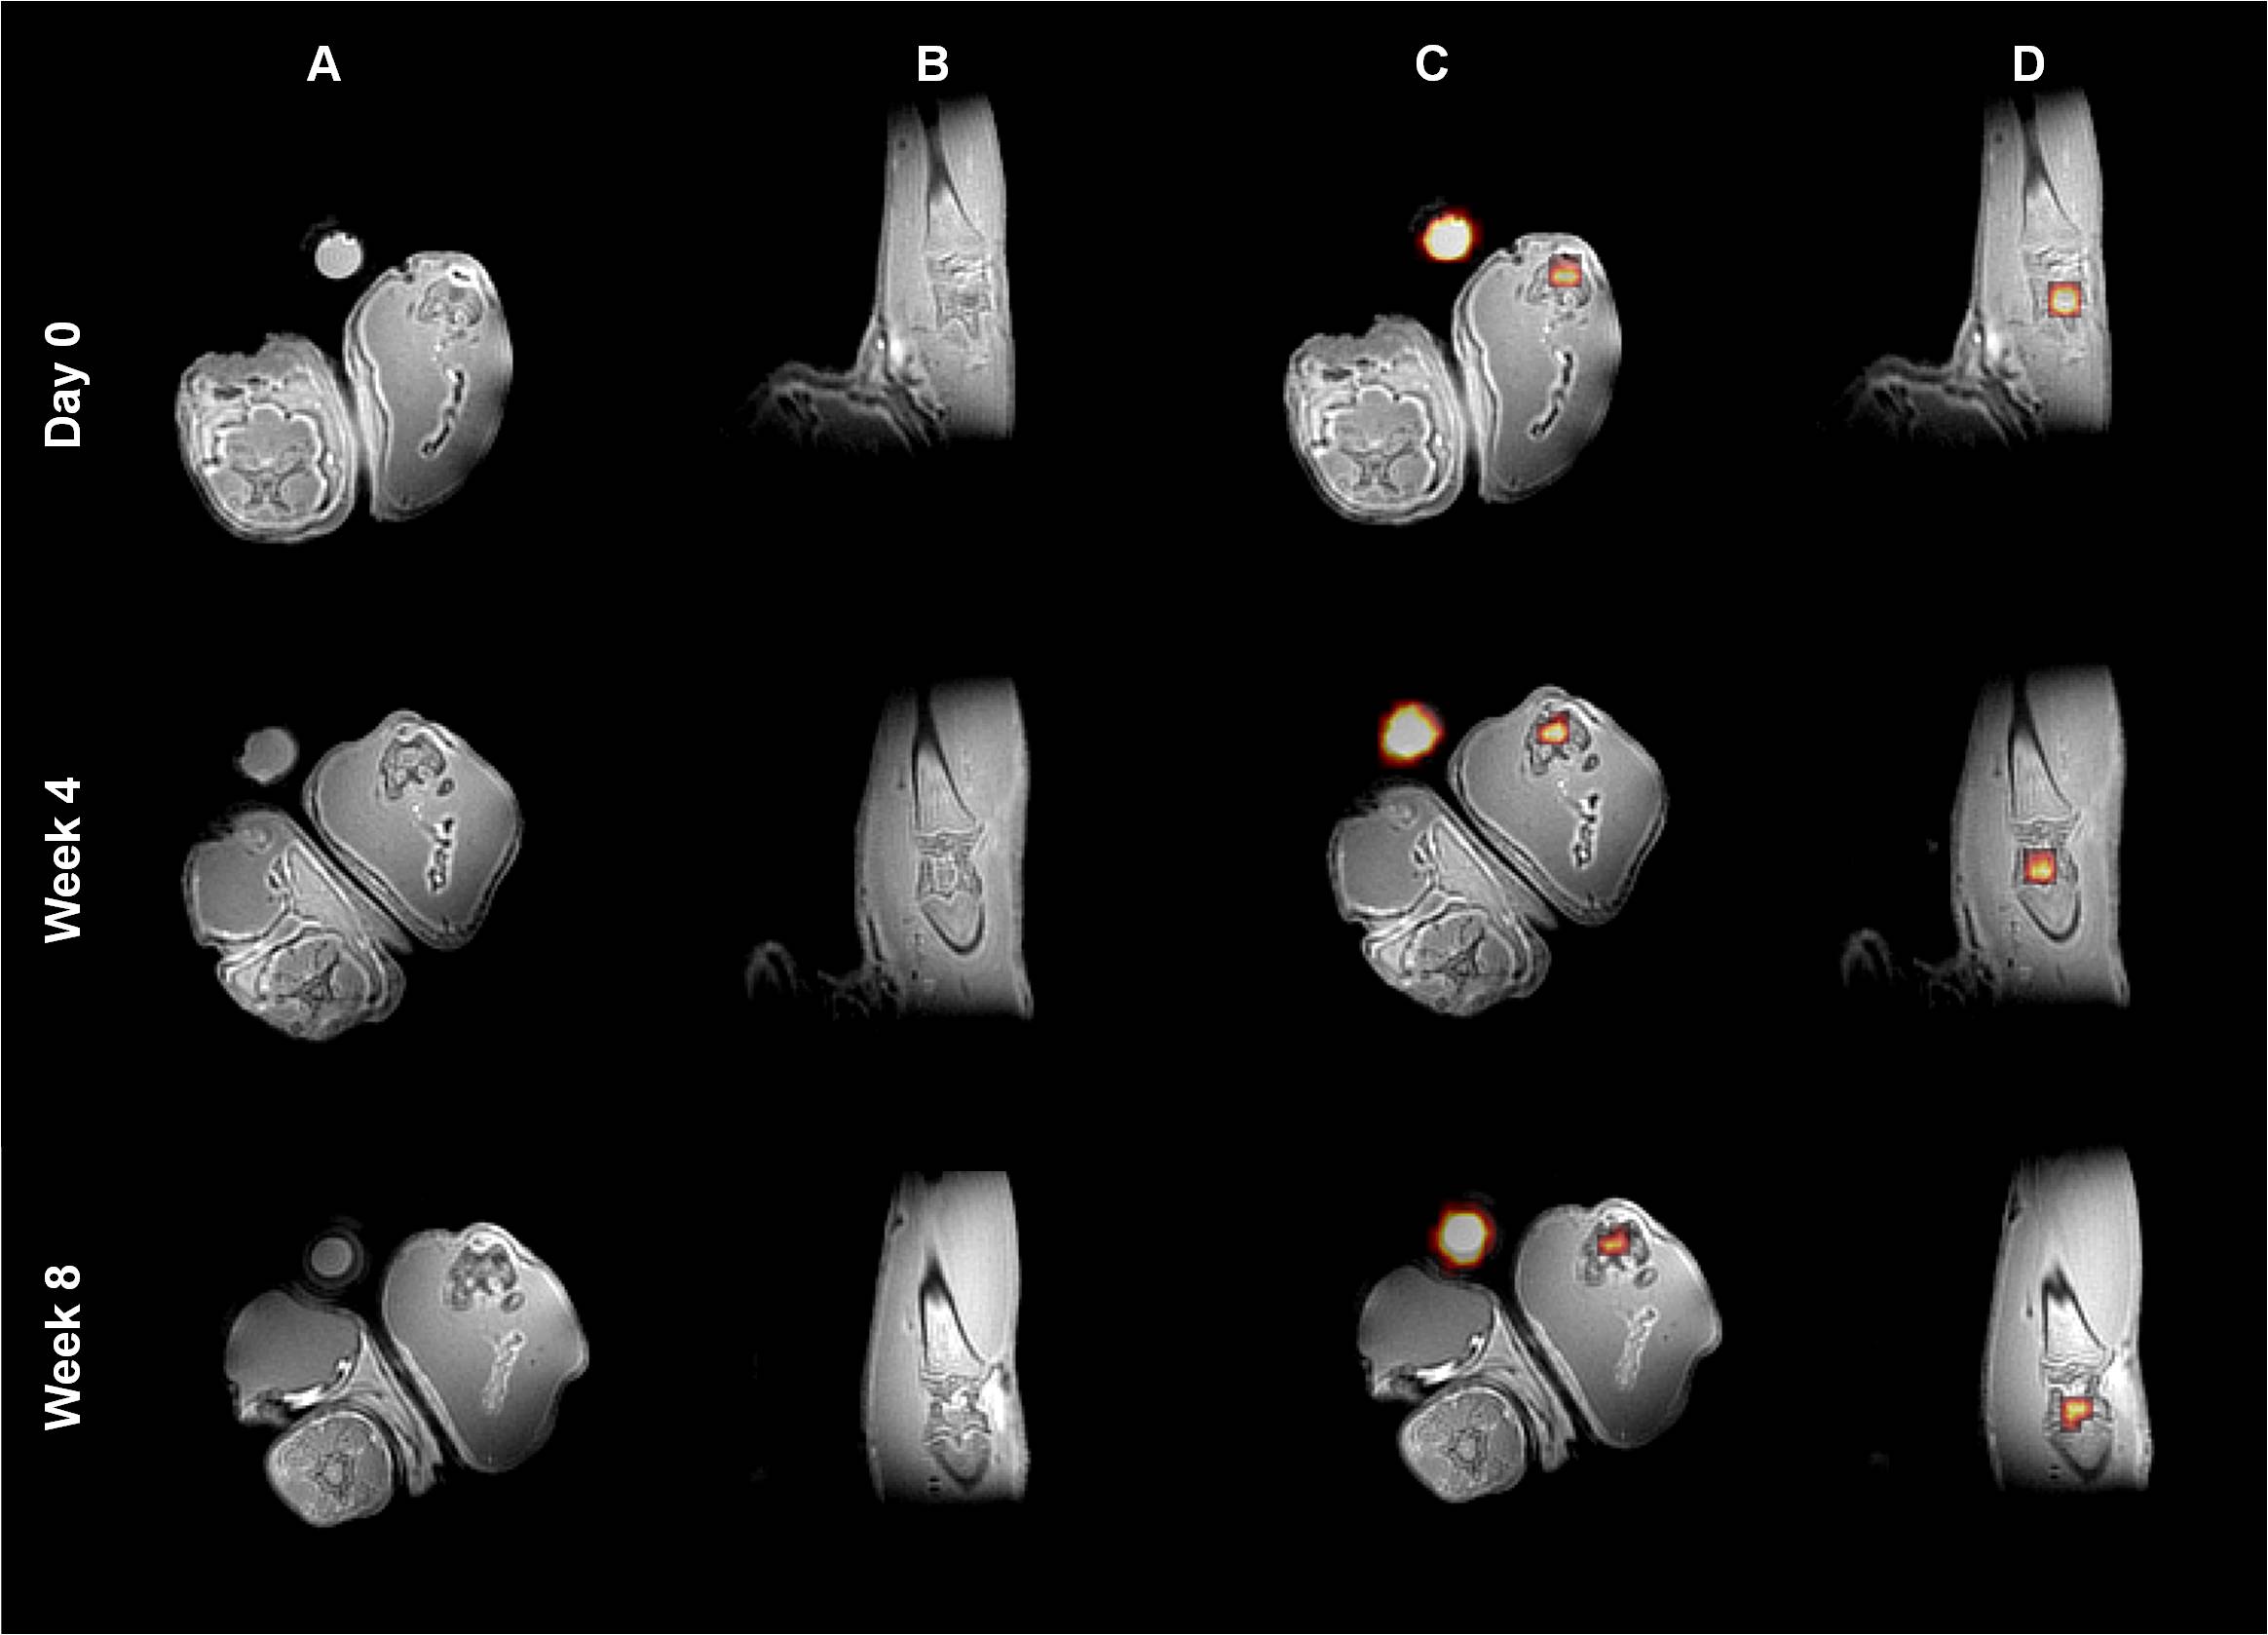
On 1H ZTE images, CPC cannot be differentiated from bone in the rat legs in vivo (Fig.1A,B). However, in 19F ZTE images the PFCE in CPC becomes visible and overlaying the 19F on 1H ZTE images enables a proper sample evaluation (Fig.1C,D).
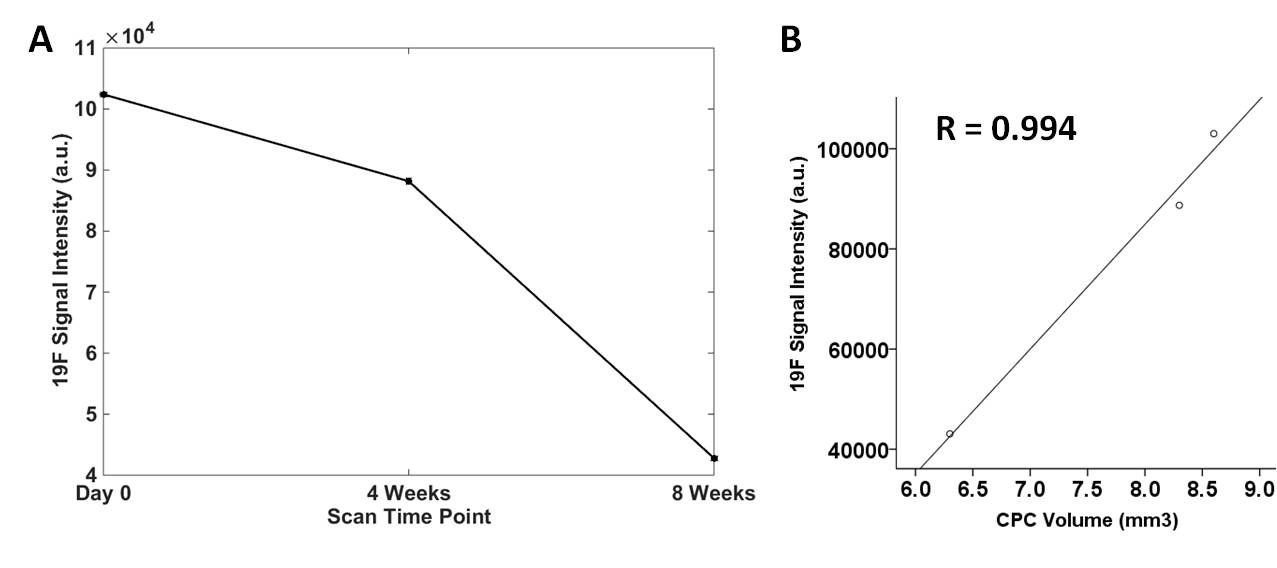
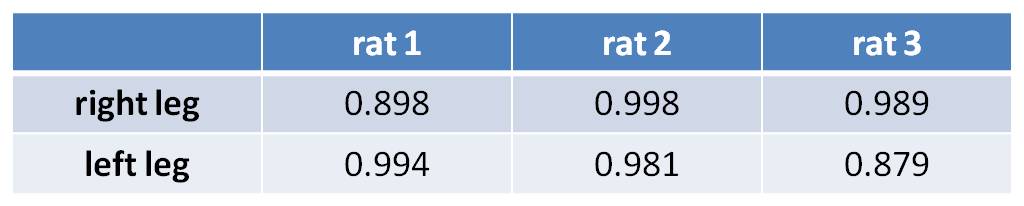
The 19F signals in CPC decreased from day 0 to 8 weeks, reflecting the in vivo degradation of CPC over time (Fig.2A). A strong linear relationship between the normalized 19F signals and the estimated CPC volumes across three time points was found (Fig.2B). This strong relationship was confirmed for CPC implants in the other rat legs by high Pearson correlation coefficients (Table 1; mean: 0.957±0.05).
Discussion and conclusion
We demonstrated that the combination of 1H and 19F ZTE MR imaging is a powerful way to monitor qualitatively and quantitatively the fate of 19F labeled CPC material implanted in bone defects, in vivo. Confirming similar findings for in vitro and ex vivo samples,3 CPC cannot be distinguished from bone by 1H MRI only, which is due to similar relaxation properties.1 The decrease of the quantified 19F signals in rat legs from day 0 to 8 weeks and the strong correlation with the remaining CPC volumes, indicate that the degradation of CPC material in bone can be followed in vivo by 19F MRI.Acknowledgements
This project is supported by FP7-PEOPLE-2013-ITN under grant no 607868 (iTERM).References
1. Sun, Y. et al. Zero echo time magnetic resonance imaging of contrast-agent-enhanced calcium phosphate bone defect fillers. Tissue Eng Part C Methods. 2013;19(4):281-7.
2. Srinivas, M. et al. (19)F MRI for quantitative in vivo cell tracking. Trends Biotechnol. 2010;28(7):363-70.
3. Dou, W. et al. 19F ZTE MR Imaging of 19F labeled calcium phosphate cement at 11.7T. Proc. ISMRM Congress. 2016;p. 3877.
4. Srinivas, M. et al. Customizable, multi-functional fluorocarbon nanoparticles for quantitative in vivo imaging using 19F MRI and optical imaging. Biomaterials. 2010;31(27):7070-7.
5. Srinivas, M. et al. In vivo 19F MRI for cell tracking. J.Vis.Exp. 2013;(81):e50802.
Figures