3782
CEST and NOE signals in ischemic stroke at 9.4T evaluated using a Lorentzian multi-pool analysis: a drop, an increase or no change?1Department of Mechatronics and Biomedical Engineering, Universiti Tunku Abdul Rahman, Kajang, Malaysia, 2Cancer Research UK & Medical Research Council Oxford Institute for Radiation Oncology, Department of Oncology, University of Oxford, United Kingdom, 3School of Medicine, Faculty of Health, University of Tasmania, Australia, 4Acute Stroke Programme, Radcliffe Department of Medicine, University of Oxford, United Kingdom, 5Department of Engineering Science, Institute of Biomedical Engineering, University of Oxford, United Kingdom
Synopsis
CEST and NOE effects in ischemic stroke at 9.4T were studied using a Lorentzian multi-pool approach. It was found that both the CEST and NOE signals had significant changes in region of acute ADC reduction when compared with contralateral tissue. The contrast or relative values to the contralateral tissues of MTRasym(3.5 ppm) was found to correlate moderately strongly with the relative amide signal at 3.5 ppm but not the relative reference signal at –3.5 ppm, suggesting that it is should be used in the group analysis in a population-wide basis to assess the change of APT in the ischemic stroke.
Purpose
Chemical exchange saturation transfer (CEST) and nuclear Overhauser enhancement (NOE) signals have been reported might provide diagnostically useful information in acute stroke1-5. For the CEST effect at the positive offsets; amide proton transfer (APT) at 3.5ppm has been observed to drop significantly2, whereas the amine proton effect at 2ppm was reported to increase5, but a more recent study did not see the latter effect1. The effects of NOE at -3.5ppm have been reported to increase significantly, decrease significantly and show no significant change, depending on the saturation power, imaging time and quantification method used1-4. In one study that investigated specifically the effect of NOE at -1.6ppm in the ischemic region, the NOE(-1.6ppm) was found to drop significantly compared to the contralateral tissue1 whereas the majority of the previous studies mainly concluded no significant change at this offset2-4. In this work, a study of CEST and NOE at a range of different offsets in ischemic stroke were conducted to investigate whether the signals increase, decrease or have no significant change, and to study the correlation between MTRasym(3.5ppm) and the CEST and NOE signals.Methods
The study was approved by local ethics and institutional committees and conducted according to the Animal (Scientific Procedures) Act, 1986 (UK). The middle cerebral artery (MCA) of three animals was occluded via intraluminal suture method and immediately scanned at 9.4T (Agilent Technologies). Diffusion weighted imaging was performed and the apparent diffusion coefficient (ADC) was calculated using b values of 0 and ~1000s/mm2. Single slice CEST image was acquired in the cerebral region which showed substantial ADC deficit. The CEST experiment was performed using 175 Gaussian pulses with flip angle of 180°, pulse duration of 13ms and 50% duty cycle each per frequency offset; the pulsed saturation was performed at 63 frequency offsets from -10 to 10ppm with uneven sampling intervals. A mask was manually drawn based on the region of ADC reduction to represent infarcted tissue and a contralateral mask was selected approximately the same size and tissue type as the infarcted mask. Six pools of Lorentzian equations were used to fit the collected z-spectra1,6, namely: water and conventional magnetization transfer (MT) centred at 0ppm, amide protons at 3.5ppm, amine protons at 2ppm, and NOE pools at –1.6 and –3.5ppm. Two-tailed t-tests were performed between the MTRasym(3.5ppm) and fitted amplitudes of each Lorentzian pool in ischemic and contralateral region, respectively, at 1% significance level. The Pearson correlation coefficient between contrast of MTRasym(3.5ppm) and fitted amplitudes of each exchange pool, (Sischemic–mean(Scontra))/mean(Scontra), where Sischemic refers to the signal in the infarcted region and Scontra is the signal in the contralateral tissue, was calculated. The contrast or relative values were used to enable composite pixel-wise comparison across all the animals.Results
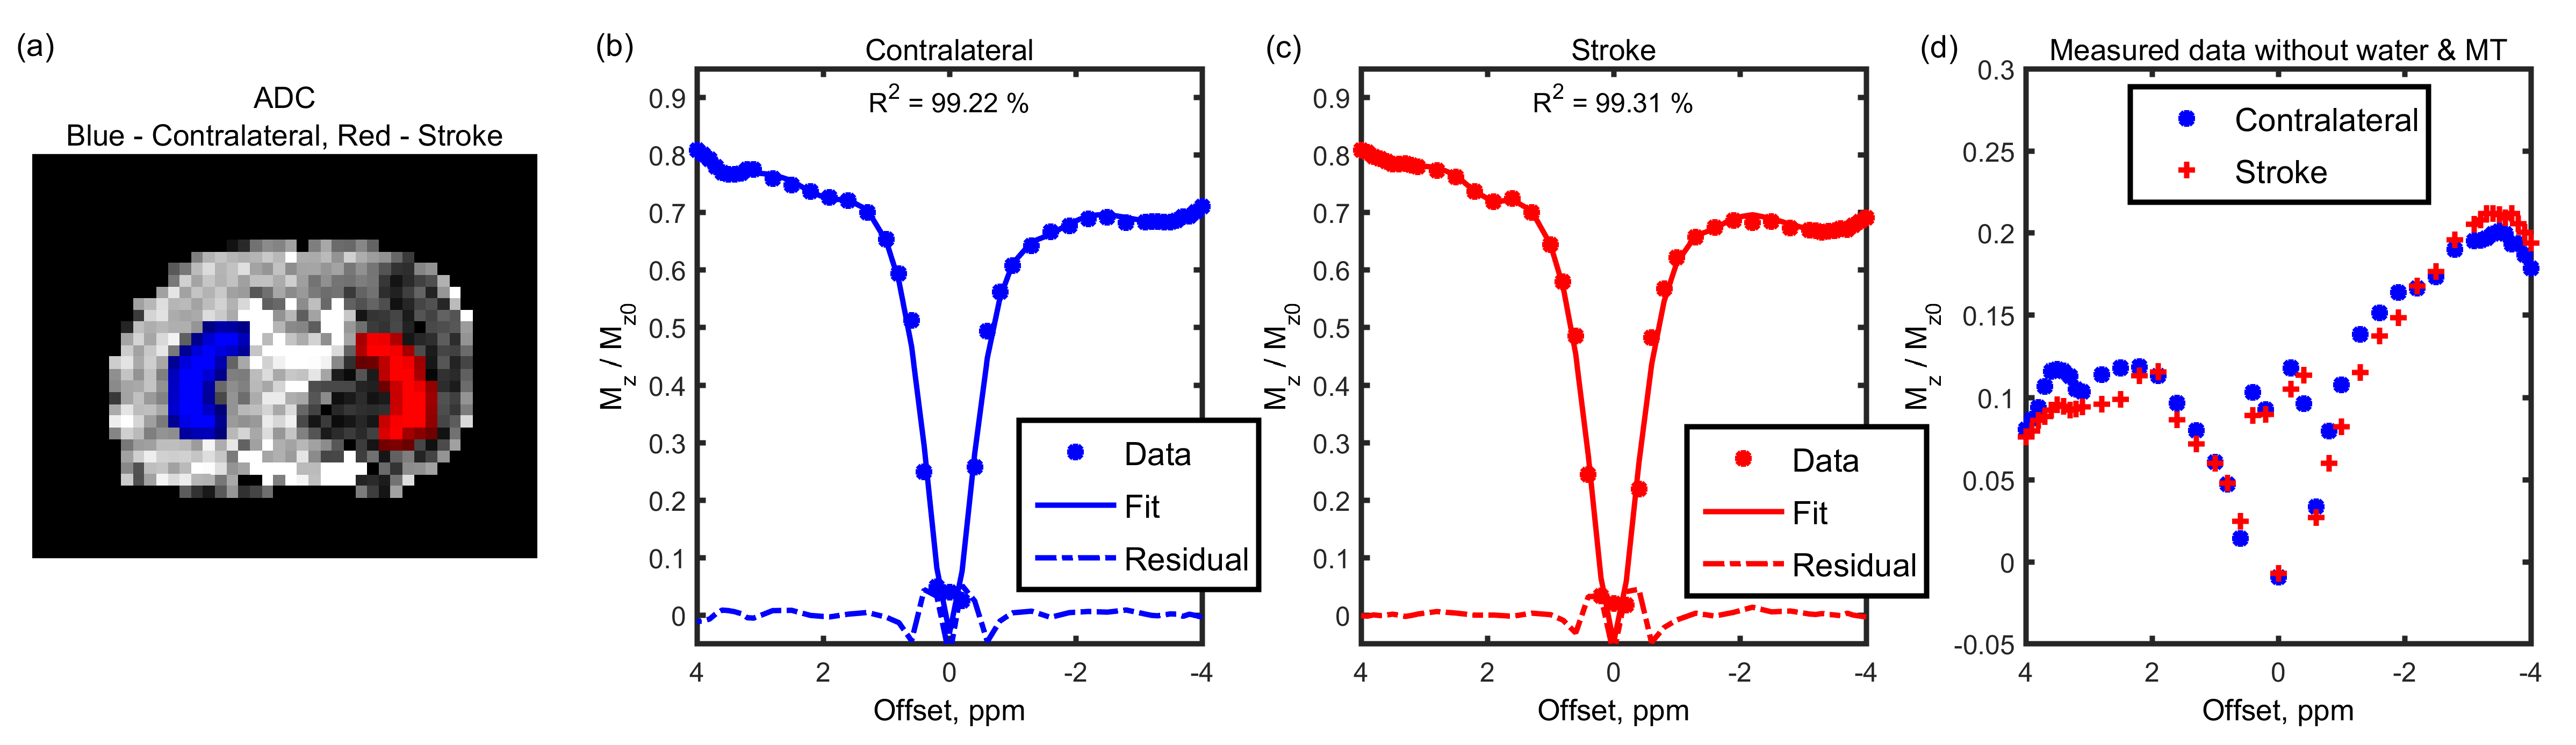
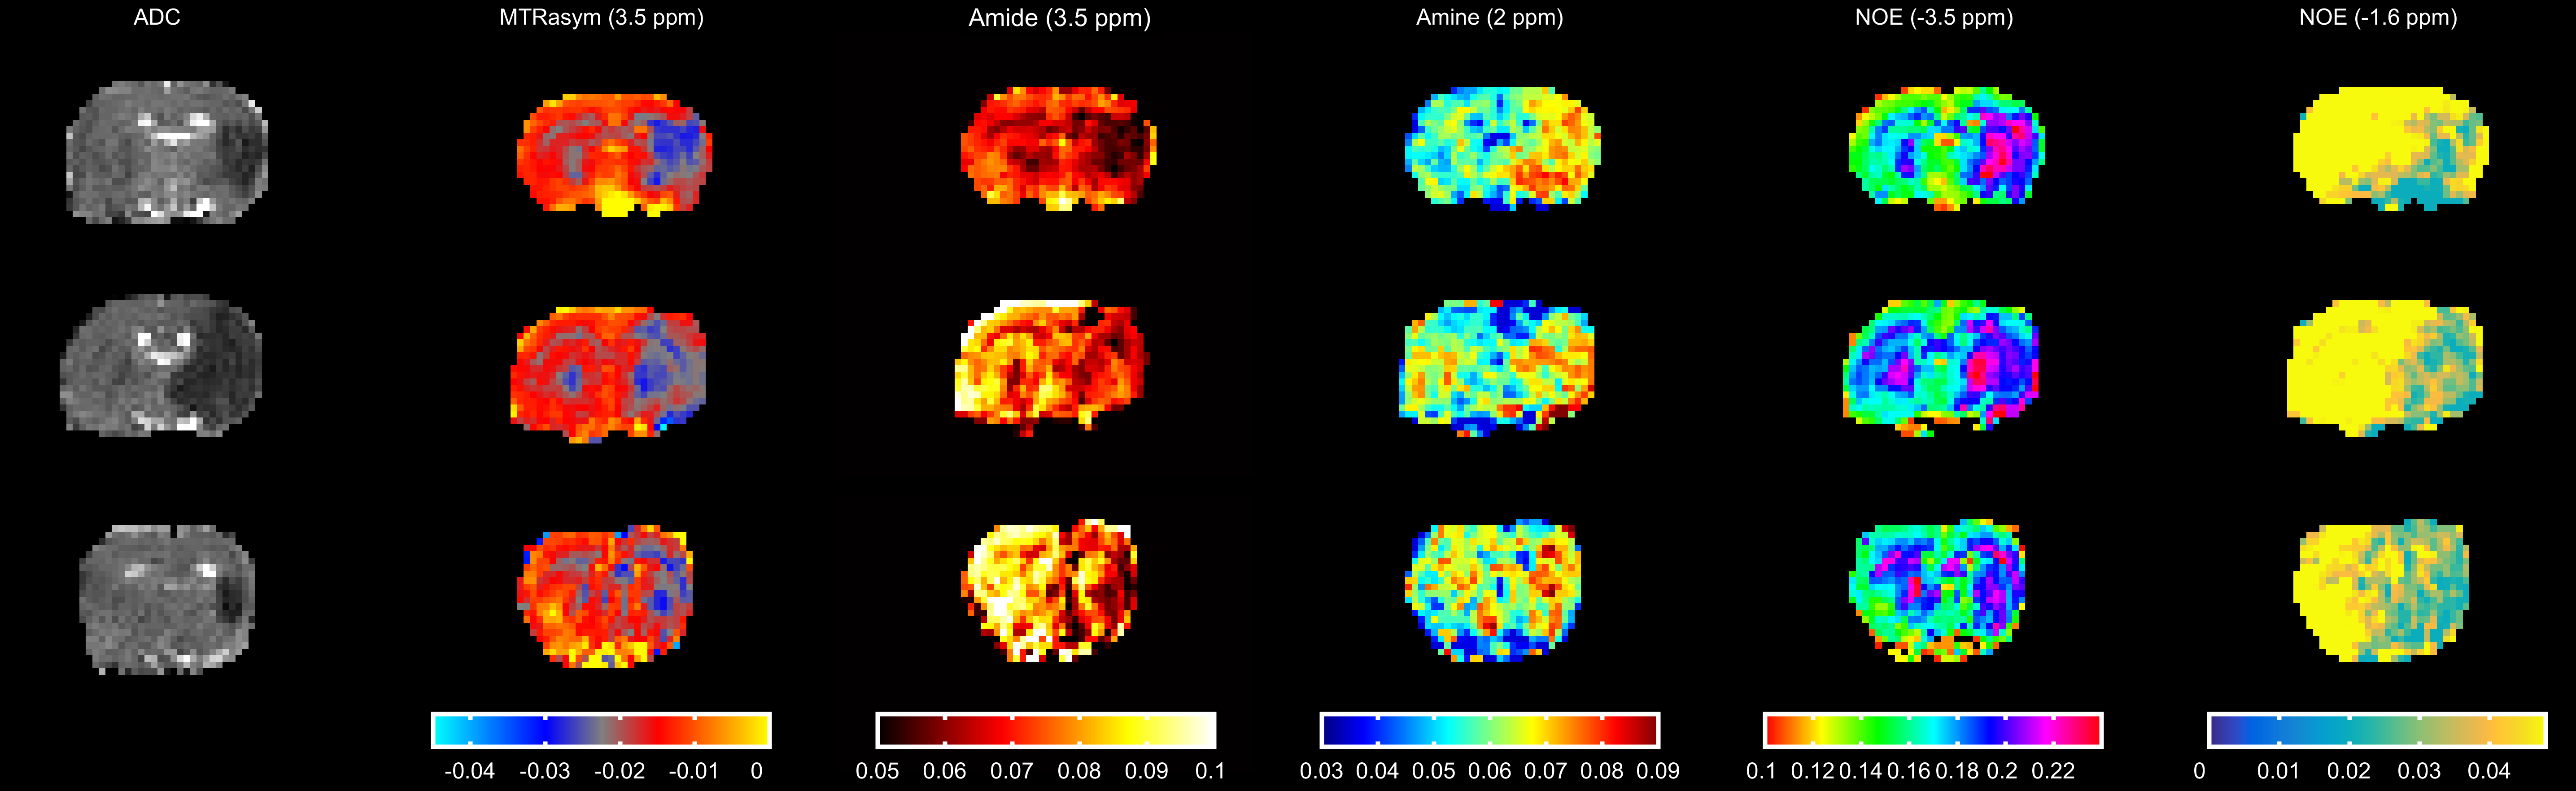
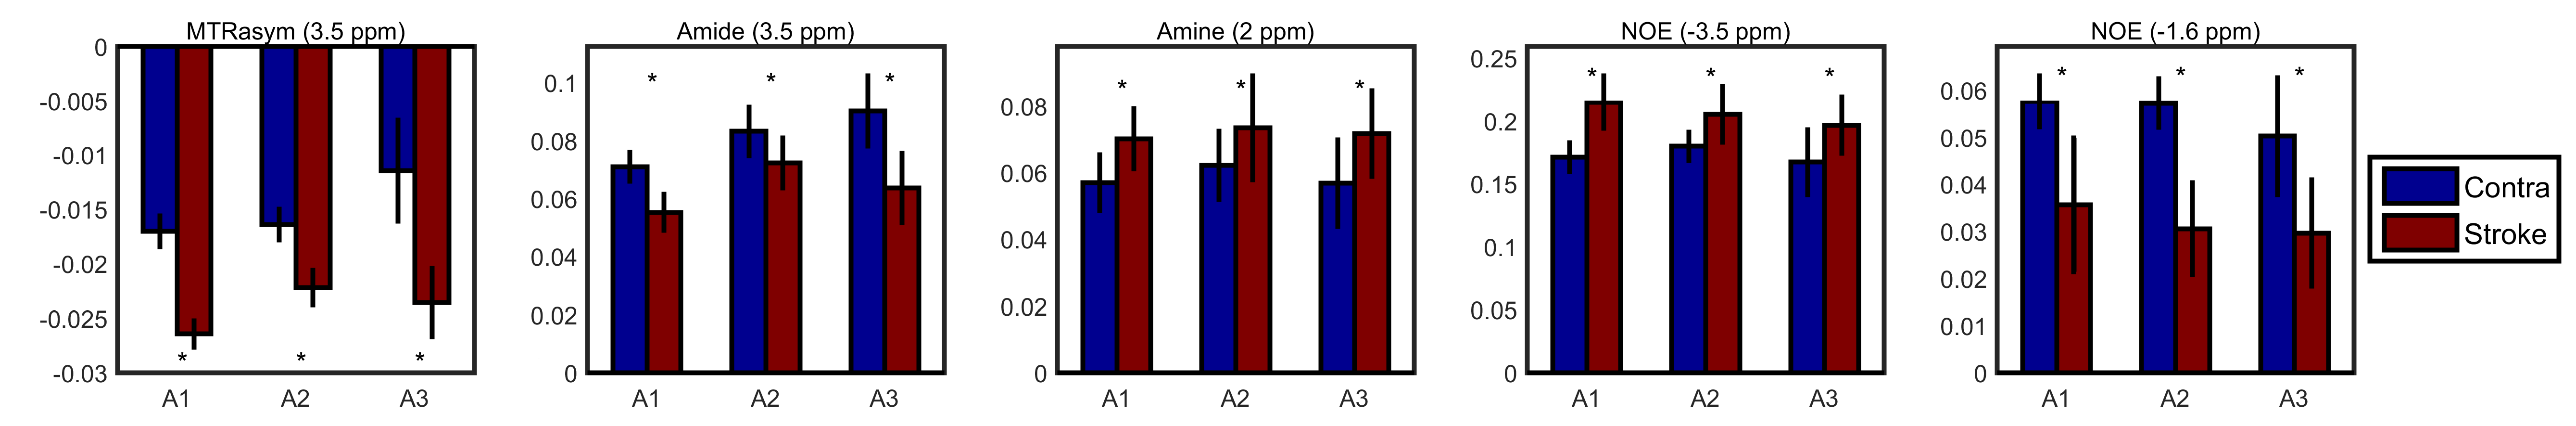
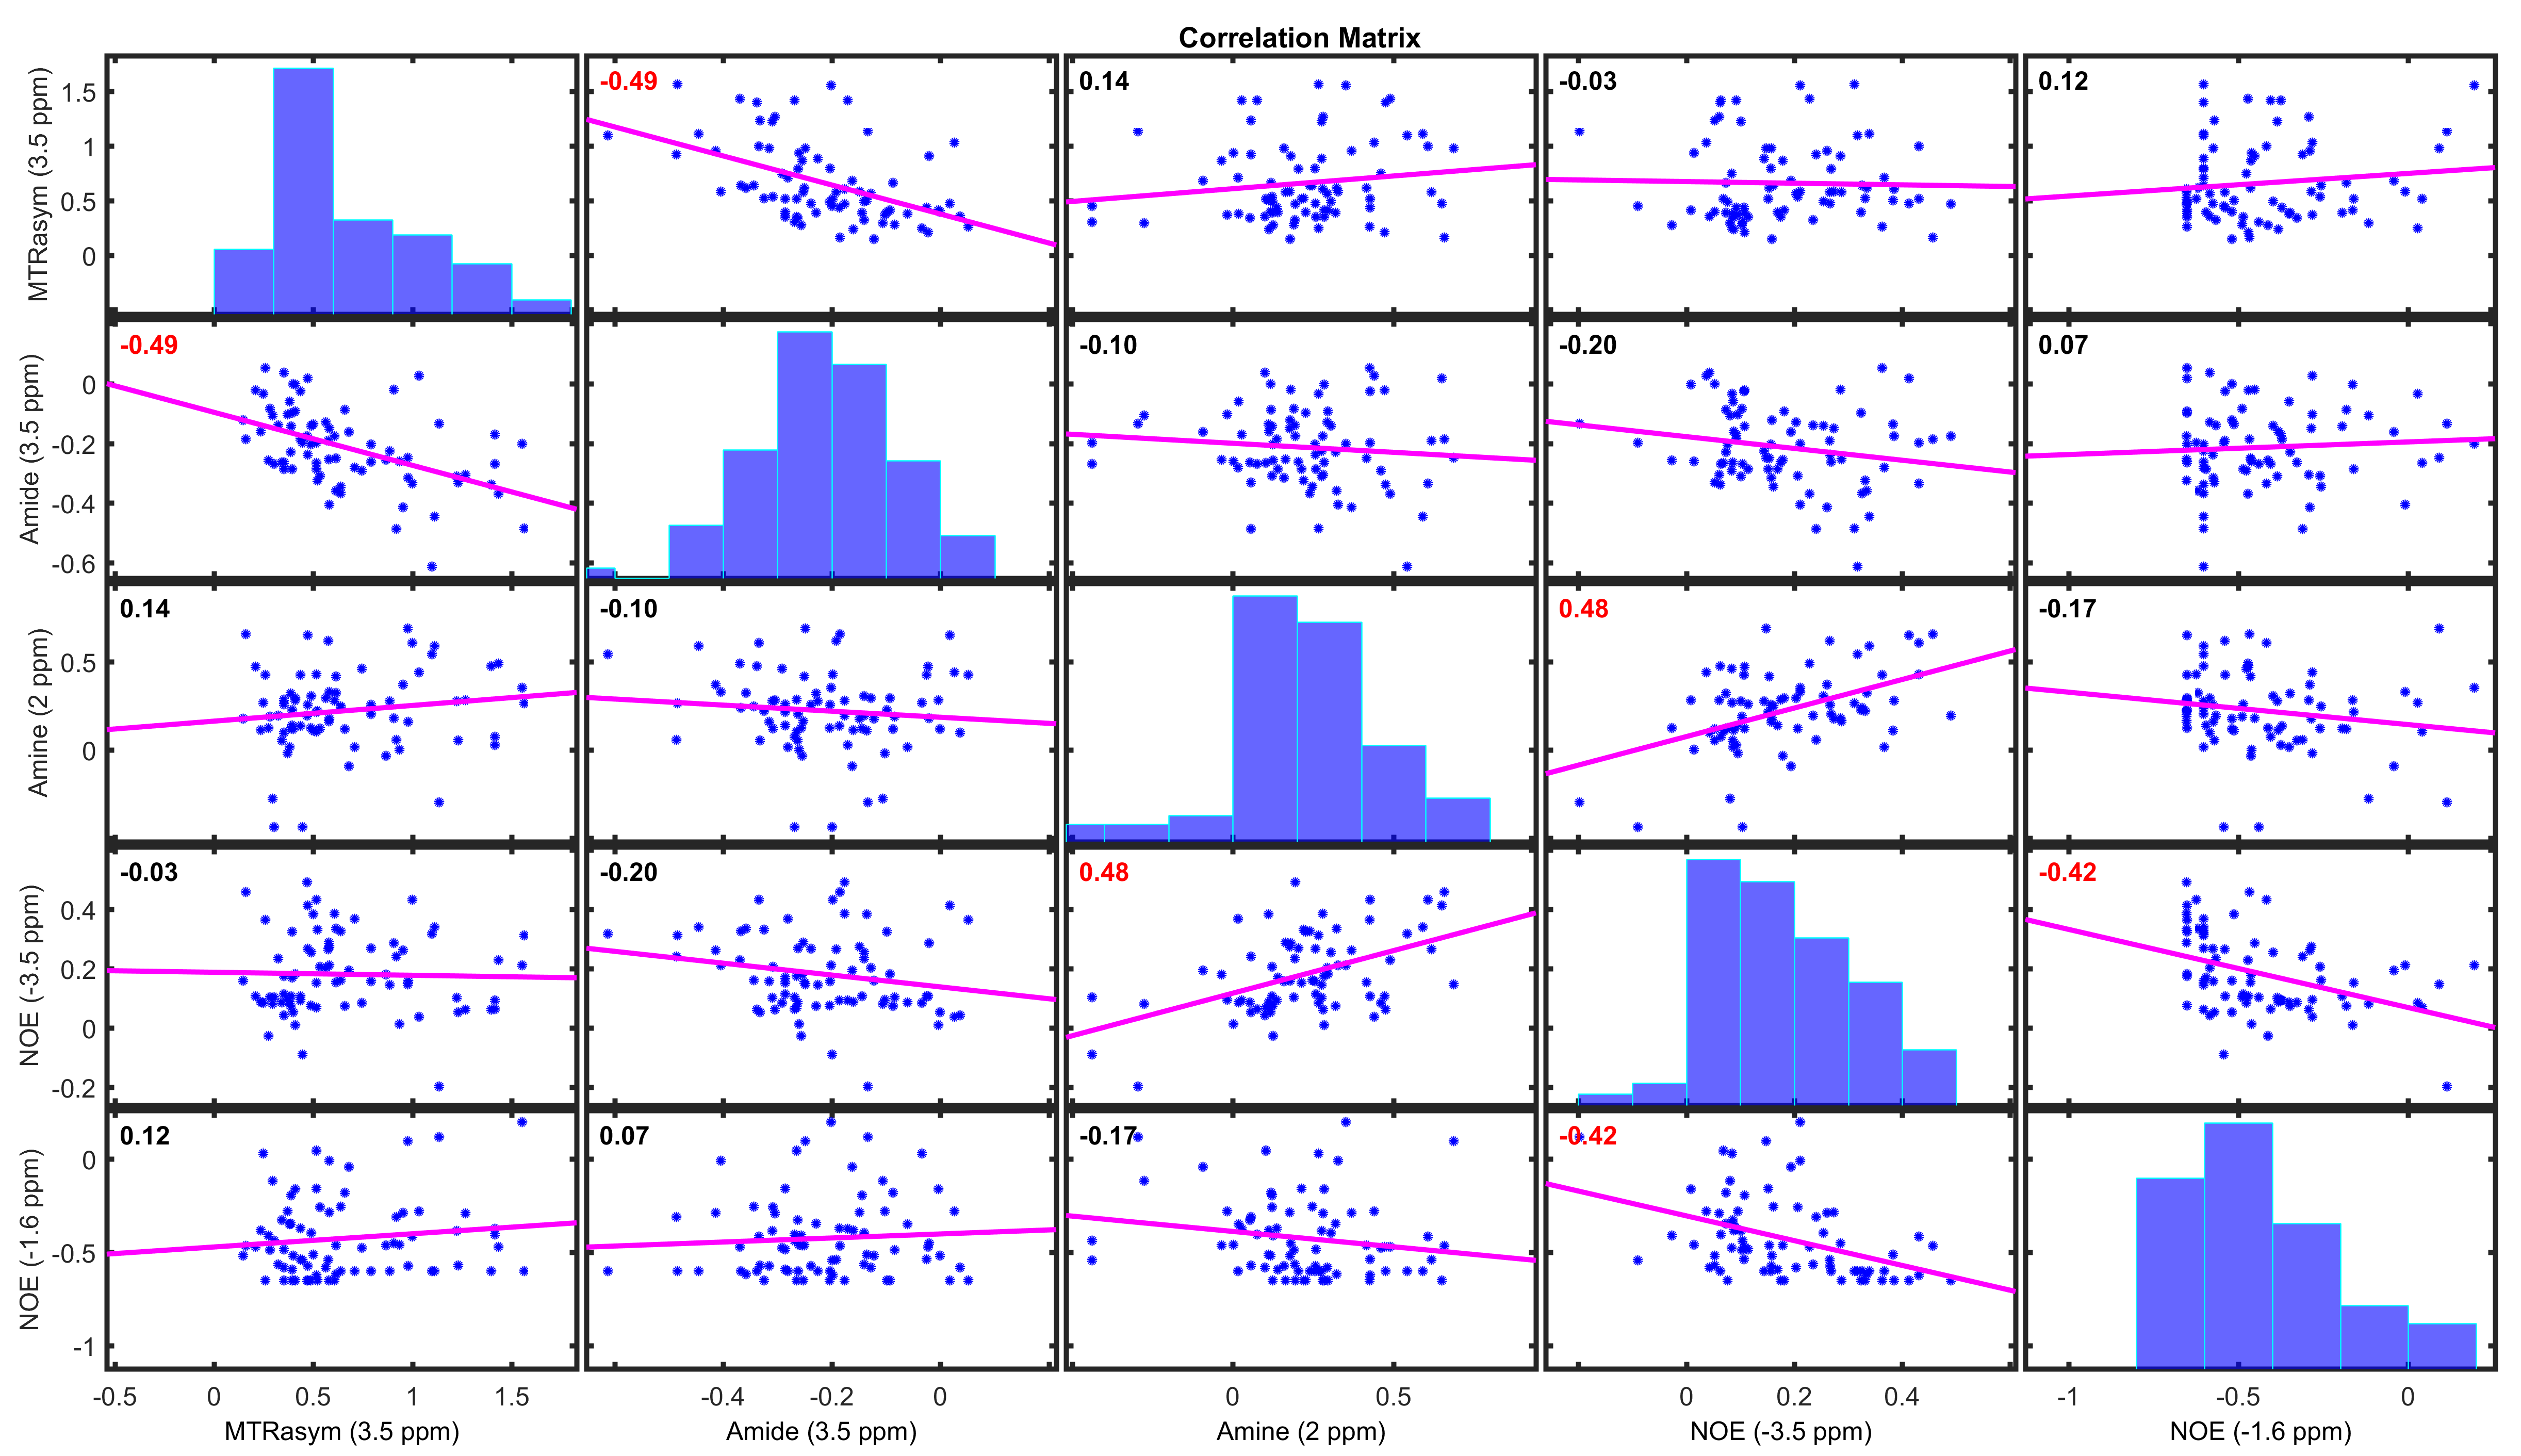
Figure 1 shows the average z-spectrum and its fits in the infarcted and contralateral region of a representative animal; very good fits were obtained using six Lorentzian pools (R2>99%). The pure CEST and NOE effects, by subtracting the fitted water and MT pool parameters from the collected data, are shown in Figure 1(d). The ADC map, MTRasym(3.5ppm) and fitted amplitudes of each pool are shown in Figure 2; clear asymmetrical signals in the ischemic region were observed. The MTRasym(3.5ppm) and fitted amplitudes of amide and NOE(-1.6ppm) pool were found to be lower in the ischemic region when compared to the contralateral tissue, whereas the amplitudes of amine and NOE(-3.5ppm) pool were higher; significant differences were found for all investigated signals as shown in Figure 3. Moderately strong correlations were found between the contrast of MTRasym(3.5ppm) and amide(3.5ppm), amine(2ppm) and NOE(-3.5ppm), and NOE(-1.6ppm) and NOE(-3.5ppm); no correlation was seen for other contrast combinations (Figure 4).Discussion
One possible explanation for the inconsistency in the literature is that the CEST and NOE signals across different animals are grouped and analysed directly. Although all animals undergo the same procedure, the magnitudes of change in the CEST and NOE signals in the ischemic region may vary markedly between animals due to biological variability and severity of the ischemic injury, as evidenced by Figure 3. Since the contrast of MTRasym(3.5ppm) is found to correlate moderately strongly with the relative change of APT, but not relative change of NOE at -3.5ppm, it should be used for future APT group analysis across the population instead of direct magnitude change in the ischemic model. Further work is required to investigate other reasons that might contribute to the inconsistency to enable inter-centre comparison and to study how the CEST and NOE signals are affected by stroke progression and treatment.Acknowledgements
This work was funded by Cancer Research UK (grant number C5255/A15935), the CRUK & EPSRC Cancer Imaging Centre in Oxford (grant number C5255/A16466). K.J.R. was funded by a Medical Research Council studentship (MC_ST_U13080) and supplementary award (MR/K501256/1). Y.K.T. is funded by the UTAR Research Fund (UTARRF) and previously by the Wellcome Trust (grant number WT088877/Z/09/Z).References
1. Zhang X, Wang F, Afzal A, Xu J, Gore JC, Gochberg DF, Zu Z. A new NOE-mediated MT signal at around− 1.6 ppm for detecting ischemic stroke in rat brain. Magn Reson Imaging 2016;34(8):1100-6.
2. Zhou J, Payen J-, Wilson DA, Traystman RJ, Van Zijl PCM. Using the amide proton signals of intracellular proteins and peptides to detect pH effects in MRI. Nat Med 2003;9(8):1085-90.
3. Jin T, Wang P, Zong X, Kim S-. MR imaging of the amide-proton transfer effect and the pH-insensitive nuclear overhauser effect at 9.4 T. Magn Reson Med 2012;69(3):760-70.
4. Li H, Zu Z, Zaiss M, Khan IS, Singer RJ, Gochberg DF, Bachert P, Gore JC, Xu J. Imaging of amide proton transfer and nuclear overhauser enhancement in ischemic stroke with corrections for competing effects. NMR Biomed 2015;28(2):200-9.
5. Jin T, Wang P, Zong X, Kim S-. Magnetic resonance imaging of the amine-proton EXchange (APEX) dependent contrast. Neuroimage 2012;59(2):1218-27.
6. Desmond KL, Moosvi F, Stanisz GJ. Mapping of amide, amine, and aliphatic peaks in the CEST spectra of murine xenografts at 7 T. Magn Reson Med 2014;71(5):1841-53.
Figures