3781
Volatility analysis for asymmetry-based CEST/NOE evaluation methods in the presence of multi-pool background systems with MT – Application to creatine CEST1Max-Planck-Institute for Human Cognitive and Brain Sciences, Leipzig, Germany
Synopsis
Here, we aim to demonstrate the effects of complex multi-pool background systems with magnetization transfer (MT) on asymmetry and ratio-based analyses for CEST/NOE experiments. By using creatine in cross-linked BSA as a model, we show effects of background variations on such analyses for creatine CEST (CrCEST) based on experimentally obtained spin system parameters. For changes of up to 50% in background pool fractions, the CrCEST peak was found to change by up to 35% in asymmetry analysis. The necessity of model-based fitting with inclusion of complex background systems in contrast to conventional lineshape-based analysis is outlined.
Purpose
In many clinical examinations, including stroke or cancer, it is of interest to obtain high-resolution information on local metabolite levels. Chemical exchange saturation transfer (CEST)1 and the nuclear Overhauser effect (NOE)2 are well-described tools that employ either proton chemical exchange or dipolar exchange for saturation transfer between solute protons and bulk water. Since both techniques require the acquisition of a series of images for certain offset frequencies, acquisition times are linearly dependent on the number of offset frequencies. Therefore, single offset measurements or asymmetry analysis methods (MTRA)3 are often employed, resulting in a percentage measure of the difference between up- and down-field signals. While this may be feasible in simple model systems, it will be an isufficient approach in the presence of varying additional contributions from magnetization transfer (MT)4. With multi-pool background systems (MPBS), as typically observed in cerebral white matter with broad associated CEST/NOE effects in addition to MT5, asymmetry evaluation methods are even more directly biased, as subsequently demonstrated for creatine CEST (CrCEST).Outline of Content
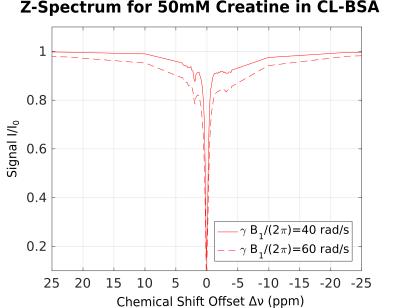
For demonstration of CEST in presence of MPBS, a 50ml phantom with 50mM creatine in 15% (w/w) bovine serum albumin (BSA) and phosphate-buffered saline (PBS) was prepared. 2% (v/v) of 25% glutaraldehyde solution were added to allow cross-linking of the BSA (CL-BSA). The phantom was placed inside a water phantom. CL-BSA is a commonly used tissue-model, similar to white matter5. Its broadened absorption lineshape can be characterized as superLorentzian6,7. In a small chemical shift range, Δν<10ppm from the water resonance, two additional NOE and CEST peaks have been reported5 for inverse Z-spectra analysis (AREX)8. 2D pulsed saturation-prepared FLASH images were acquired, using a MAGNETOM 7T (Siemens, Erlangen, Germany) at 56 offset frequencies (between ± 50ppm) and power levels γB1/(2π) of 40 and 60 rad/s. Other parameters were α=15°, TE=6ms, TR=200ms, 100ms Gaussian saturation pulse, gradient and RF spoiling; edge-in k-space sampling), single 4mm slice; FOV 140x140mm², matrix 160x160. Offset frequencies were pairwise (upfield/downfield from water) randomly shuffled to mitigate asymmetry artifacts in the resulting Z-spectra. Figure 1 shows the full Z-spectrum from a selected voxel, presenting with the same CL-BSA shape, as reported elsewhere.5 For each voxel, MTRA was calculated as in Eq. 1. The result is shown in Figure 2, where effects of MPBS are clearly visible around the sharp creatine CEST peak.
$$ MTRA=\frac{M_z(\Delta \omega)-M_z(-\Delta \omega)}{M_z^0}\qquad (1) $$
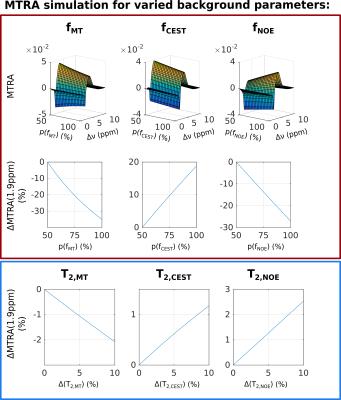
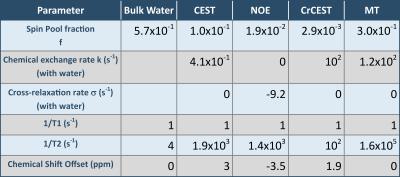
For asymmetry or simple ratio-based analyses, the MTRA peak is fitted by a lineshape function. The underlying MPBS will bias the magnitude and width of that lineshape. In order to illustrate the effects of variation in MT-pool fraction fMT, as well as NOE or CEST peak widths of the background system, a series of Z-spectra was simulated, using a 4-pool model for MPBS and an additional CrCEST pool based on matrix-algebra calculation9,10 (parameters given in Table 1).
Variations of up to 50% in spin pool fractions for all three background pools (MT, CEST and NOE), as reported for human brain tissue,11 resulted in MTRA changes of up to 35% for the CrCEST peak. Since there was no change in the CrCEST pool fraction, the variations shown in Figure 3 directly demonstrate the substantial bias of direct MTRA-based analysis. Further simulations for T2 variations in the MPBS indicated maximal changes of 2.5% in MTRA of CrCEST. Depending on the origin of change, the MTRA of CrCEST will either decrease or increase, due to the different sign of NOE/CEST in MTRA.
Summary
Parameters for the multi-pool background system were obtained by matrix-algebra-based fitting of Z-spectra (as depicted in Fig. 1) demonstrating good agreement with experimental data (Fig. 3). Spin pool fractions and exchange rates are correlated; therefore, higher exchange rates in a parameter set may compensate for low pool fractions and vice versa.
Using creatine in CL-BSA, we could experimentally demonstrate the effects of complex multi-pool background systems on asymmetry and ratio analysis methods for CEST evaluation. Based on the obtained spin system parameters of the MPBS, Z-spectra simulations for different parameter variations were shown, which could further illustrate the challenges in complex systems when background effects are not accounted for during analysis. In cases where time is not strictly constrained, it may be advisable to sample Z-spectra with an underlying offset frequency distribution covering the significant points of the background and employing a model-based analysis for evaluation of CEST effects with respect to a multi-pool background spin system, such as matrix-algebra-based calculation.9,10
Acknowledgements
This work was funded by the Helmholtz Alliance "ICEMED".References
[1] K. M. Ward et al., A New Class of Contrast Agents for MRI Based on Proton Chemical Exchange Dependent Saturation Transfer (CEST), J Magn Reson 143, 79 (2000).
[2] A. W. Overhauser, Polarization of nuclei in metals, Phys Rev 92, 411 (1953).
[3] J. Zhou et al., Using the amide proton signals of intracellular proteins and peptides to detect pH effects in MRI, Nature medicine 9, 1085 (2003).
[4] K. L. Desmond et al., Understanding Quantitative Pulsed CEST in the Presence of MT, Magn Reson Med 67, 979 (2012).
[5] J. Breitling et al., Inhomogeneous magnetization transfer detection by dual frequency CEST spectroscopy, Magn. Reson. Mater. Phys. Biol. Med. 29 (2016).
[6] C. Morrison et al., A Model for Magnetization Transfer in Tissues, Magn Reson Med 33, 475 (1995).
[7] C. Morrison et al., Modeling Magnetization Transfer for Biological-like Systems Using a Semi-solid Pool with a Super-Lorentzian Lineshape and Dipolar Reservoir, J Magn Reson B 108, 103 (1995).
[8] S. Goerke et al., Signature of protein unfolding in chemical exchange saturation transfer imaging, NMR Biomed 28, 906 (2015).
[9] D. K. Müller et al., Matrix-algebra-based calculations of the time evolution of the binary spin-bath model for magnetization transfer, J Magn Reson 230, 88 (2013).
[10] T. Lenich et al., ISMRM Annual Meeting, 3347, (2015).
[11] J. G. Sled et al., Regional variations in normal brain shown by quantitative magnetization transfer imaging, Magn Reson Med 51, 299 (2004).
Figures


