3780
Peak RF Optimization for Baseline Enhancement (PROBE) for CEST/NOE with in-vitro application at 7T1Max-Planck-Institute for Human Cognitive and Brain Sciences, Leipzig, Germany
Synopsis
In CEST/NOE experiments, induced saturation intended for certain metabolites also saturates other moieties, leading to mingled backgrounds in Z-spectra. Precise quantification of endogenous metabolites is impeded by slow acquisition times and confounding background contributions. We present an optimization framework targeting a flattened baseline in Z-spectra, with direct water saturation and non-specific macromolecular contributions fully compensated. Saturation pulse amplitudes as a function of frequency offset were derived using optimal-control-based calculation. Feasibility of this approach is demonstrated in vitro for NOE/CEST in the presence of tissue-like background and accelerated acquisition by distinct offset selection. Experimental results show good agreement with concentration levels.
Purpose
For the detection of low-concentrated solute metabolites, chemical exchange saturation transfer (CEST)1 or nuclear Overhauser effect (NOE)2 are commonly applied. For example, creatine and lactate are important markers of energy metabolism, which appear altered in tumor or stroke3-6. In CEST/NOE, offset RF irradiation saturates solute proton spins, which is transferred to the water resonance as detected by a related signal change. However, in the presence of immobilized macromolecules, the Z-spectrum presents with broadened RF absorption lineshapes due to magnetization transfer (MT).
Several approaches, such as AREX7 or magnetization transfer asymmetry (MTRA) analysis, aim to remove those mingled background contributions to extract the desired metabolite peak for quantification. While direct water saturation (DWS) is symmetric in Z-spectra, contributions from macromolecular background and mingled NOE/CEST effects appear asymmetric.
Consequently, reliable quantification requires inherent compensation of confounding background contributions. Especially in living tissues, where a large diversity of exchanging groups is present, asymmetric contributions need to be accounted for.
The feasibility of suppressing DWS in Z-spectra was recently shown by Clark et al.8, who proposed a method to apply linearly varied irradiation CEST (vCEST). Starting from this approach, we introduce a refined method, with peak RF optimization for baseline enhancement (PROBE), leading to a completely flattened baseline of the Z-spectrum. Its practicability is demonstrated in vitro using cross-linked bovine serum albumin samples (CL-BSA) as tissue model9,10.
Methods
50ml tubes with 50mM creatine and different sodium lactate concentrations (0, 15, 25, 40, 80mM) in 15% (w/w) BSA and phosphate-buffered saline (PBS) were prepared. 2% (v/v) of 25% glutaraldehyde solution were added for cross-linking.
MR Imaging was performed on a MAGNETOM 7T (Siemens, Erlangen, Germany) using a 32-channel head coil. 2D saturation-prepared FLASH images were acquired with α=15°, TE=6ms, TR=200ms, 100ms Gaussian saturation pulse, gradient and RF spoiling, edge-in k-space sampling, nominal resolution 0.9x0.9x4mm³. Offset frequencies were pairwise (up-/downfield from water) randomly shuffled to mitigate asymmetry artifacts in the Z-spectra.
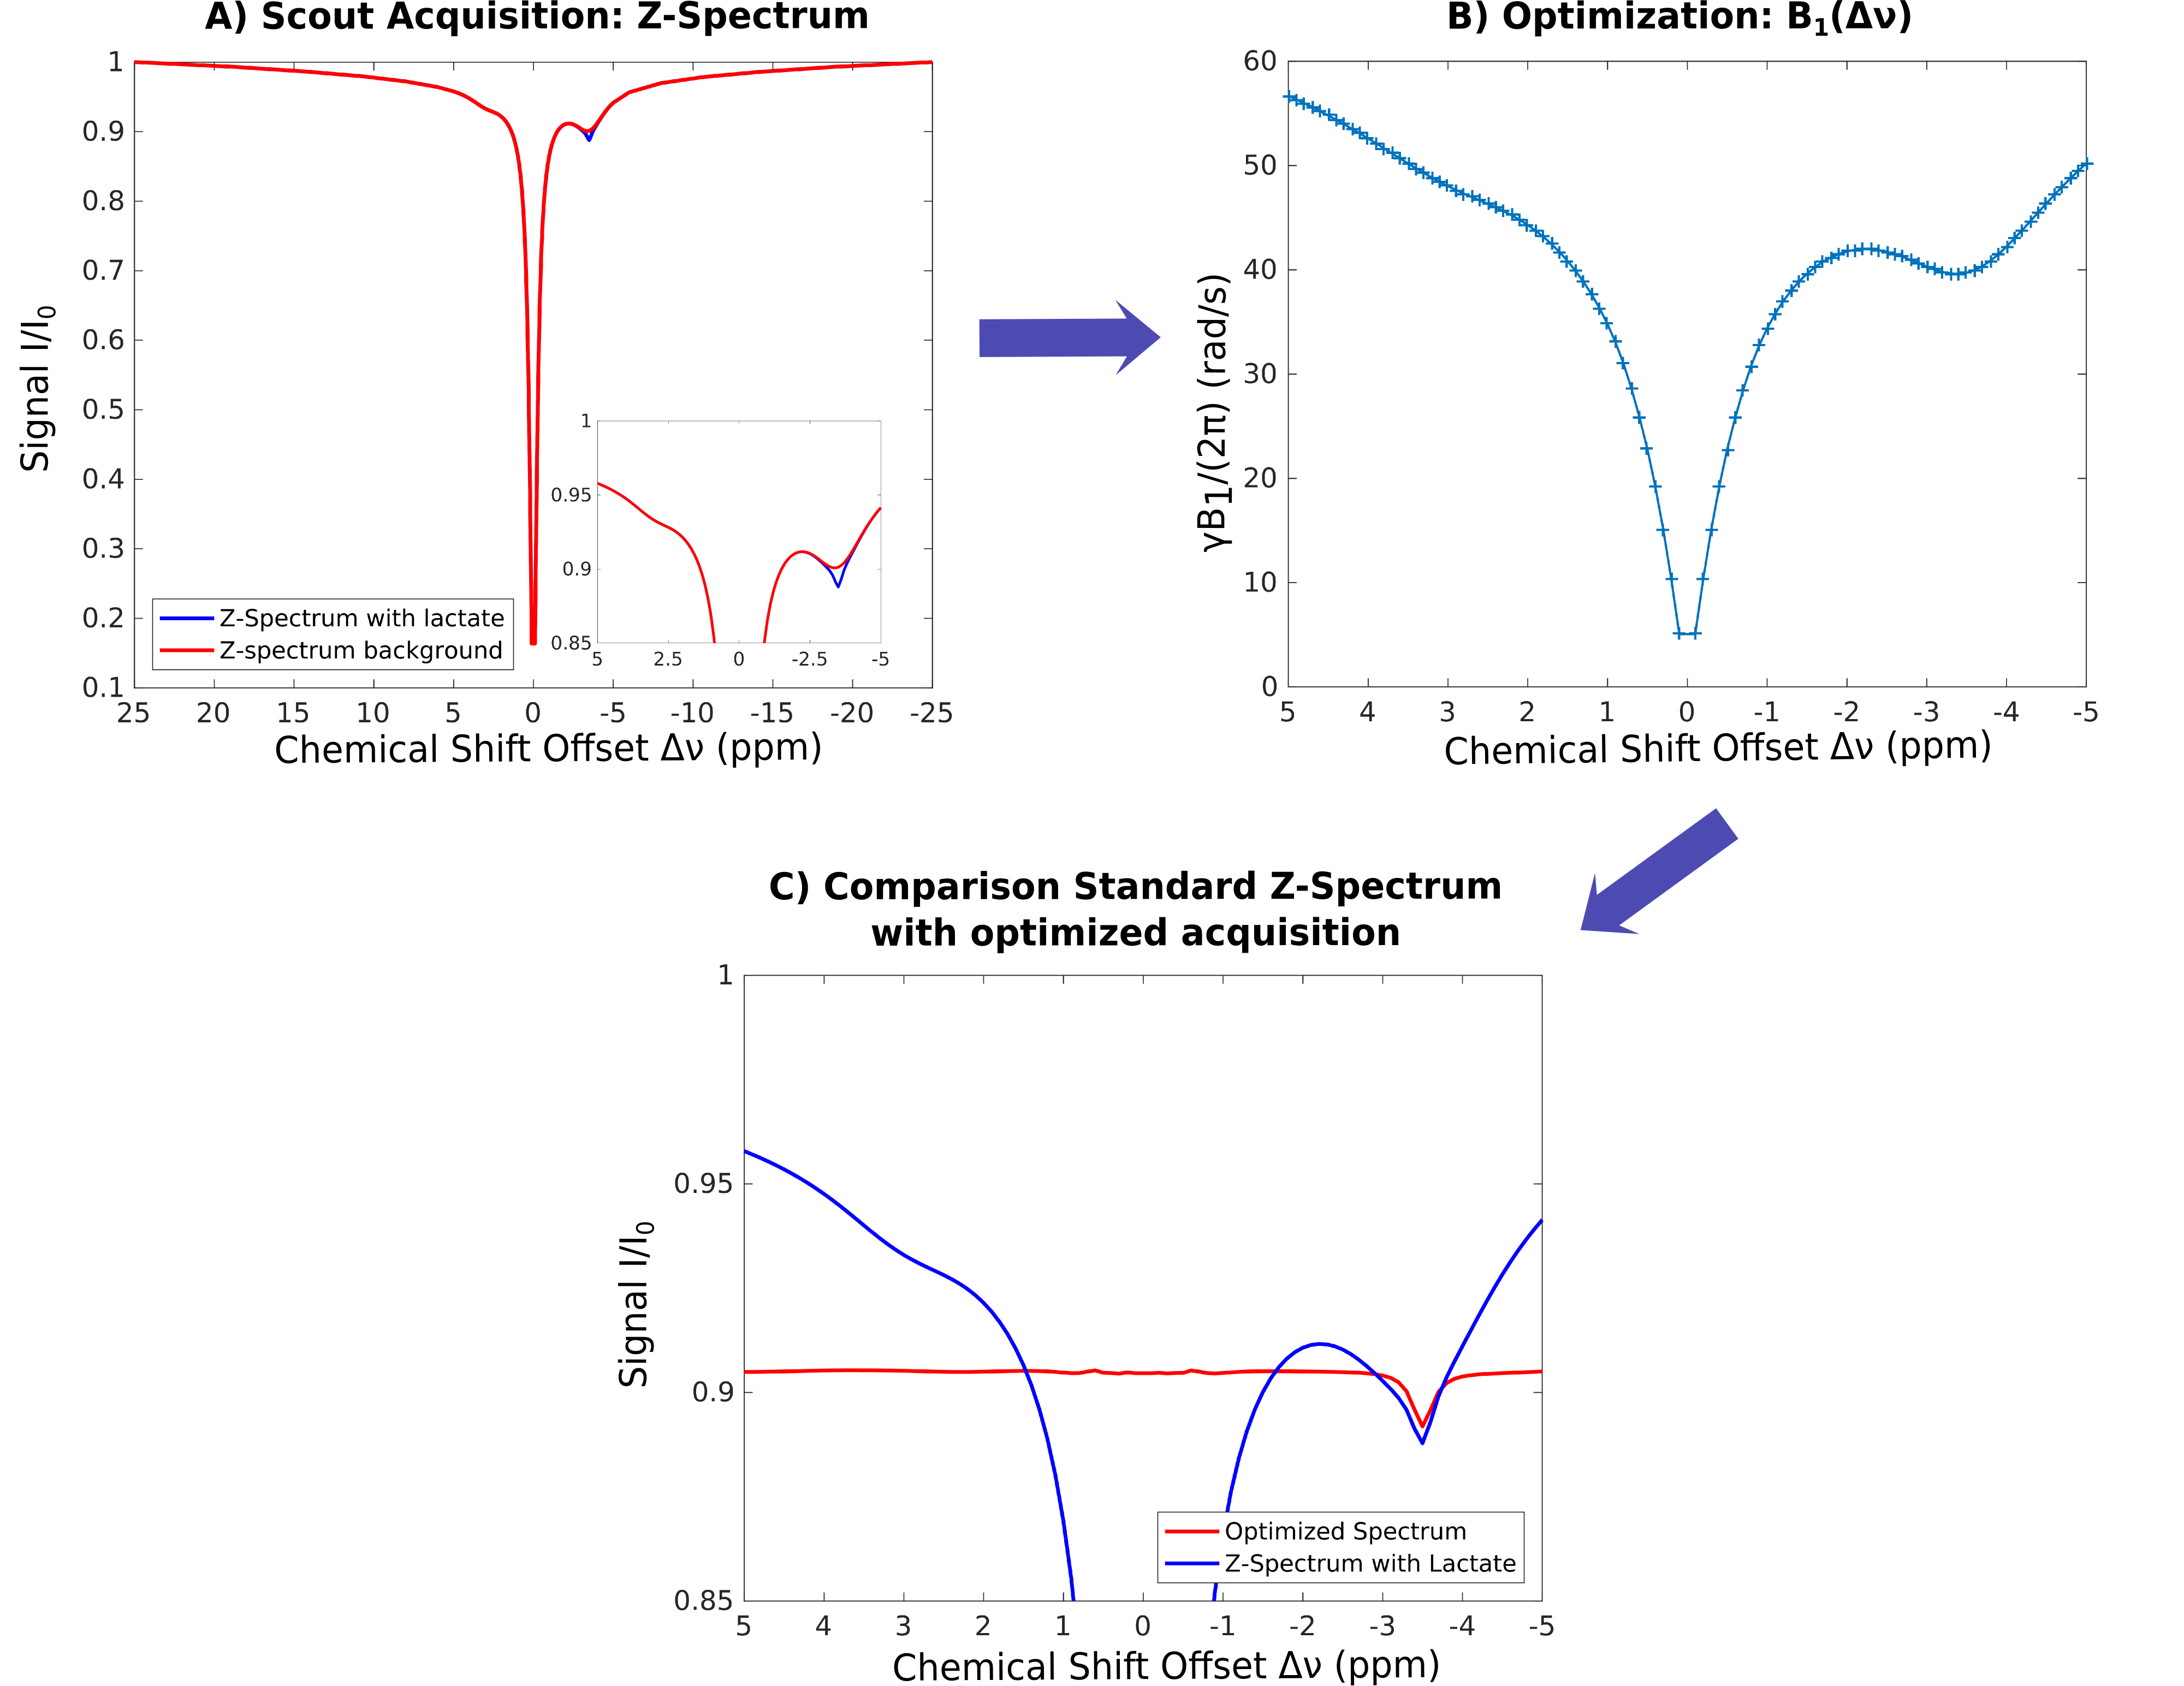
Constant–saturation-power-prepared scout images were acquired for γB1/(2π)=40,60rad/s, with the frequency range covering the MT absorption line shape (±50ppm). The macromolecular contributions and DWS were modeled using a 4-pool model. Model parameters were fitted to the B1+-corrected scout data using matrix-algebra-based calculation.11,12
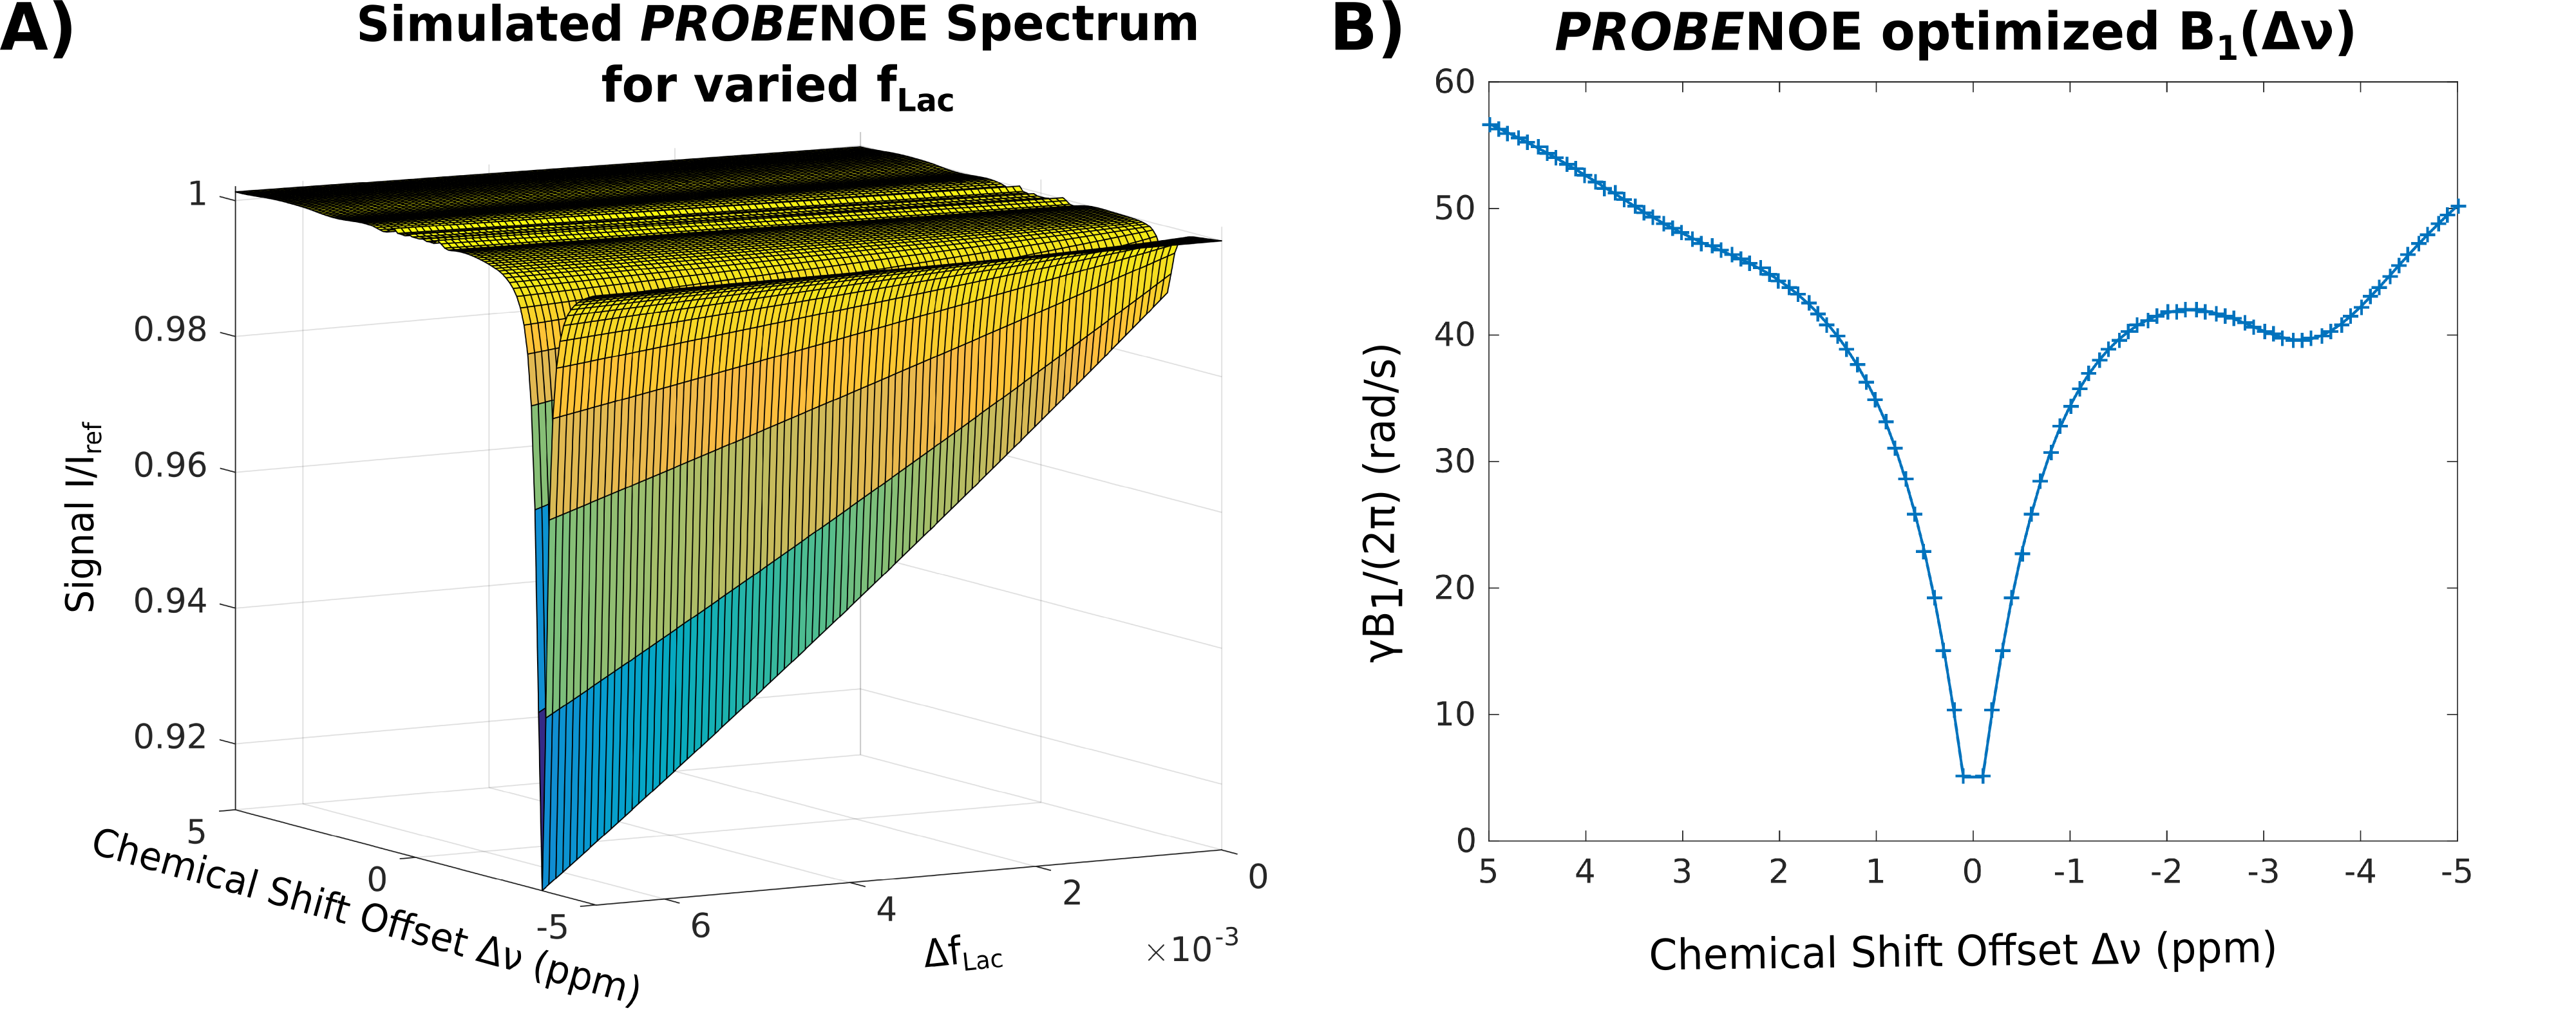
Subsequently, baseline was optimized for a target signal I=0.87I0 using optimal-control approach13 and matrix-algebra-based calculation, providing B1(Δν) (see Figs. 1 and 2), which was used for ensuing PROBE-CEST/NOE acquisitions (3 averages).
Results and Discussion
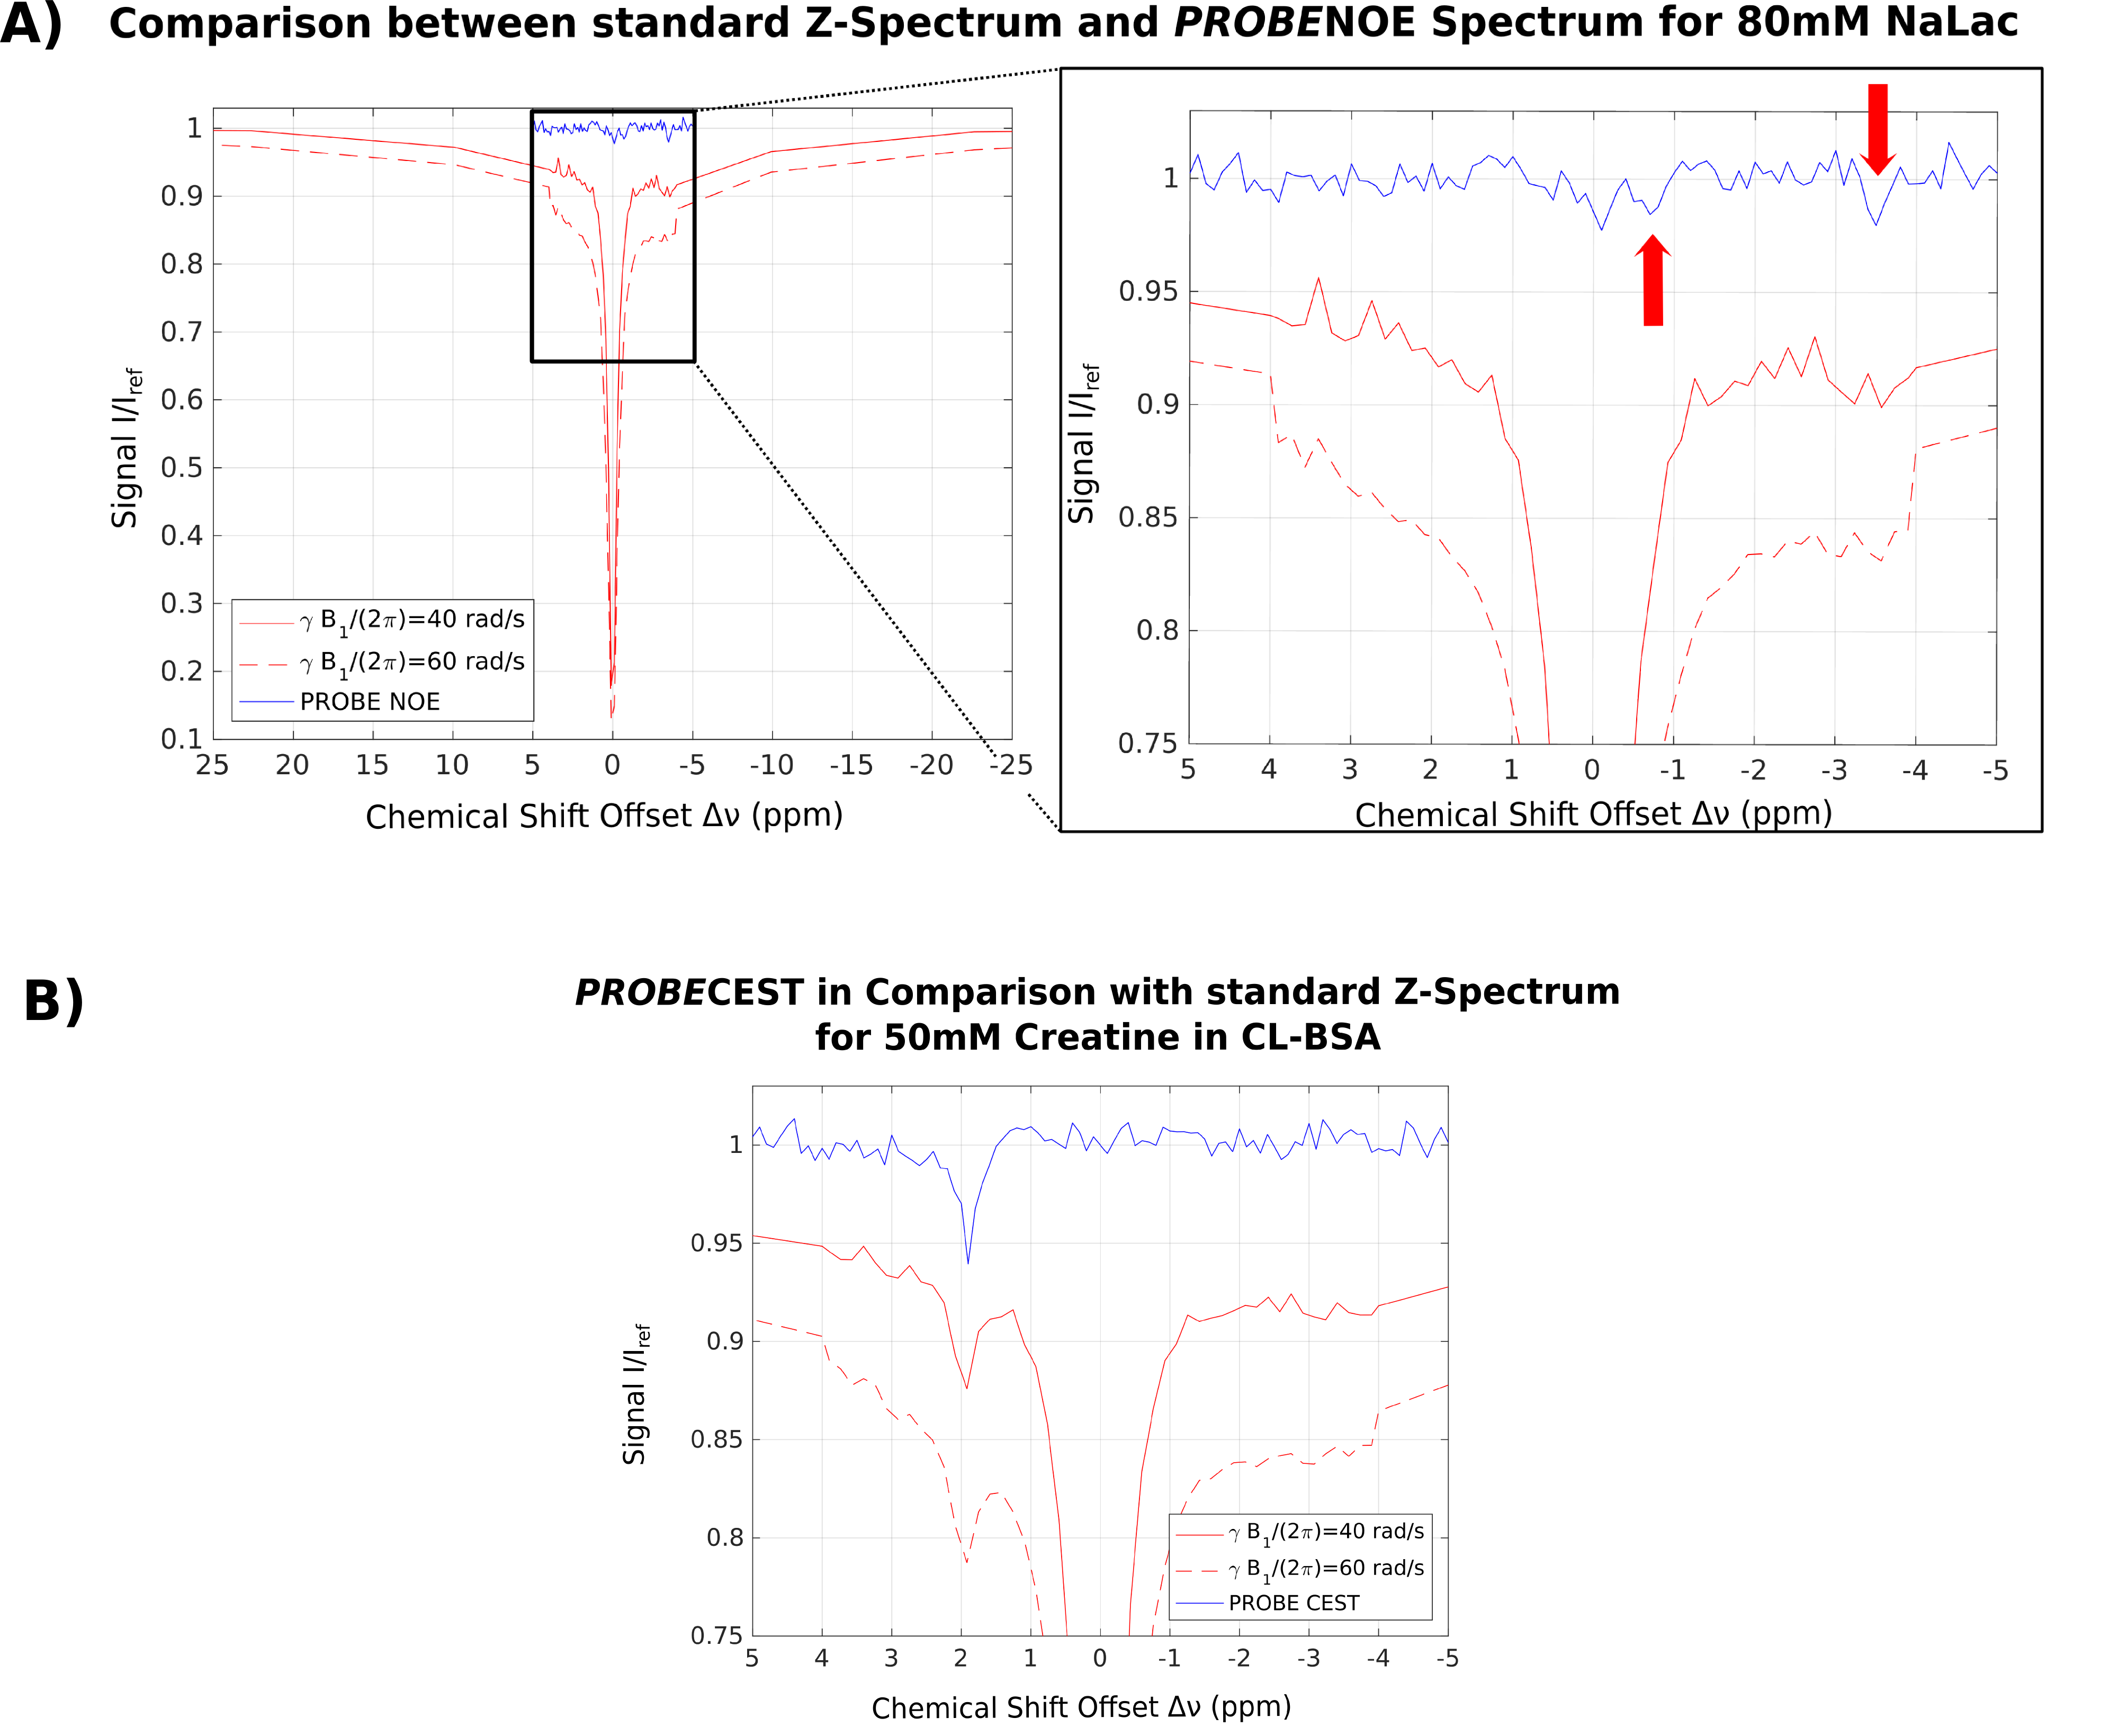
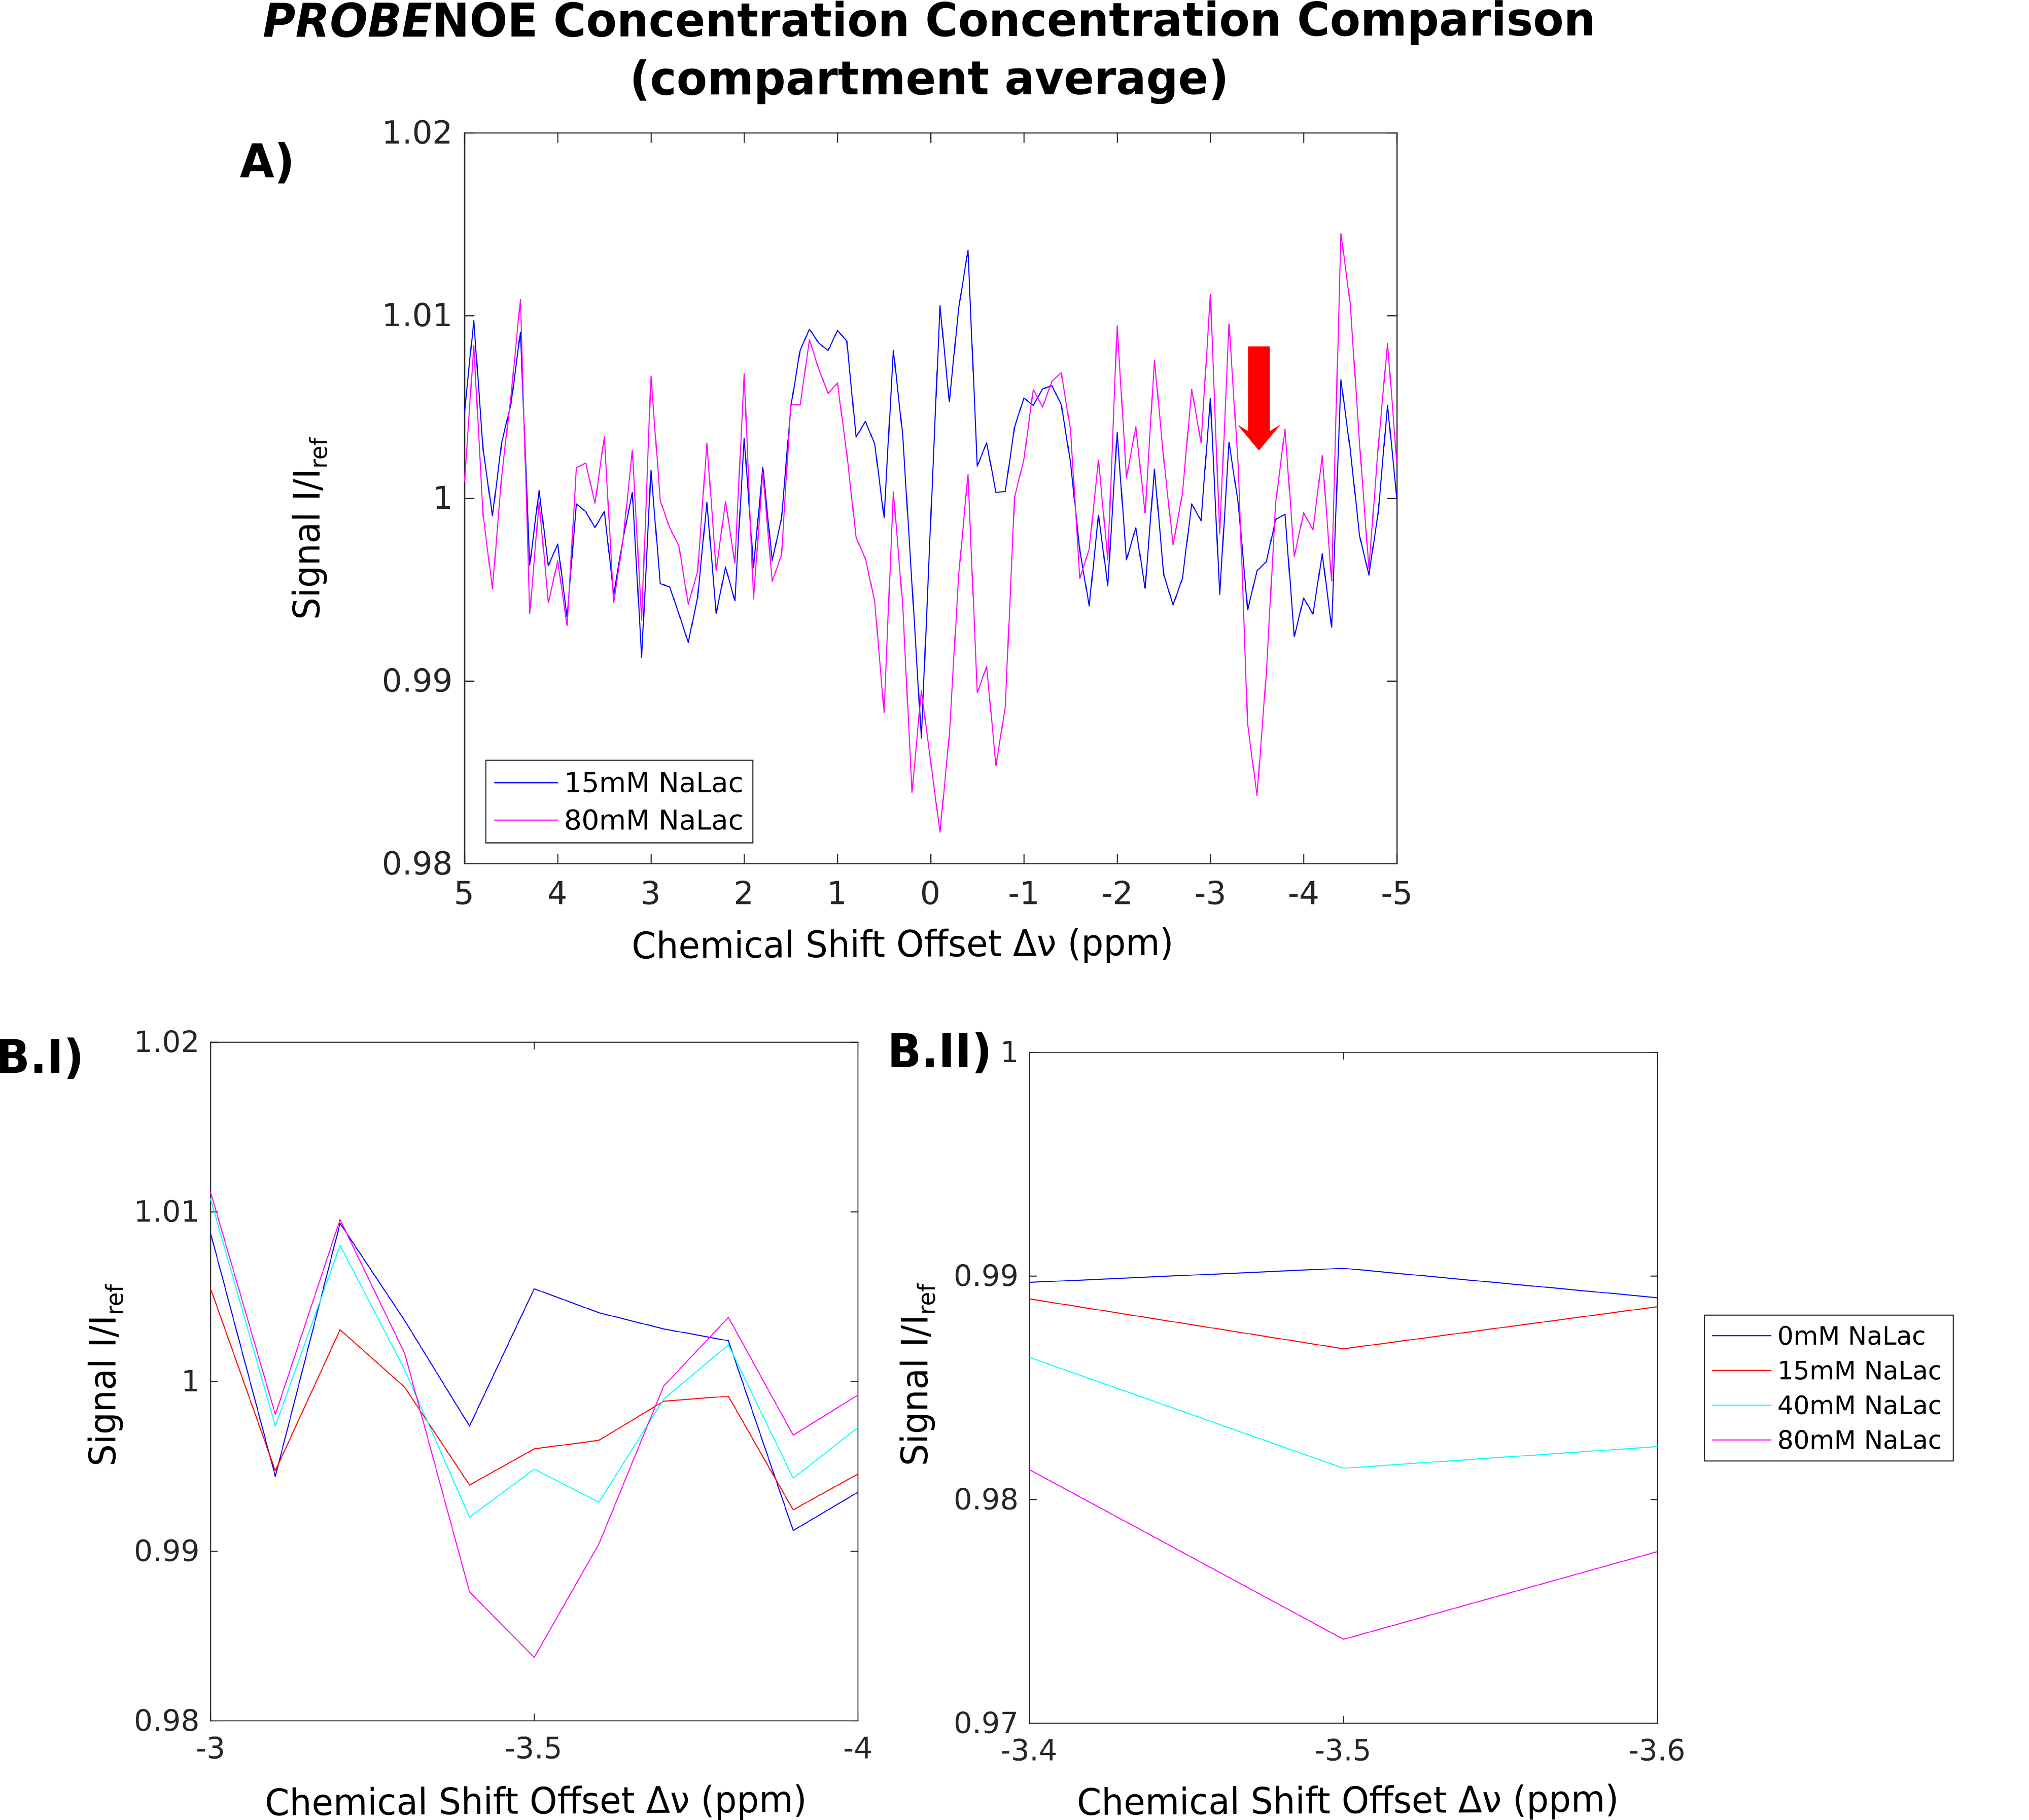
Feasibility of PROBE-NOE is illustrated in Fig. 1. A linear relation between NOE-pool fraction can be observed from simulations in Fig. 2. The excellent performance of PROBE is demonstrated in Fig. 3 with results for NOE and CEST shown in comparison to standard Z-spectra. Through the flat baseline, PROBE-NOE reveals peaks close to water resonance, which are often unobservable.
The two NOE-peaks indicated in Fig. 3A can be assigned to lactate methyl and methine groups14 at −3.5ppm and −0.7ppm, respectively. To demonstrate applicability for CEST, a PROBE-CEST acquisition of creatine is shown in Fig. 3B. The CrCEST peak at 1.9ppm is clearly visible.
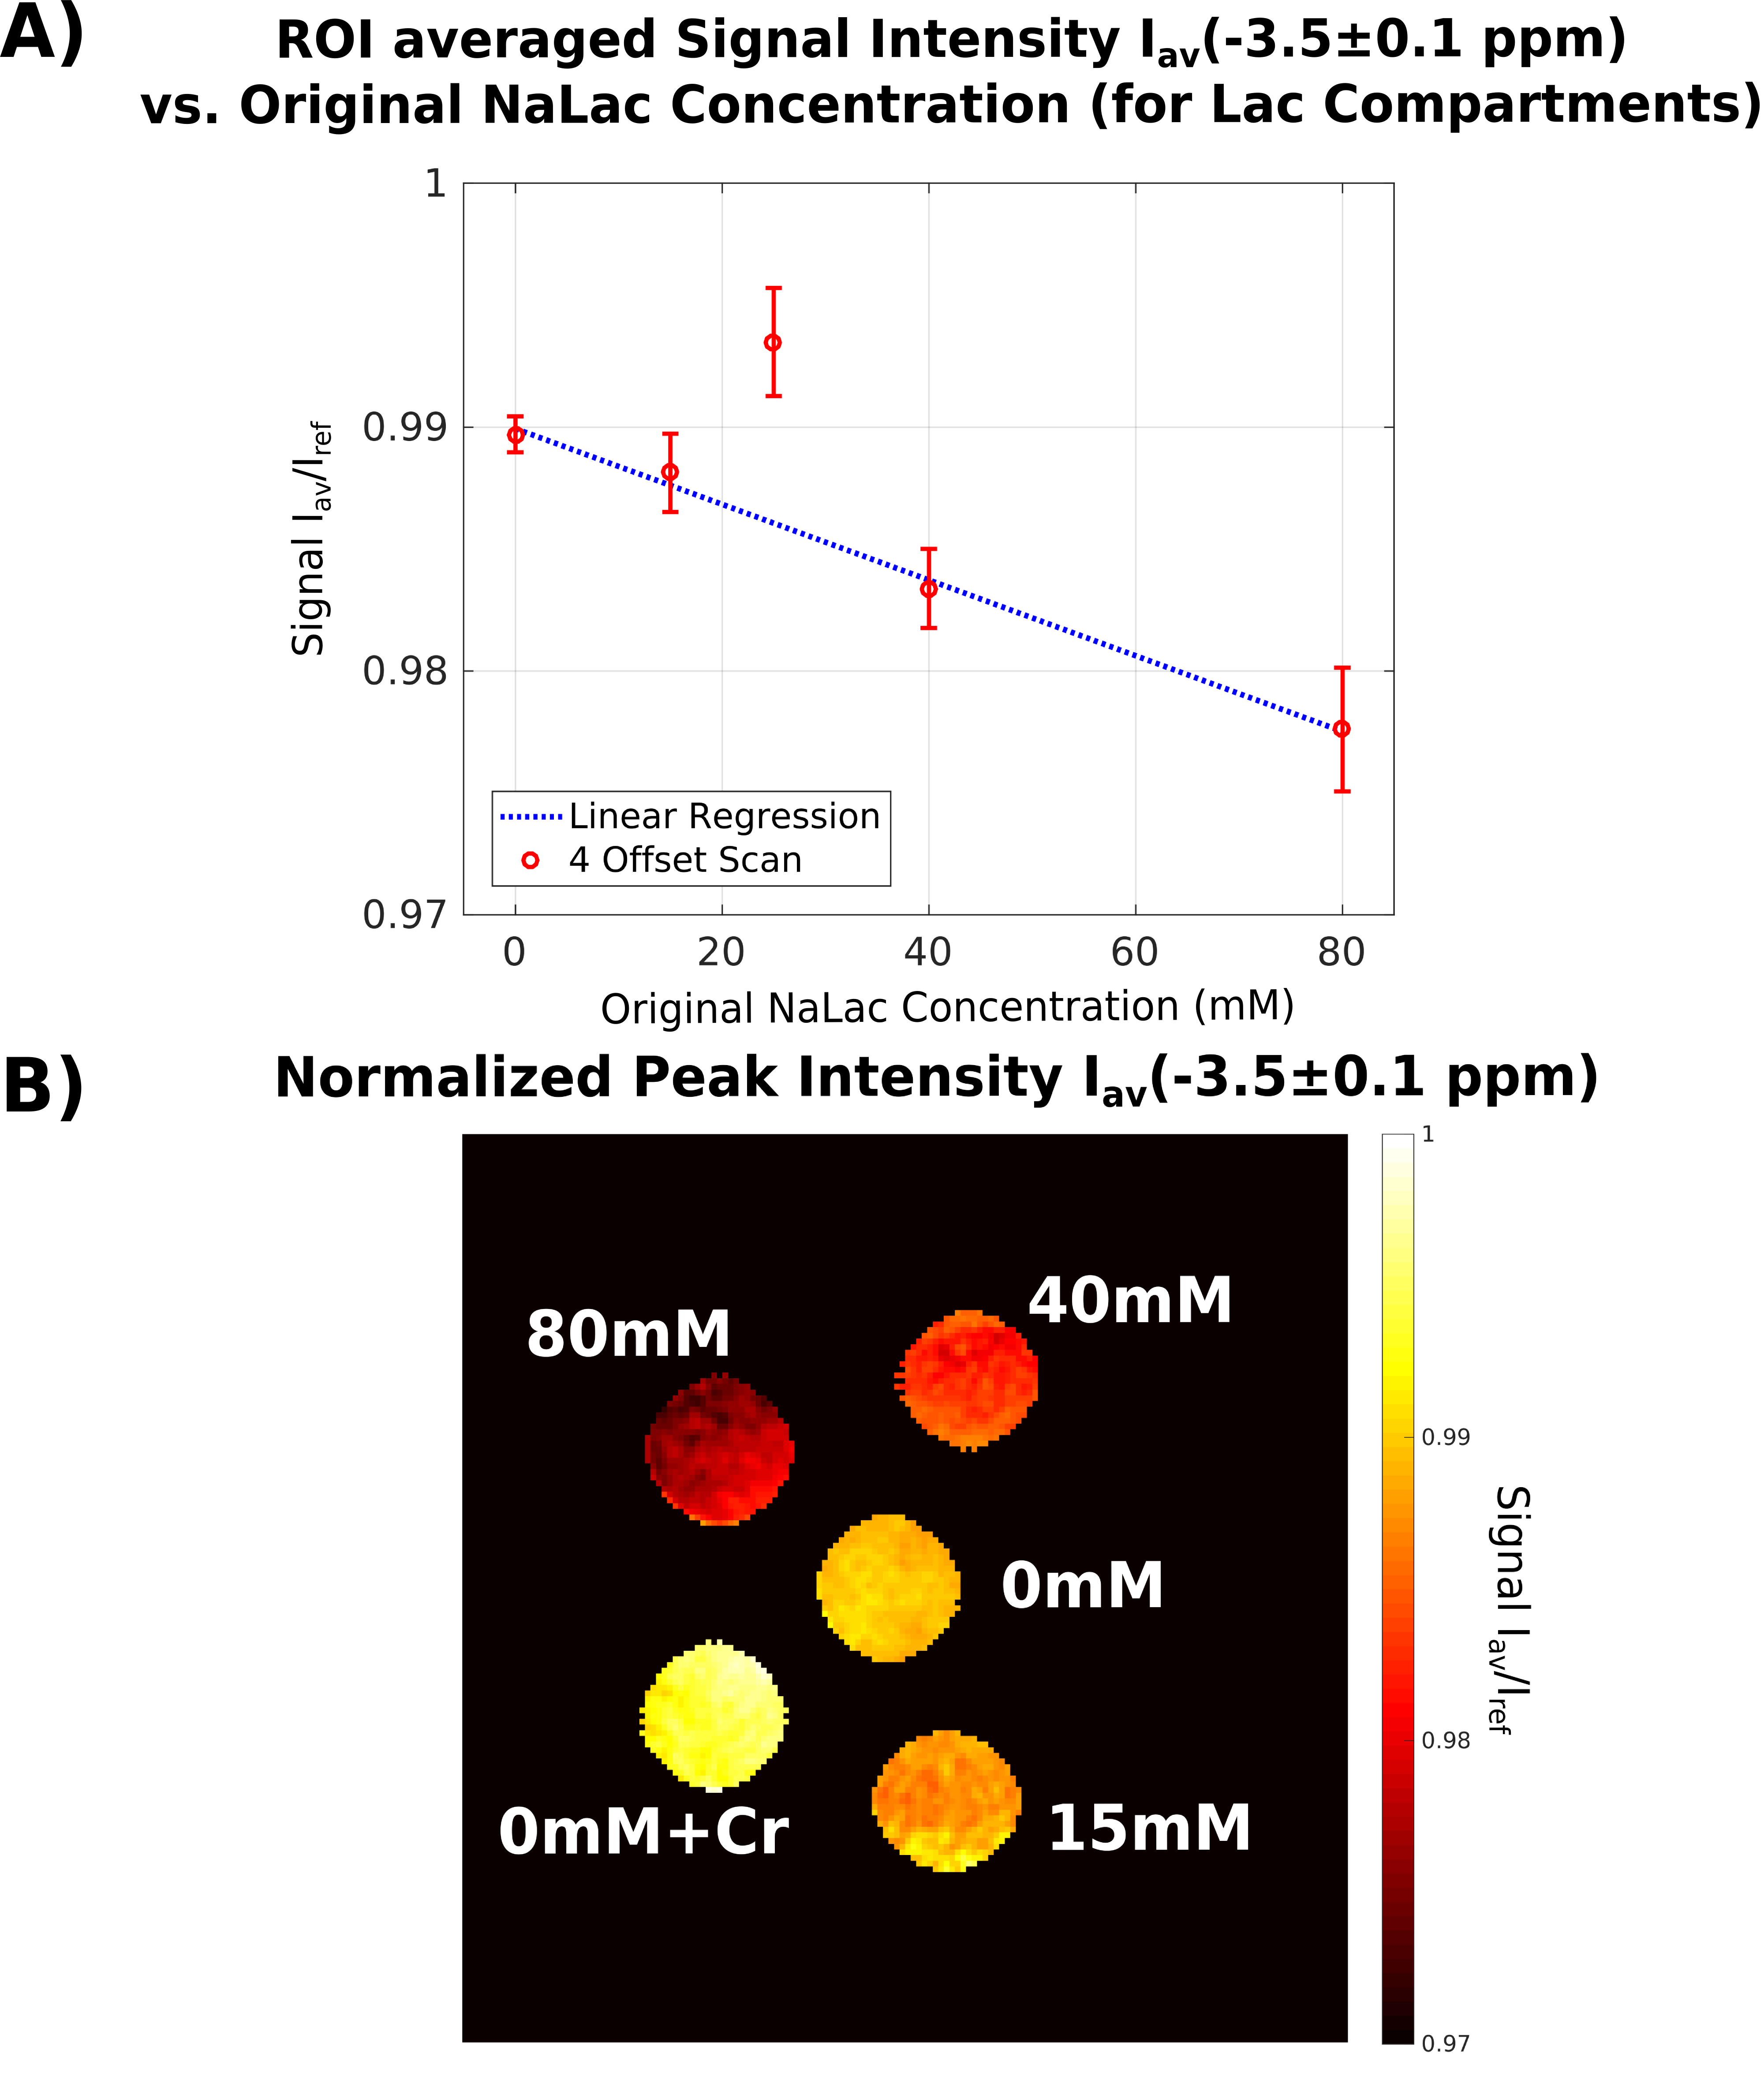
Because of the linear dependency of NOE-peak amplitude in PROBE-NOE on fNOE, a peak-amplitude based analysis provides a good estimate of the spin-pool fraction. For affirmation of acquisition speed, a shorter 4 offset acquisition was repeated 6 times. Results of ROI-based analyses are depicted in Figs. 4 and 5, showing good agreement with measured fLac.
In contrast to MTRA-based analysis, our method inherently compensates for background effects. Depending on scout acquisition parameters, the desired spin pools and effects can be modeled and included into the optimization. PROBE does not lead to spurious peaks, since B1(Δν) compensates for modeled peaks by reducing B1 in this offset region, leading to less saturation. The desired CEST/NOE peaks are not modeled into the background spin system and, therefore, clearly show up on the flat baseline in PROBE acquisition.
Normalization of PROBE spectra was done at Iref=<I([3..5]ppm)>. In contrast to standard Z-spectra, where I0 remains unsaturated, our technique remains restricted to low offset regions for CEST/NOE, where a certain level of saturation can be achieved. Therefore, normalization of PROBE spectra nearly removes B1+ saturation inhomogeneities, by rescaling the spectra.
Conclusion
An optimization technique for high-resolution CEST/NOE acquisition was developed, which eminently compensates for confounding background effects. It provides a direct measure for relative spin-pool fractions, without further MTRA lineshape-based analyses. PROBE-NOE maps directly resemble expected concentrations. In our experiments, lactate concentrations were chosen between 15-80mM (NaLac). With elevated in-vivo lactate levels of the order of 10mM in disease15, future in-vivo experiments may be feasible.Acknowledgements
This work was funded by the Helmholtz Alliance "ICEMED".References
[1] K. M. Ward et al., A New Class of Contrast Agents for MRI Based on Proton Chemical Exchange Dependent Saturation Transfer (CEST), J Magn Reson 143, 79 (2000).
[2] A. W. Overhauser, Polarization of nuclei in metals, Phys Rev 92, 411 (1953).
[3] K. Cai et al., CEST signal at 2 ppm (CEST@2ppm) from Z-spectral fitting correlates with creatine distribution in brain tumor, NMR Biomed 28, 1 (2015).
[4] O. Petroff et al., Spectroscopic imaging of stroke in humans Histopathology correlates of spectral changes, Neurology 42, 1349 (1992).
[5] J. R. Alger et al., Metabolism of human gliomas: assessment with H-1 MR spectroscopy and F-18 fluorodeoxyglucose PET, Radiology 177, 633 (1990).
[6] H. E. Möller et al., Magnetic resonance spectroscopy in patients with MELAS, J Neurol Sci 229–230, 131 (2005).
[7] S. Goerke et al., Signature of protein unfolding in chemical exchange saturation transfer imaging, NMR Biomed 28, 906 (2015).
[8] D. J. Clark et al., Investigating hydroxyl chemical exchange using a variable saturation power chemical exchange saturation transfer (vCEST) method at 3 T, Magn Reson Med 76, 826 (2016).
[9] J. Breitling et al., Inhomogeneous magnetization transfer detection by dual frequency CEST spectroscopy, Magn. Reson. Mater. Phys. Biol. Med. 29 (2016).
[10] S. H. Koenig et al., A molecular theory of relaxation and magnetization transfer: Application to cross-linked BSA, a model for tissue, Magn Reson Med 30, 685 (1993).
[11] T. Lenich et al., ISMRM Annual Meeting, 3347, (2015).
[12] D. K. Müller et al., Matrix-algebra-based calculations of the time evolution of the binary spin-bath model for magnetization transfer, J Magn Reson 230, 88 (2013).
[13] D. L. Goodwin et al., Modified Newton-Raphson GRAPE methods for optimal control of spin systems, J Chem Phys 144, 204107 (2016).
[14] V. Govindaraju et al., Proton NMR chemical shifts and coupling constants for brain metabolites, NMR Biomed 13, 129 (2000).
[15] S.-C. Lee et al., In vivo MRS markers of response to CHOP chemotherapy in the WSU-DLCL2 human diffuse large B-cell lymphoma xenograft, NMR Biomed 21, 723 (2008).
Figures