3779
Model-Based Analysis of Partial Z-spectra for Rapid Quantification of Amide Proton Transfer MRI1Institute of Biomedical Engineering, University of Oxford, Oxford, United Kingdom, 2Oxford Institute for Radiation Oncology, University of Oxford, Oxford, United Kingdom, 3Acute Vascular Imaging Centre & Acute Stroke Programme, Radcliffe Department of Medicine, University of Oxford, Oxford, United Kingdom, 4School of Medicine, Faculty of Health, University of Tasmania, Hobart, Australia, 5Physical and Theoretical Chemistry Laboratory, Department of Chemistry, University of Oxford, Oxford, United Kingdom, 6Oxford Centre for Functional MRI of the Brain, Nuffield Department of Clinical Neurosciences, University of Oxford, Oxford, United Kingdom
Synopsis
Model-based analysis of APT MRI has been shown to quantitatively outperform conventional approaches such as asymmetry analysis. However clinical application is hindered by slow acquisition of whole z-spectra, and processing times. Here, we demonstrate that by using only a subset of frequency offsets, acquisition and processing time can be reduced by ~70% and ~90%, respectively. Using an MCAO model of ischemic stroke, we demonstrate that our Reduced Frequency Offset approach is able to detect significant differences in APTR* between healthy and ischemic tissue.
Purpose
Model-based analysis of Amide Proton Transfer (APT) MRI has been shown to quantitatively outperform conventional methods such as asymmetry analysis for pH-weighted imaging in ischemic stroke1. However, despite its robustness, a major challenge to its clinical application is the need to acquire a full z-spectrum, resulting in long acquisition times in addition to lengthy post-processing times. Here we propose a new method of acquiring a reduced number of frequency saturation offsets, in conjunction with model-based analysis2 and other imaging information, which will enable more rapid and clinically feasible model-based analysis of APT-MRI.Methods
Focal ischemia was induced in 5 Wistar rats using middle cerebral artery occlusion. MRI was immediately performed using a 9.4T system (Agilent) with 72mm volume-transmit and 4-channel surface-receive array (Rapid Biomedical).
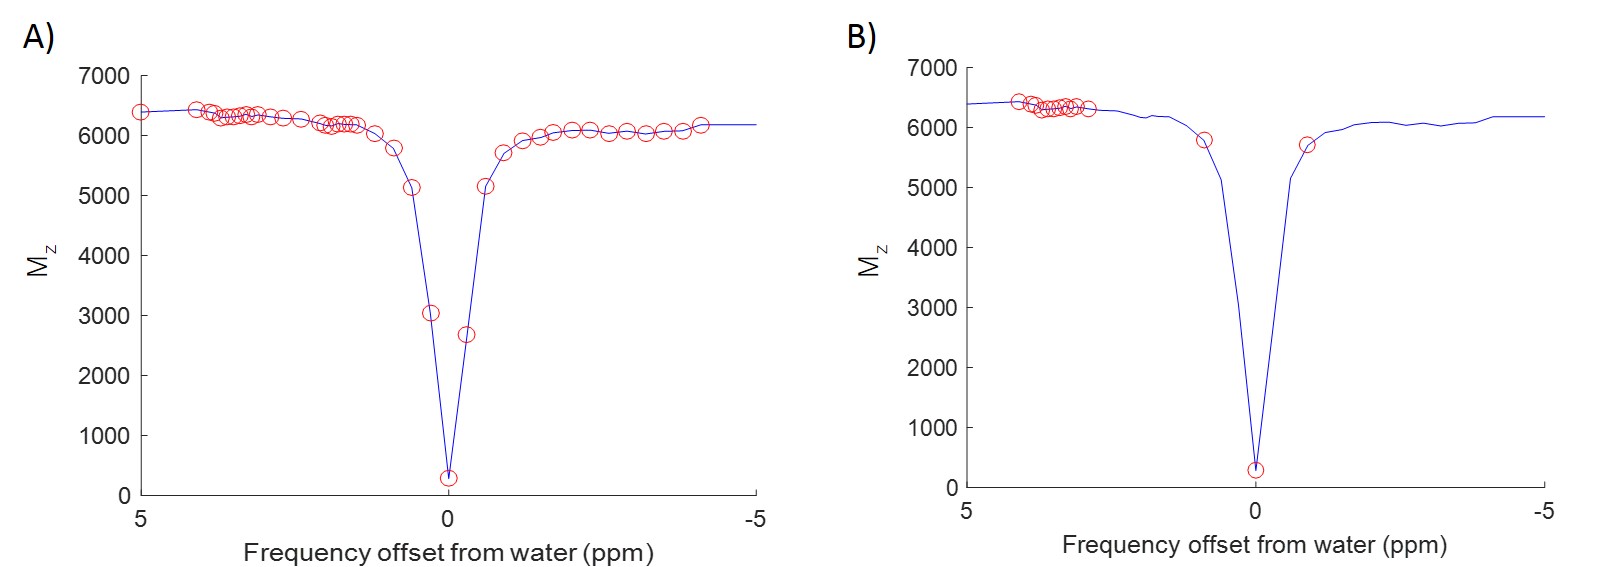
APT data were acquired using a saturation scheme of 50 Gaussian pulses (40ms duration, 184° FA, 50% duty cycle, equivalent continuous wave saturation power 0.55µT) at 51 saturation frequencies (-300 to 300ppm, Figure 1) and SE-EPI readout (TR=5s, TE=27.2ms). T1 and T2 maps were acquired using IR-EPI (TR/TE=10s/27.22ms, 9TIs:0.013-8s) and SE-EPI (TR=5s, 10TEs:30-160ms) sequences. Diffusion-weighted imaging (TR/TE=3s/27.2ms, 3 directions, b=0/1000s/mm2) and multi-phase pCASL (8 phases 0-315°, tag thickness 6.2mm, TR/TE/PLD=4s/12.4ms/550ms, bolus duration 1.4s) were acquired for identification of perfusion/diffusion mismatch. Images were acquired with 0.5x0.5x1mm3 resolution, across 10 slices.
Saturation frequency offsets were retrospectively reduced from 51 (Reference dataset) to 16 (reduced frequency offset, RFO dataset) (Figure 1). Model-based analysis was performed using FSL’s BayCEST2,3. For the Reference method, a 3-pool exchange model was assumed (water, amide, magnetisation transfer + nuclear Overhauser enhancement) with T1 and T2 maps included as image priors (default precisions), as previously outlined4. The fitted water centre frequency offset map provided a ‘B0 prior’ for further analysis. 2-pool exchange (water plus amide) was assumed for RFO analysis, with a combination of separately measured T1, T2 and B0 maps. APTR* was subsequently calculated using fitted parameters as previously described1,4,5. ASL data were fitted using a modification of BASIL6 before processing with oxford_asl3,7. Masks for ischemic core and contralateral healthy tissue were created from ADC and CBF maps in MATLAB5. RFO performance was assessed using APTR* tissue contrast (ischemic core vs. healthy tissue), coefficient of variation (CV) in APTR* of healthy tissue, and agreement between Reference and RFO APTR* measurements. Within-method differences in APTR* were assessed using Welch’s t-test, between-method differences with a Paired t-test, and associations in APTR* assessed with Pearson’s Product Moment Correlation Coefficient. Statistical significance was defined as p<0.05, following Bonferroni correction for multiple comparisons.
Results
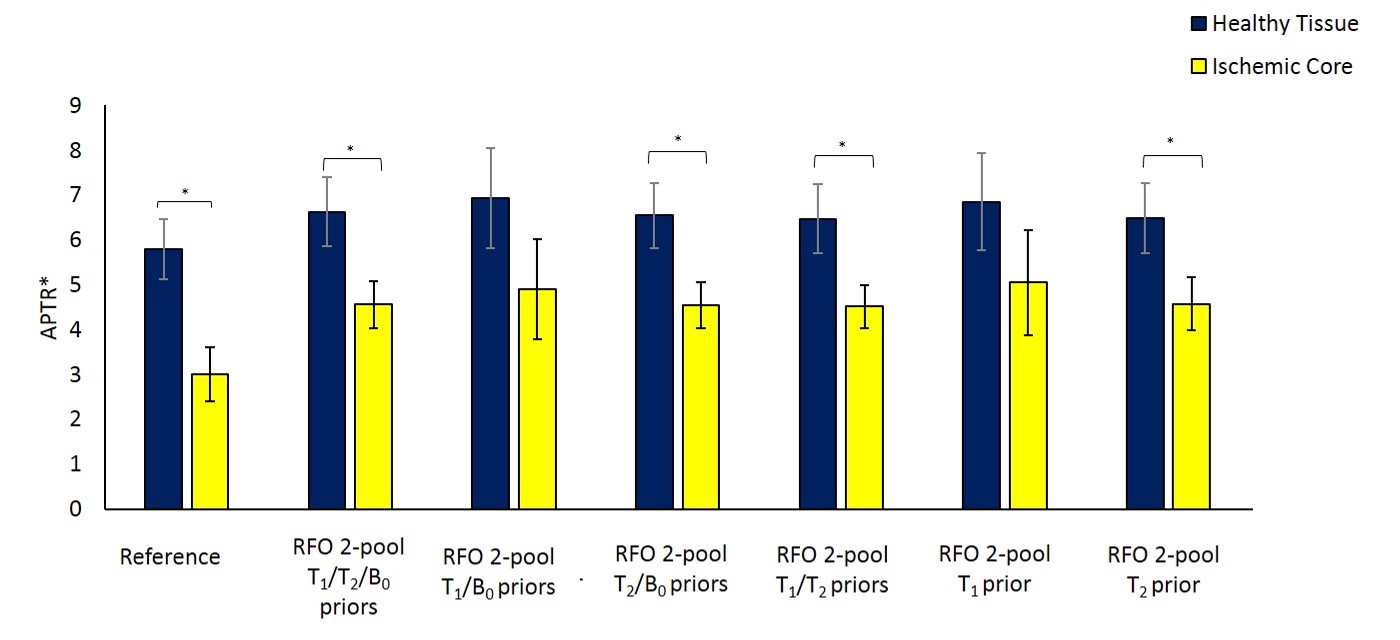
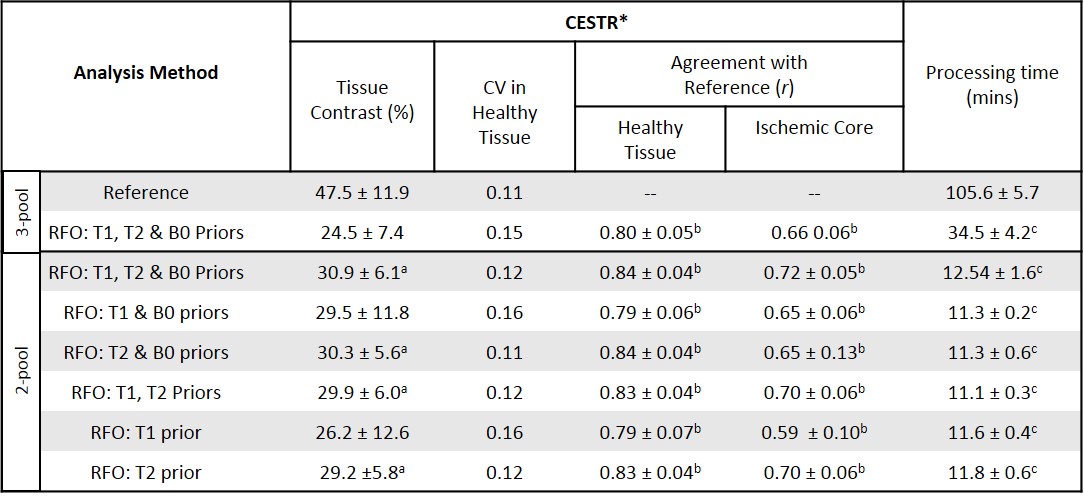
RFO analysis with voxelwise T1/T2 provided APTR* measurements in strong agreement with the Reference method (Table 1). A significant reduction was observed in tissue contrast in comparison to the Reference. However, differences between ROIs remained significant. Removing the B0-offset map led to a small reduction in RFO APTR* in healthy tissue (2.3±1.1%, p<0.05), however strong agreement was observed in both healthy and ischemic tissue (r=0.996 and 0.985 respectively, p<0.01).
Replacing voxelwise T1 values with a single prior value (1.8s) did not significantly alter RFO measures of tissue contrast, with strong agreement in APTR* for both ROIs (r=1, p<0.001 for both), and significant reduction in ischemic APTR* in comparison to healthy tissue (p=0.001). APTR* values remained strongly associated with Reference values, with comparable CV in healthy tissue. Inclusion of voxelwise T2 values were required to achieve significant tissue contrast, as a single prior value (40ms) led to increased CV in APTR*.
All RFO methods led to significant reductions in processing time (Table 1).
Discussion
Here we retrospectively demonstrate that by reducing the number of frequency saturation offsets, acquisition and processing time for APT MRI can be reduced by ~70% and 90% respectively, while maintaining reasonable tissue contrast. Furthermore, The 2-pool simplification enables underlying Bloch-McConnell equations to be numerically solved, potentially further reducing processing time. The combination of shorter acquisition and processing time brings APT MRI towards clinically relevant timescales demanded for treatment decisions in acute stroke.
Results suggest that RFO data can be appropriately modelled assuming 2-pool exchange, with B0-offset quantified from the z-spectrum as per the Reference method8, and separate voxelwise T2 quantification. For identification of acute ischemic tissue contrast, separate T1 quantification does not improve performance. While separate T2 quantification will impose additional time penalties, techniques such as MR fingerprinting, may allow tolerable acquisition times. In addition to validation in independent animal and patient cohorts, further work is necessary to test whether such model simplifications generate the required contrast for more subtle signal changes such as those seen in the ischemic penumbra5.
Acknowledgements
This work was funded by the CRUK & EPSRC Cancer Imaging Centre in Oxford and The University of Oxford’s Wellcome Trust Institutional Strategic Support FundingReferences
[1] Tee et al., Comparing difference analysis methods for quantifying the MI amide proton transfer (APT) effect in hyperacute stroke patients. NMR in Biomed., 2014, 27:1019-1029
[2] Chappell et al., Quantitative Bayesian Model-Based Analysis of Amide Proton Transfer MRI. MRM., 2013, 70:556-567
[3] Chappell MA, Groves AR, Whitcher B, Woolrich MW. Variational Bayesian Inference for a Nonlinear Forward Model. IEEE Trans Signal Process., 2009, 223–236
[4] Ray et al., Determination of an optimally sensitive and specific chemical exchange saturation transfer MRI quantification metric in relevant biological phantoms. NMR in Biomed., 2016, 29:1624-1633
[5] Harston et al., Identifying the ischaemic penumbra using pH-weighted magnetic resonance imaging. Brain. 2015; 138: 36-42
[6] http://www.fmrib.ox.ac.uk/fsl/basil
[7] Larkin et al. Multiphase pCASL for imaging blood flow in rodent brains, Proc. ISMRM, 2016, #5333
[8] Tee at al., Optimal sampling schedule for chemical exchange saturation transfer. MRM., 2013, 70(5):1251-1262
Figures