3778
Overlap-resolved cest (orCEST) MRI: imaging gaba and glutamate at 16.4T1Champalimaud Centre for the Unknown, Lisbon, Portugal
Synopsis
Chemical Exchange Saturation Transfer (CEST) affords metabolic imaging at high spatial resolution, especially at ultrahigh fields. However, when spectral overlap exists downfield, metabolite maps may be contaminated by other unwanted signals. Here, we present a methodology termed overlap-resolved-CEST (orCEST), which, through subtraction in CESTasym spectra, provides enhanced specificity. We demonstrate how this technique can be used to resolve the signals of Glutamate and GABA – the Central Nervous System’s primary neurotransmitters in vivo.
PURPOSE
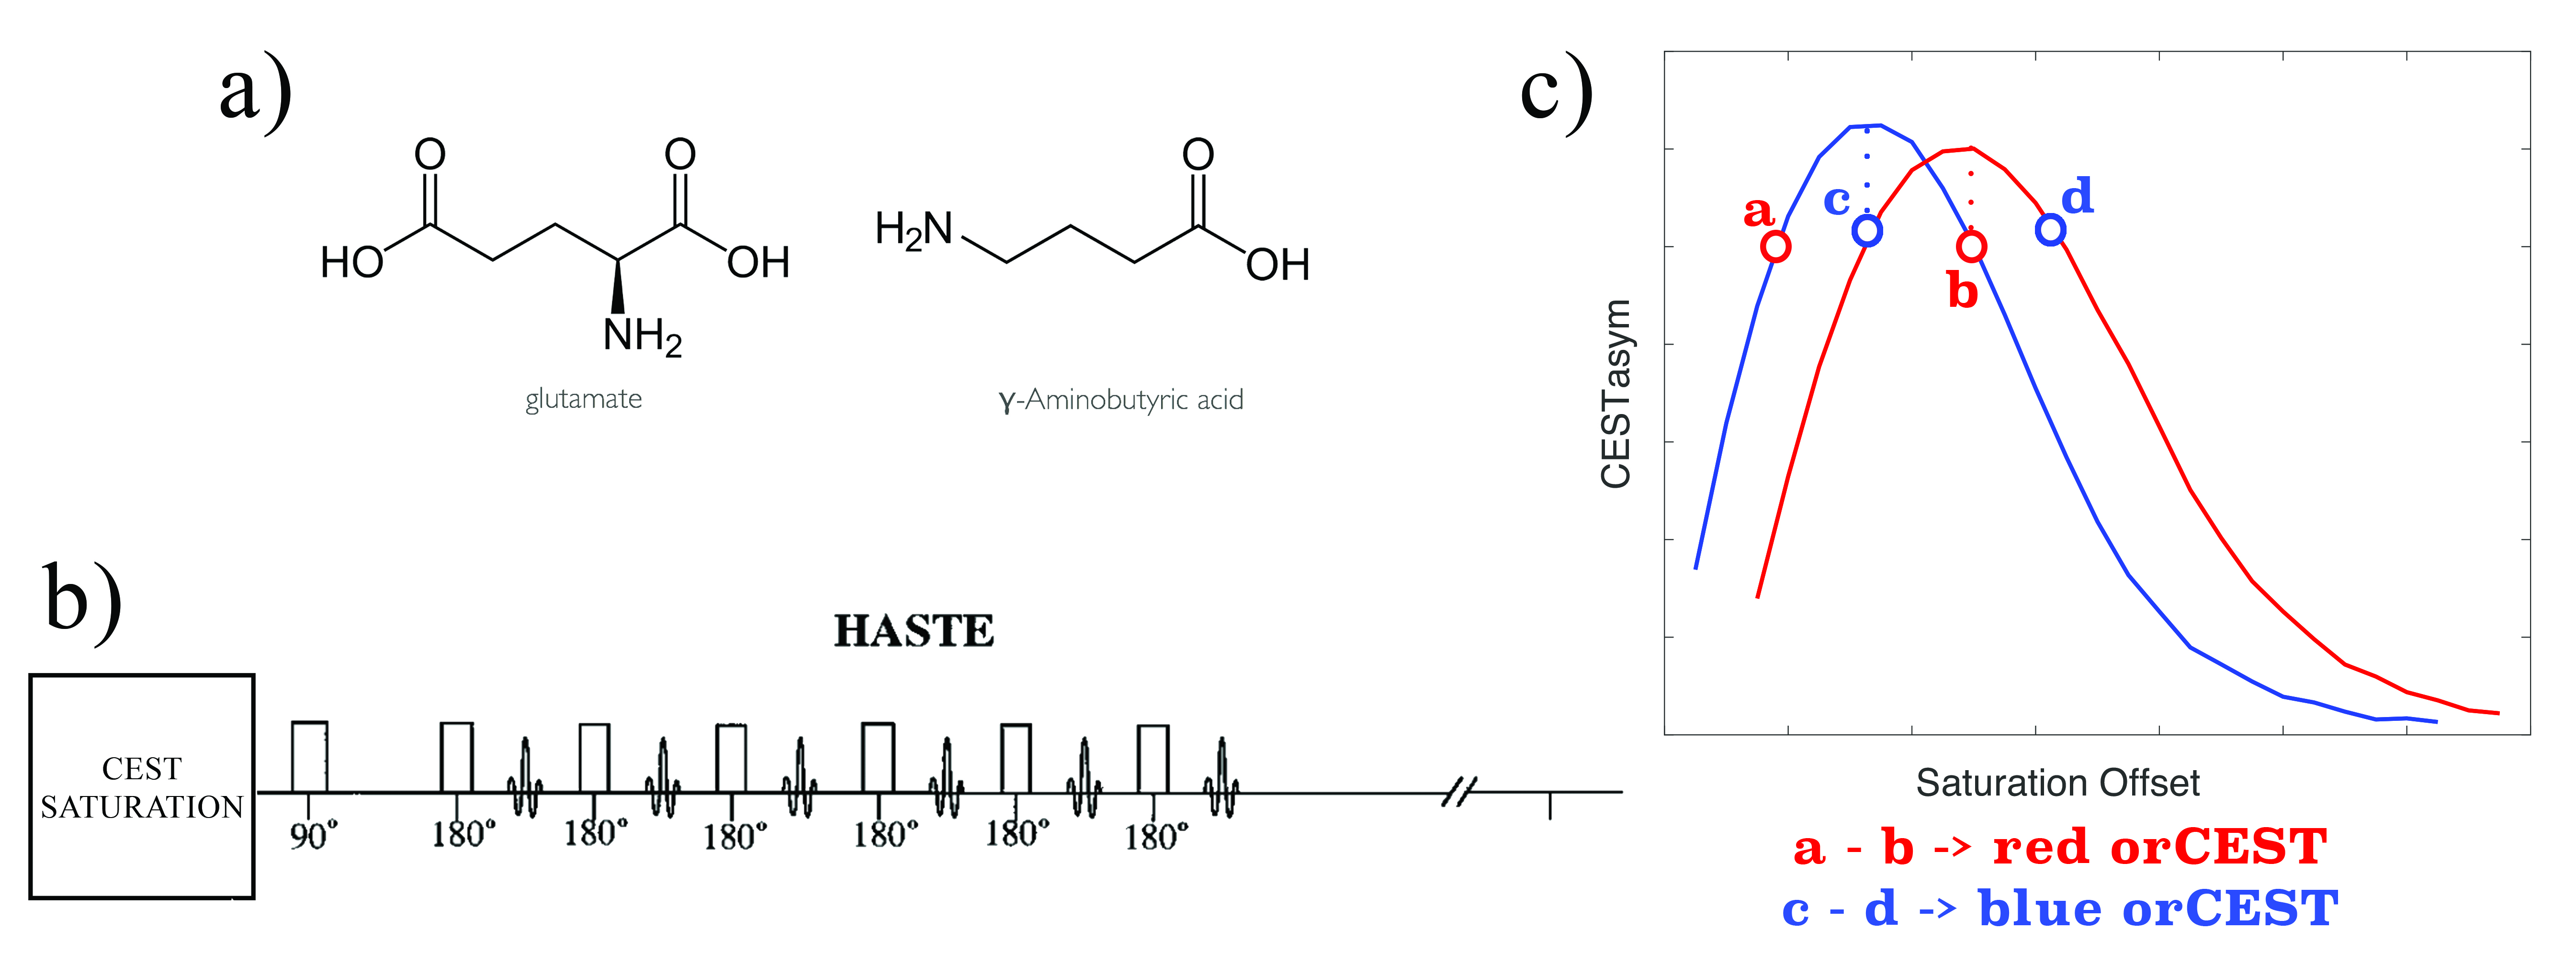
Glutamate (Glu) and gamma-aminobutyric acid (GABA) are the major excitatory and inhibitory neurotransmitters in the brain [1,2]. Recently, a Chemical Exchange Saturation Transfer (CEST)-MRI focusing on Glu signals (gluCEST) provided high spatiotemporal resolution imaging of Glu [3-5]. However, GABA signals significantly overlap with gluCEST, leading to contamination and inability to image GABA. We here sought to image both Glutamate and GABA directly using CEST-MRI. To resolve partially overlapped signals, we propose a general method termed Overlap-Resolved CEST (orCEST) – whereby a careful characterization of CEST asymmetry spectra allows the subtraction of unwanted contribution of either metabolite (Figure 1). Using orCEST at ultrahigh field, we sought to image the brain’s primary neurotransmitters GABA and Glu independently, for the first time.METHODS
Theory: Each metabolite can be characterized by its own CEST asymmetry spectrum, CESTasym,i = (Msat(-ω) - Msat(ω))/(M0), where i represents the ith metabolite, Msat(ω) and M0 represents the saturated signal (at frequency ω) and unsaturated signal, respectively. These spectra tend to have local maxima, suggesting that in at least two frequencies CESTasym signals are identical, i.e., CESTasym,i (ω1) = CESTasym,i (ω2≠ω1) -> CESTasym,i(ω1) - CESTasym,i(ω2) = 0 [Fig.1]. Hence, a simple subtraction can null that metabolite’s signal. At the same time, some other metabolite j might have a CESTasym curve shifted compared to metabolite i; hence, CESTasym,j(ω1) - CESTasym,j(ω2) ≠ 0. Thus, one can null the effects of metabolite i while preserving contrast from metabolite j.Phantom preparation: For characterisation of orCEST, we prepared a sample with 3 different isolated metabolites, GABA, Glutamate and Glutamine with equal 5 mM concentrations. Metabolite solutions were prepared using 1xPBS (pH 7.2±0.2) in 3 mm NMR tubes, which were in turn placed inside a 10 mm NMR tube filled with Fluorinert. To quantify how GABA concentration affects orCEST, a similar phantom comprising four 3 mm tubes with GABA at concentrations of 0.75-5mM was prepared.
MRI experiments: All experiments were performed on a Bruker Ascend Aeon 16.4 T vertical scanner equipped with a micro5 10mm probe capable of producing 3000 mT/m in all directions (phantoms) or on a micro2.5 20mm probe capable of producing up to 1500mT/m in all directions (in-vivo). For specific pulse sequence details, see respective Figure captions. Phantom experiments: All experiments were performed at 37ºC, using a HASTE sequence [6] preceded by a CEST module. To quantify CESTasym, we ran 102 different frequencies in the range {-2.5:2.5} kHz at 50 Hz intervals, using a Gaussian pulse of varying durations and powers, followed by a crusher prior to HASTE acquisition. In-vivo experiments: C57bl mice (N=3) were anesthetized with 5% isoflurane for induction, 2.5% for maintenance, placed in a dedicated animal bed and inserted vertically to the scanner. The following CEST-HASTE experiments were performed. To quantify orCEST for Glu and GABA, the experiments were run with 6 different frequencies corresponding to ±250, ±450, and ±700 Hz, which were found to be suitable for resolving Glu and GABA in the in-vitro experiments. Quantification: Based on the in-vitro experiments, we choose one frequency in the spectra yielding the highest CEST effect, and another with a CEST value as similar as possible to filter the unwanted metabolite. For each metabolite, the orCEST images are obtained by simple subtraction of these two images.
RESULTS/DISCUSSION
Phantom
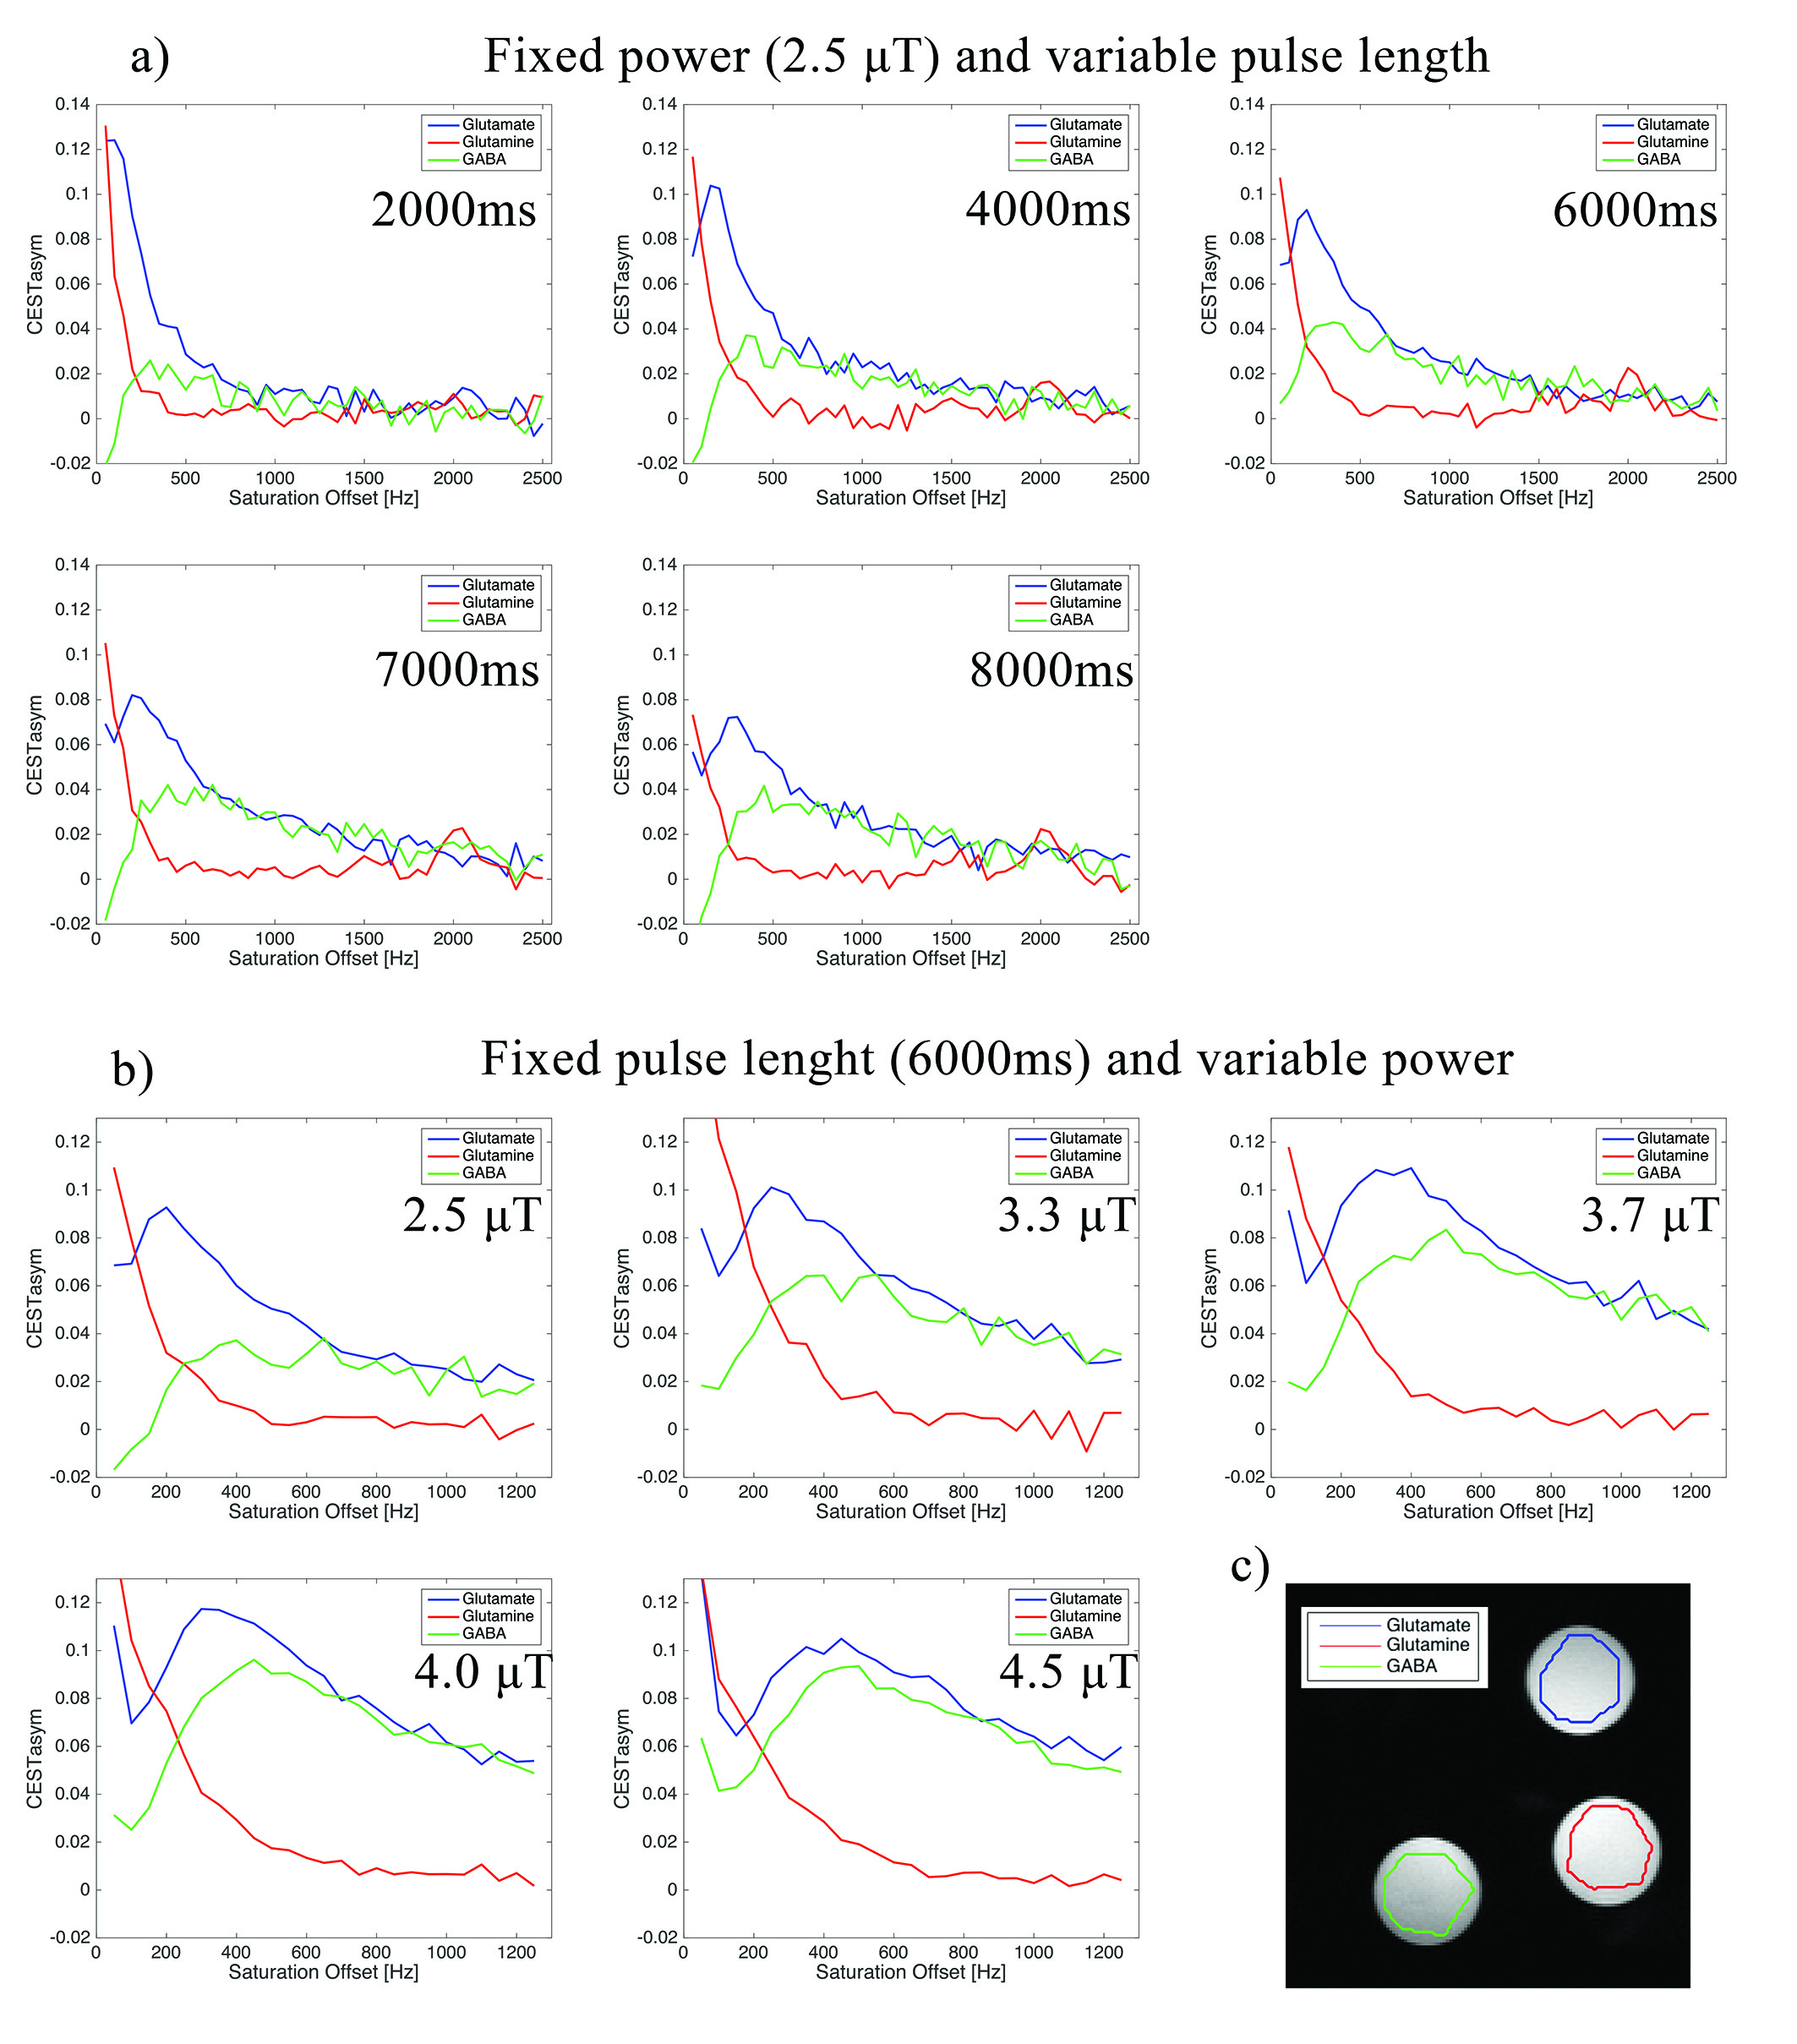
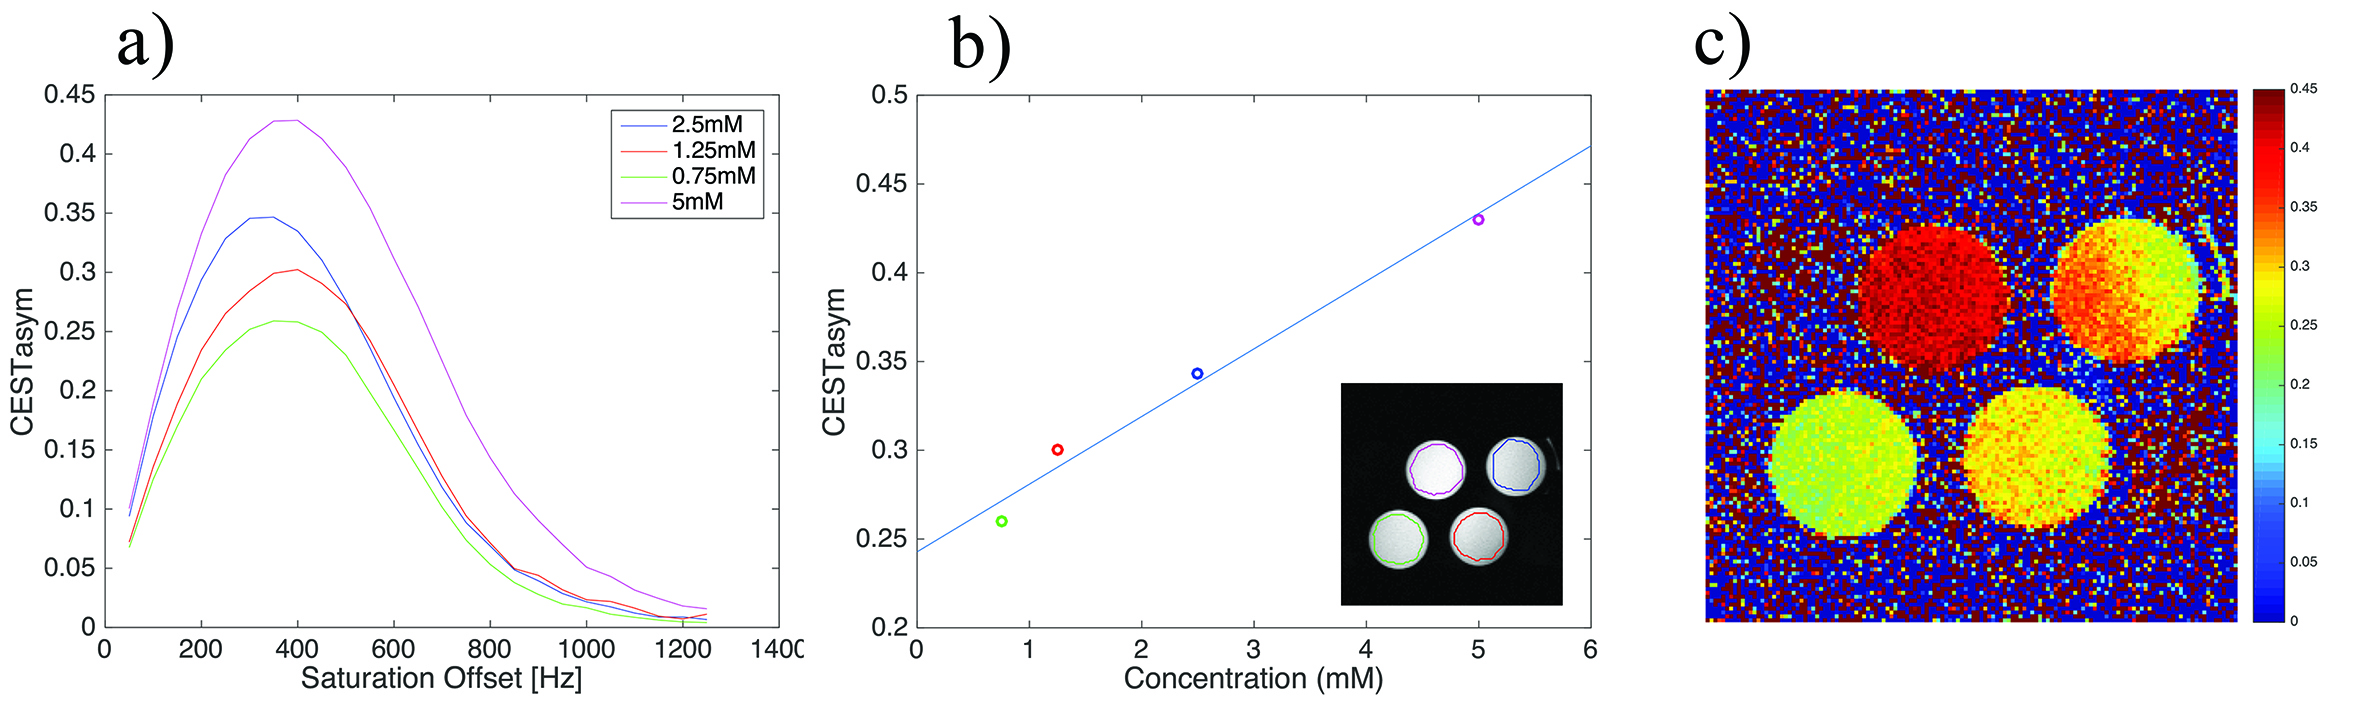
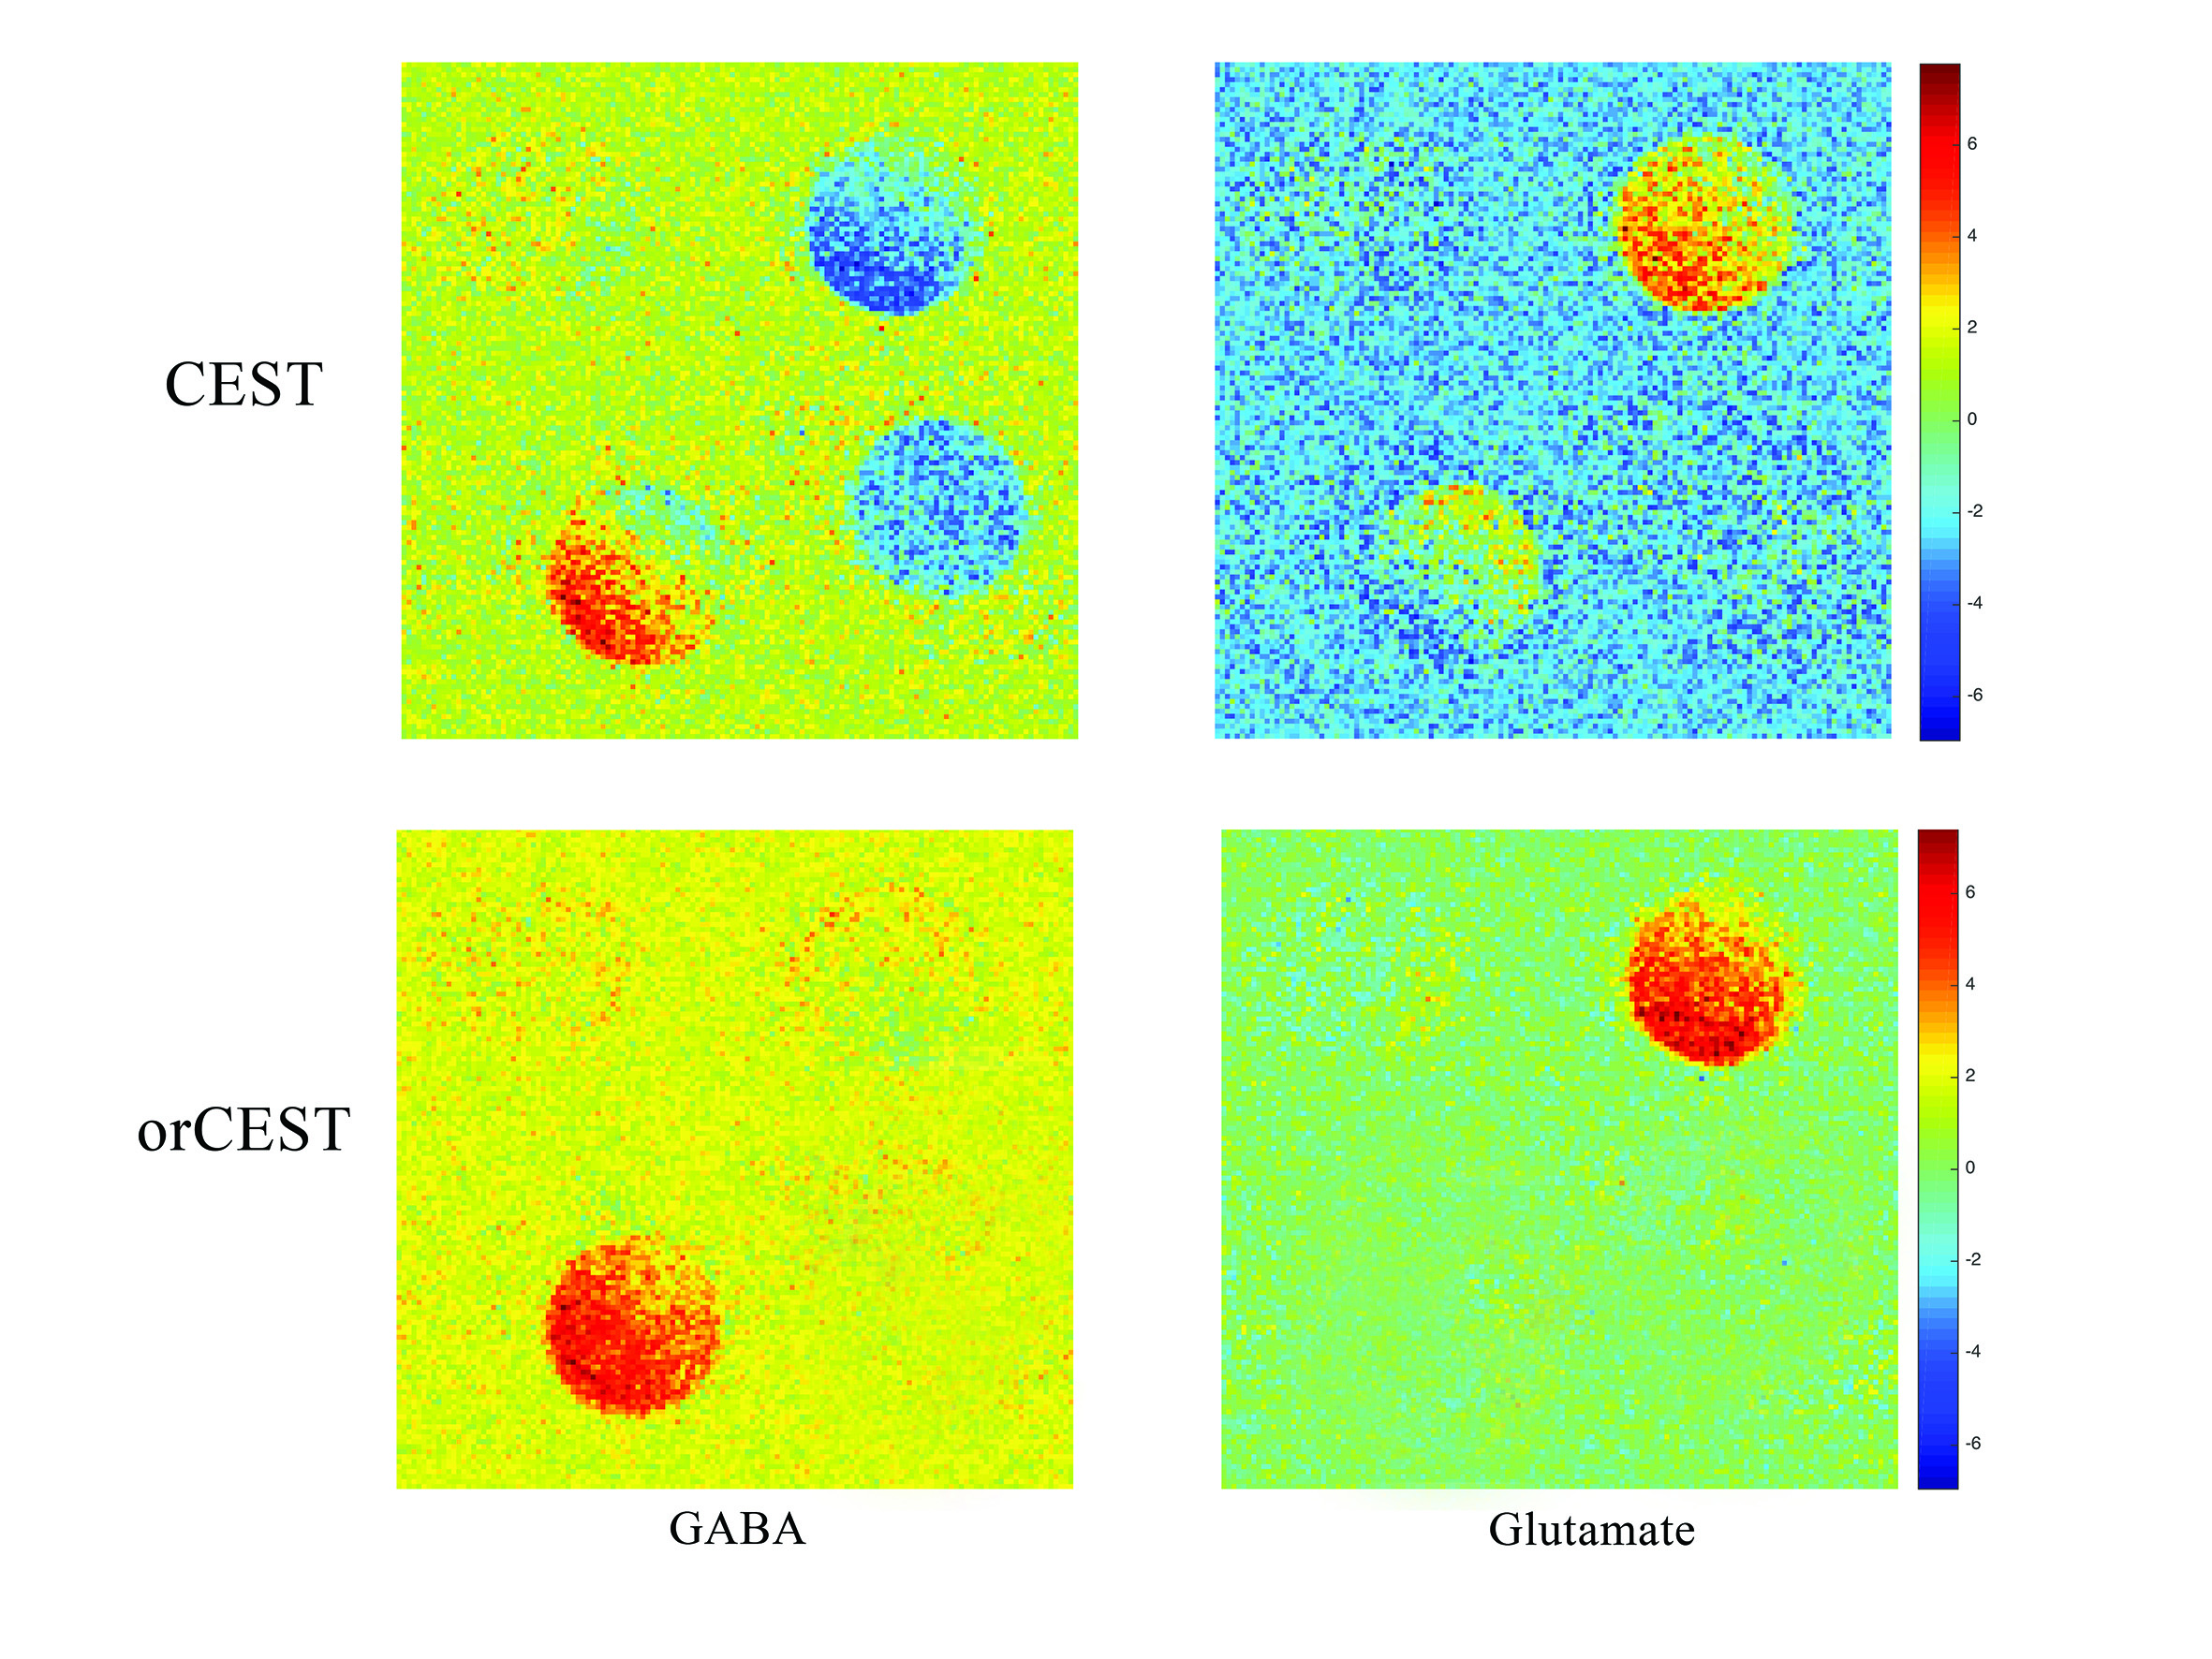
Figures 2a and 2b show CESTasym spectra in the Glu/GABA/Gln phantom, for different pulse lengths and pulse powers, respectively. Peaks are more resolved with longer pulses and lower irradiation power; considering T1 relaxation, we chose presaturation parameters of 4 μT and 6000 ms duration for subsequent experiments. To maximize CEST effects while clearly resolving each metabolite, we chose 250Hz (Glu) and 450Hz (GABA), with their respective subtraction frequencies at 700Hz and 250Hz. Figure 3 demonstrates that CEST amplitudes re commensurate with GABA’s concentration, facilitating the quantitative evaluation of GABA levels (gluCEST was already shown to have a similar dependence in [3]. Figure 4 examines the orCEST approach for resolving Glu and GABA. Figure 4a shows gluCEST and gabaCEST maps obtained as usual from signal peaks; contamination is observed for both signals. Conversely, Figure 4b shows that orCEST completely resolves these signals, albeit at slightly compromised SNR.
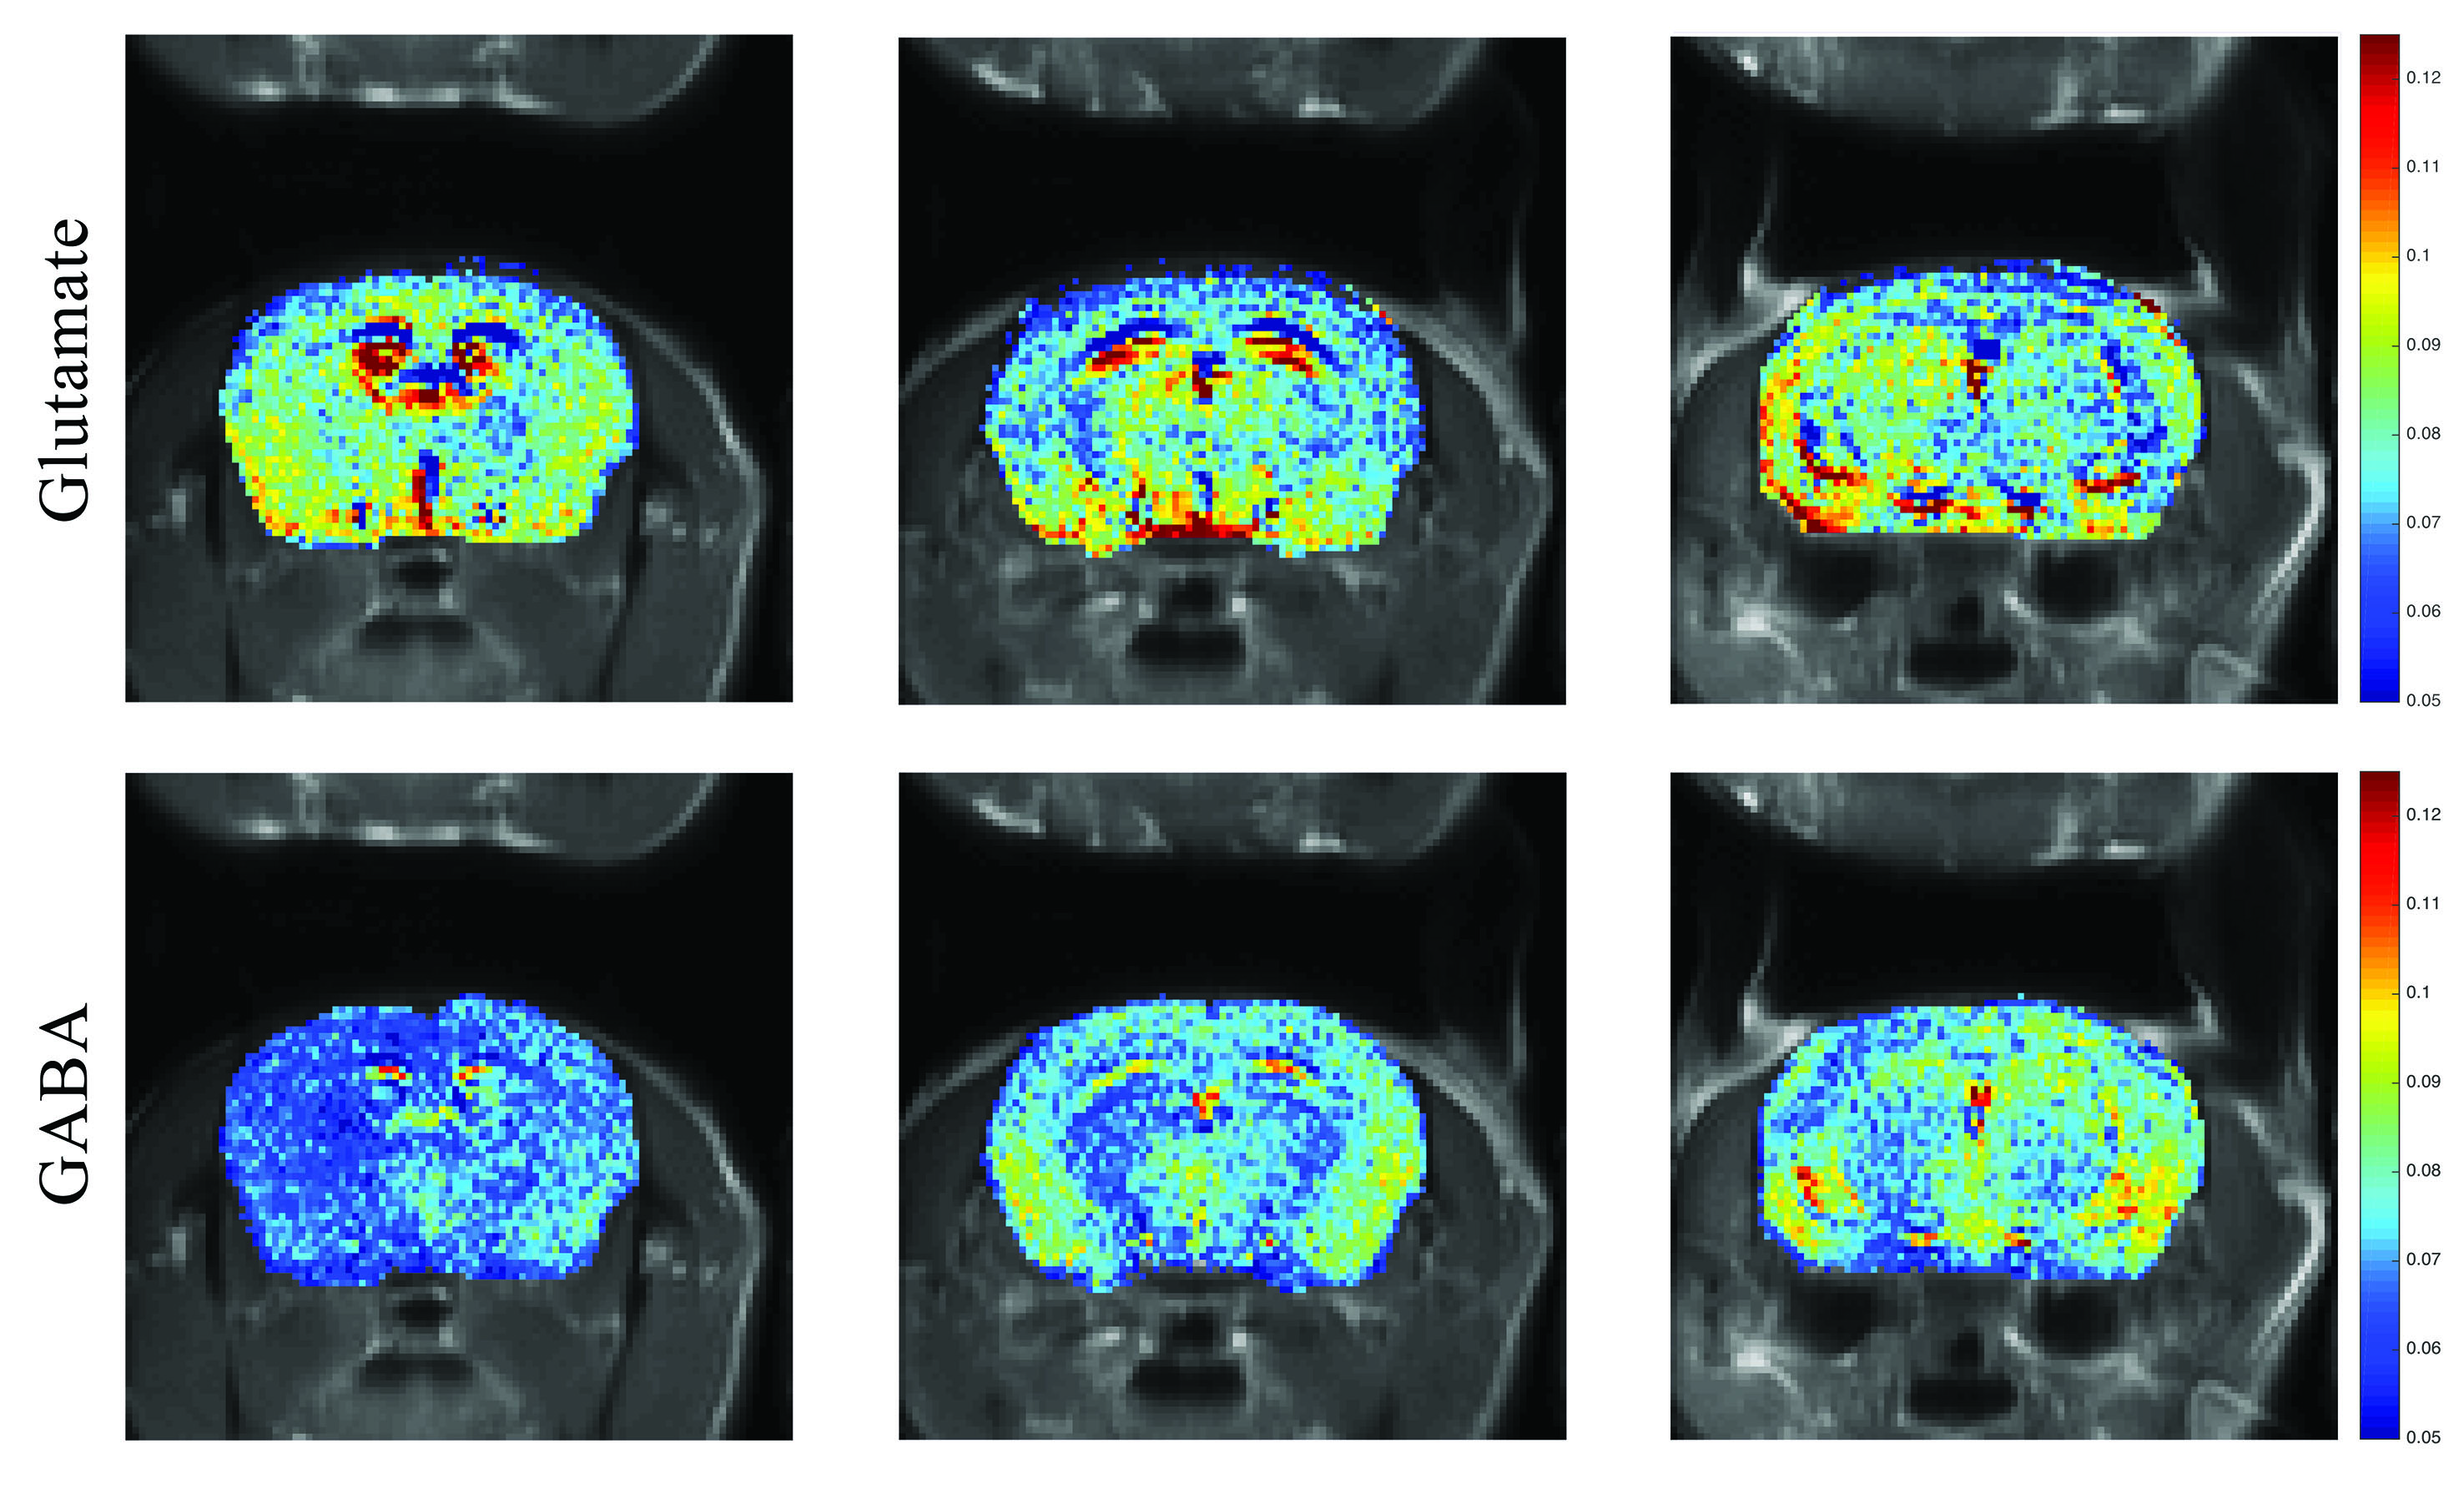
IN VIVOIn-vivo orCEST experiments resolving Glu and GABA in mice are shown in Figure 5. GABA signals are much lower compared to Glu signals, as expected [9].
CONCLUSION
orCEST is a useful methodology for improving specificity in CEST. Glu and GABA can be resolved by a simple subtraction; other metabolites (e.g., myo-Inositol, Creatine [7]) can likely benefit from orCEST specificity enhancements.Acknowledgements
This study was funded by a grant the from the European Research Council (ERC) under the European Union’s Horizon 2020 research and innovation programme (Starting Grant, agreement No. 679058).References
1. Novotny, E. J., Fulbright, R. K., Pearl, P. L., Gibson, K. M. & Rothman, D. L. Magnetic resonance spectroscopy of neurotransmitters in human brain. Ann. Neurol. 54 Suppl 6, S25-31 (2003).
2. Agarwal, N. & Renshaw, P. F. Proton MR spectroscopy-detectable major neurotransmitters of the brain: biology and possible clinical applications. AJNR Am J Neuroradiol 33, 595–602 (2012).
3.Cai, K. et al. Magnetic resonance imaging of glutamate. Nat. Med. 18, 302–306 (2012).
4. Feliks Kogan, et al, Imaging of glutamate in the spinal cord using GluCEST, Neuroimage. 2013 Aug 15; 77: 262–267
5. Cai,K. et al Mapping glutamate in subcortical brain structures using high resolution GluCEST MRI, NMR Biomed. 2013 Oct 26(10):1278-84
6. Mahesh R. Patel, et al, Half-Fourier Acquisition Single-Shot Turbo Spin-Echo (HASTE) MR: Comparison with Fast Spin-Echo MR in Diseases of the Brain, AJNR Am J Neuroradiol 18:1635–1640, October 1997
7. Haris, M., Cai, K., Singh, A., Hariharan, H. & Reddy, R. In vivo mapping of brain myo-inositol. Neuroimage 54, 2079–2085 (2011)
8. Tkác I, Oz G, Adriany G, Ugurbil K, Gruetter R., The neurochemical profile quantified by in vivo 1H NMR spectroscopy , NeuroImage 61 (2012) 342–362
Figures