3777
Towards Fast Quantitative CEST: A New Model for Quantifying the CEST Effect in the Presence of MT1FMRIB, University of Oxford, Oxford, United Kingdom, 2Vanderbilt University Institute of Imaging Science, Vanderbilt University, Nashville, TN, United States, 3Department of Biomedical Engineering, Vanderbilt University, Nashville, TN, United States, 4Department of Radiology and Radiological Sciences, Vanderbilt University, Nashville, TN, United States, 5Department of Ophthalmology, Vanderbilt University, Nashville, TN, United States
Synopsis
Basic models to characterize the CEST effect in vivo suffer from competing magnetization transfer (MT) effects. Here, we use qMT to model the CEST effect and derive CEST indices that are independent of MT. Additionally, simultaneously assessing the MT and CEST effects provides more robust estimates of other elements of the MT effect. Simulations and initial in vivo findings suggest that combining MT and CEST fitting provides a more accurate fit of CEST z-spectra than a traditional single pool Lorentzian fit, and thus provides estimates of the CEST effect that are not dependent on the MT effect.
Purpose
Chemical Exchange Saturation Transfer (CEST) is an MRI technique sensitive to the presence of low concentration mobile protons exchanging with water, such as the backbone amide protons of proteins. While several existing analysis techniques (e.g. Lorentzian difference measurements1) attempt to quantify these metabolites, they are sensitive to magnetization transfer (MT), caused by large macromolecular molecules, and thus, the accuracy of these CEST analyses are diminished.
Methods to quickly quantify the MT effect in quantitative magnetization transfer (qMT) from a two-pool model of the Bloch-McConnell equations have been developed2,3, however, several assumptions (no transverse components, saturation pulse approximated as rectangular pulse) are made which prevent this model from being utilized for CEST analyses (offset (Δω)<1kHz)2. By removing these assumptions, we have created a two-pool (Water+MT) qMT model that can be solved more rapidly than other quantitative CEST models by generating a fit to a CEST+qMT z-spectra, simultaneously estimating the CEST effect free of MT interference, and the macromolecular composition in tissue.
Methods
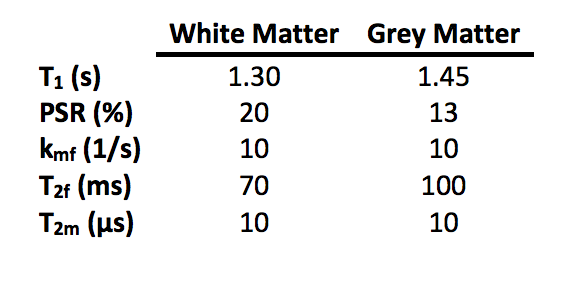
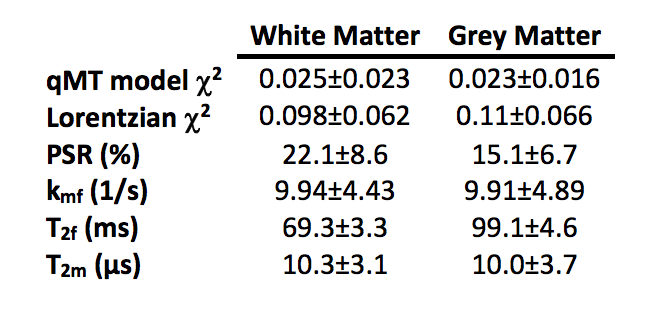
All analyses were performed in MATLAB (Mathworks, Natick, MA). Monte Carlo simulations were performed by numerically simulating a two-pool model (Water+MT) of the Bloch-McConnell equations for typical values for white matter (WM) and grey matter (GM) (Table 1). Simulated CEST data was generated using a 2µT, 75-ms sinc-Gauss pulse over 31 offsets evenly spaced between ±5ppm; qMT data was generated using a 20-ms sinc-Gauss pulse with saturation flip angle $$$\alpha_{MT}$$$= [360°,820°], and Δω=1, 1.5, 2, 2.5, 8, 16, 32, 100kHz. Gaussian noise was added (SNR=60), and the qMT model fit was performed over 1,000 noise realizations. $$$\chi^2$$$-values were calculated over each noise realization to evaluate the goodness-of-fit. A Lorentzian fit1 was also performed to compare the qMT model against an established CEST analysis technique.
A single volunteer (female, 22 years old) was imaged in a 3T Achieva scanner (Philips, the Netherlands). A two-channel body coil was used for excitation, and a 32-channel head coil was used for signal reception. Two SPGR experiments were performed: a qMT acquisition and a CEST acquisition sensitized to amides (APT). The CEST protocol was acquired using a 2μT, 150-ms sinc-Gauss pulse over 36 offsets, applied asymmetrically between ±5ppm with a TR/TE/$$$\alpha_{EX}$$$/EPI-Factor=302-ms/8.6-ms/15°/7. The MT protocol was performed using a 20-ms, sinc-Gauss pulse with a TR/TE/$$$\alpha_{EX}$$$/EPI-Factor=50-ms/7.4-ms/10°/5, $$$\alpha_{MT}$$$= [360°,900°], and Δω=1, 1.5, 2, 2.5, 8, 16, 32, 100kHz. B1, B0, and T1 acquisitions were also acquired to correct for field inhomogeneities and to independently calculate T1 maps4. All acquisitions used a FOV of 220x220x20-mm3 over four slices, SENSE=2, at a resolution of 1x1x5-mm3.
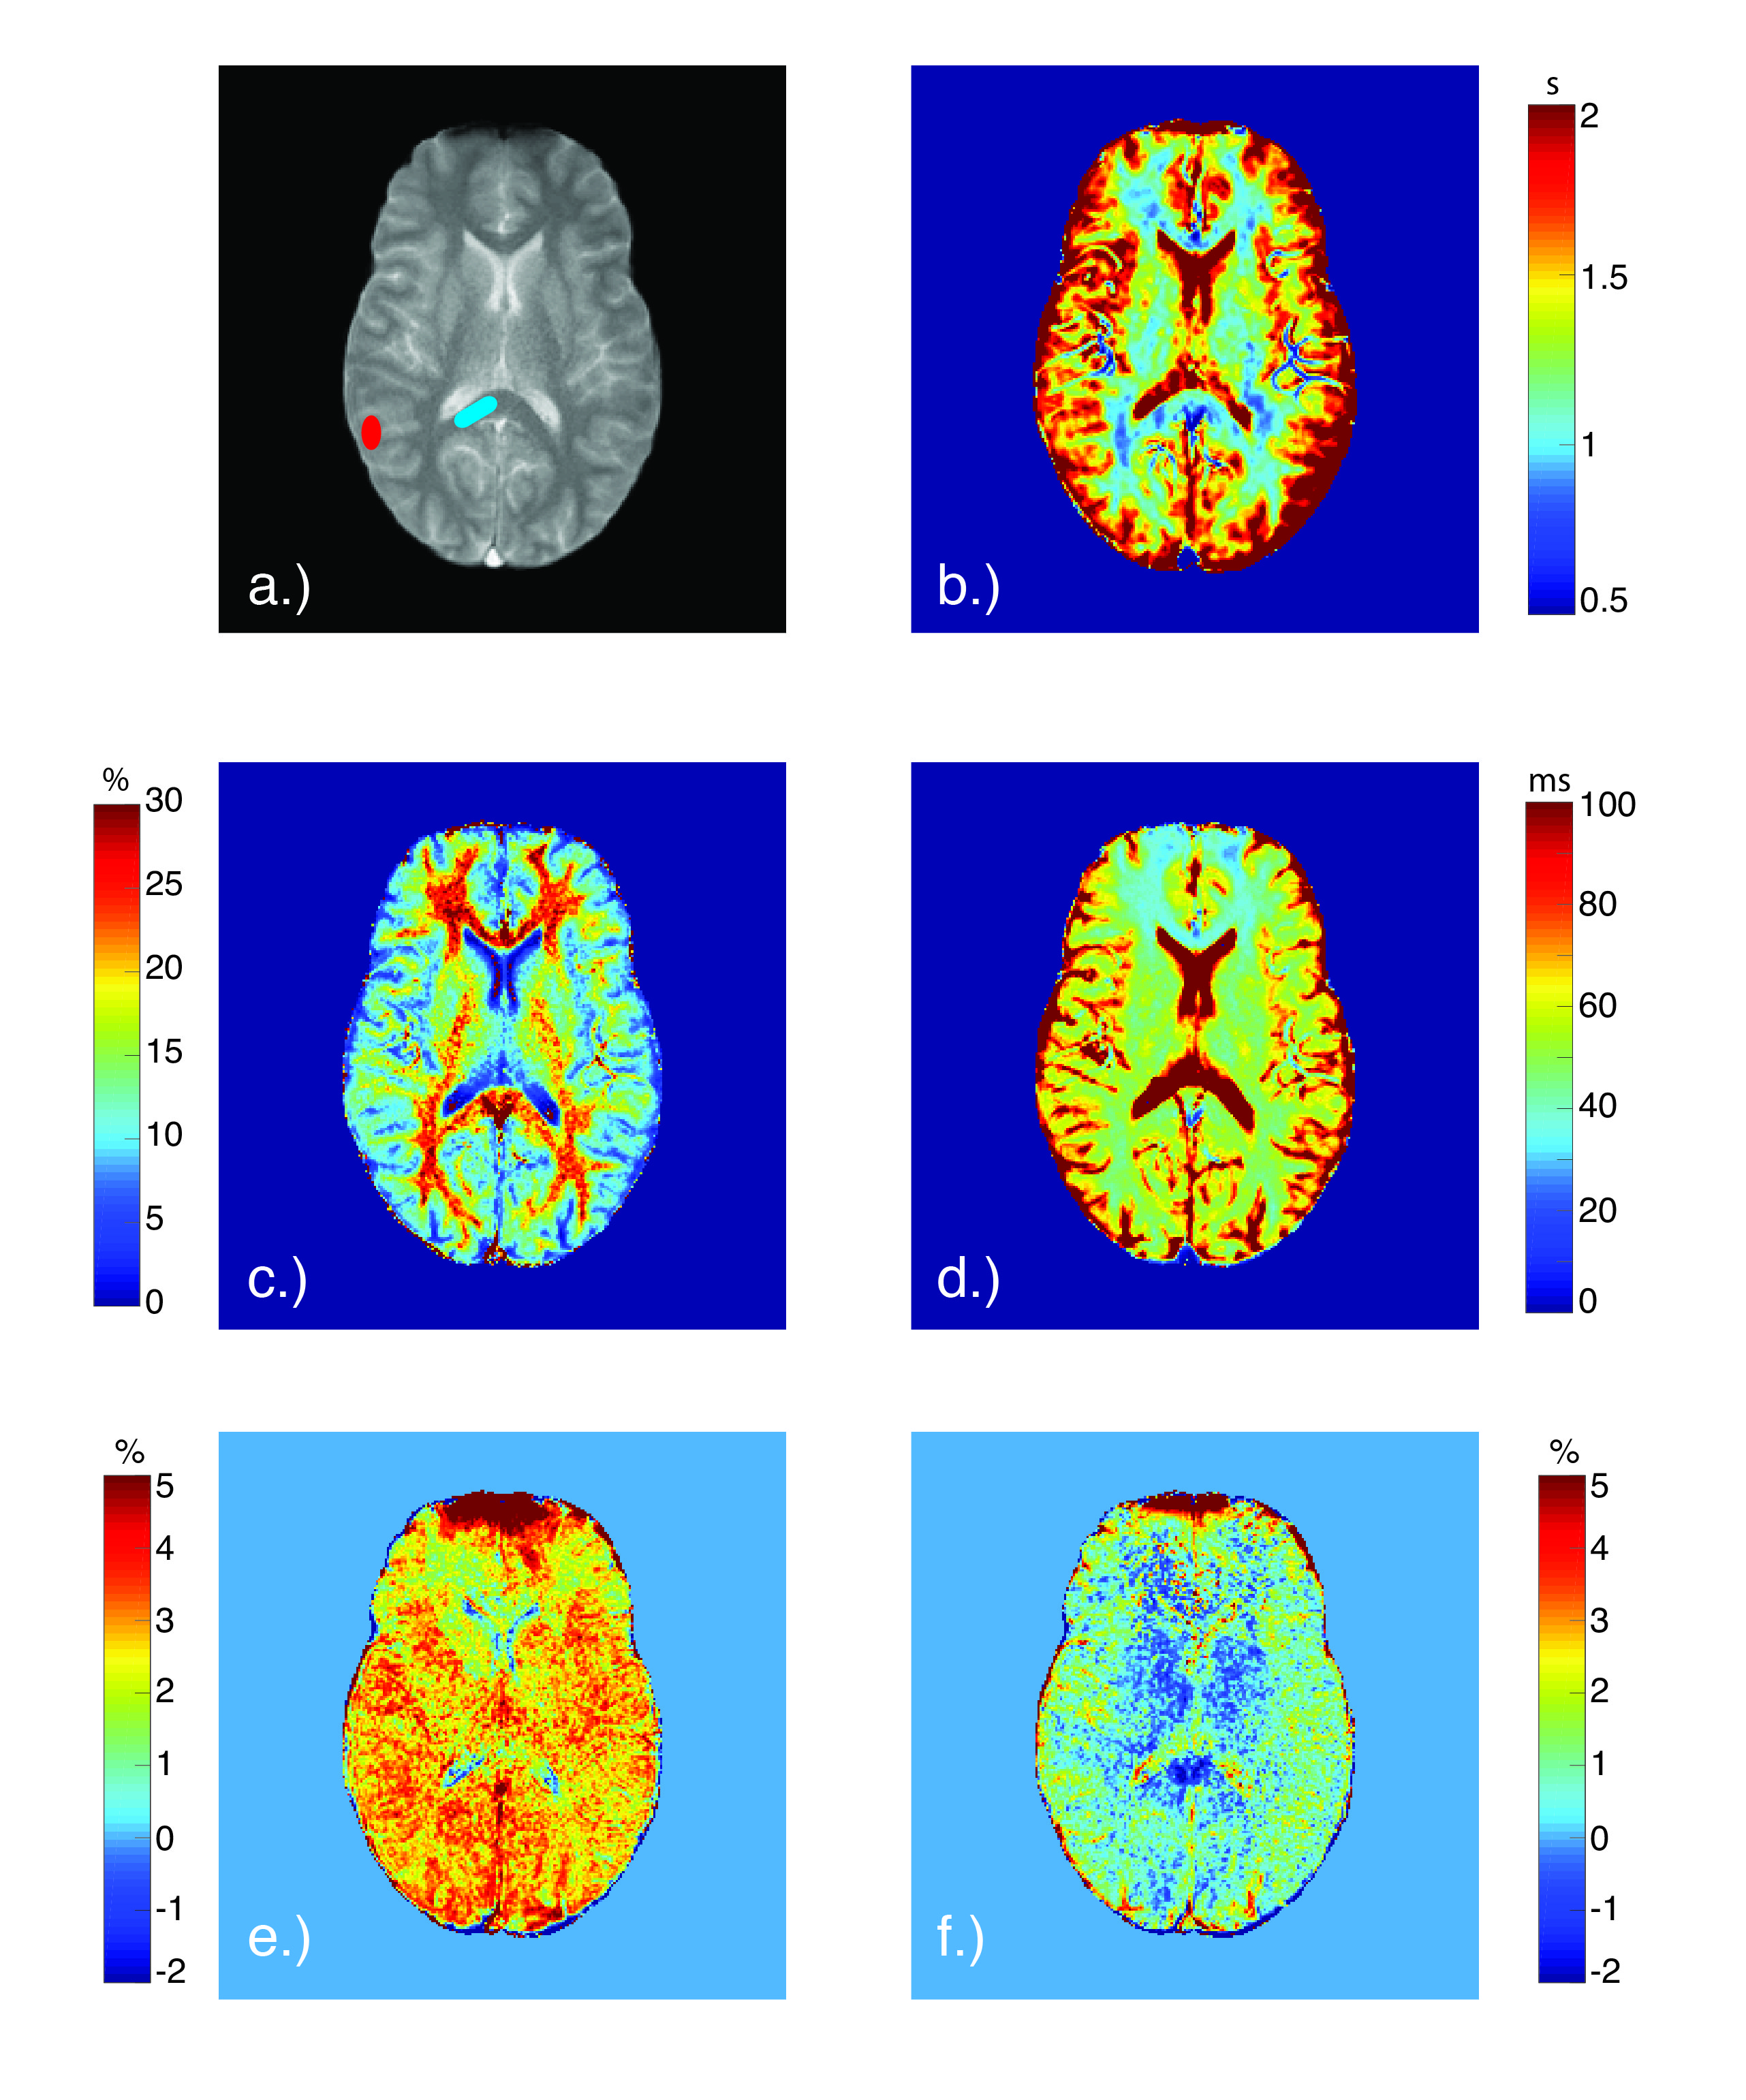
Normalized (to S0) MT and CEST data were used to generate qMT parameter maps for each voxel using the qMT model to estimate the macromolecular (m) to free (f) pool size ratio (PSR), exchange rate (kmf), and relaxation times $$$(T_2^{f,m})$$$. The qMT parameter maps were then used to generate signal data from 3-4ppm, and the APT-CEST effect was calculated by finding the integral of the residuals (difference between CEST data and generated fits), a so-called area under the curve (AUC) analysis, from 3-4ppm. The data was also fit to a Lorentzian function1 to compare with established techniques.
Mean AUC values for the qMT and Lorentzian models, and for all qMT parameters, were calculated from manually-defined regions of interest (ROI) in the GM and WM (Figure 2). The mean values for each tissue type and fitting methodology were then compared.
Results
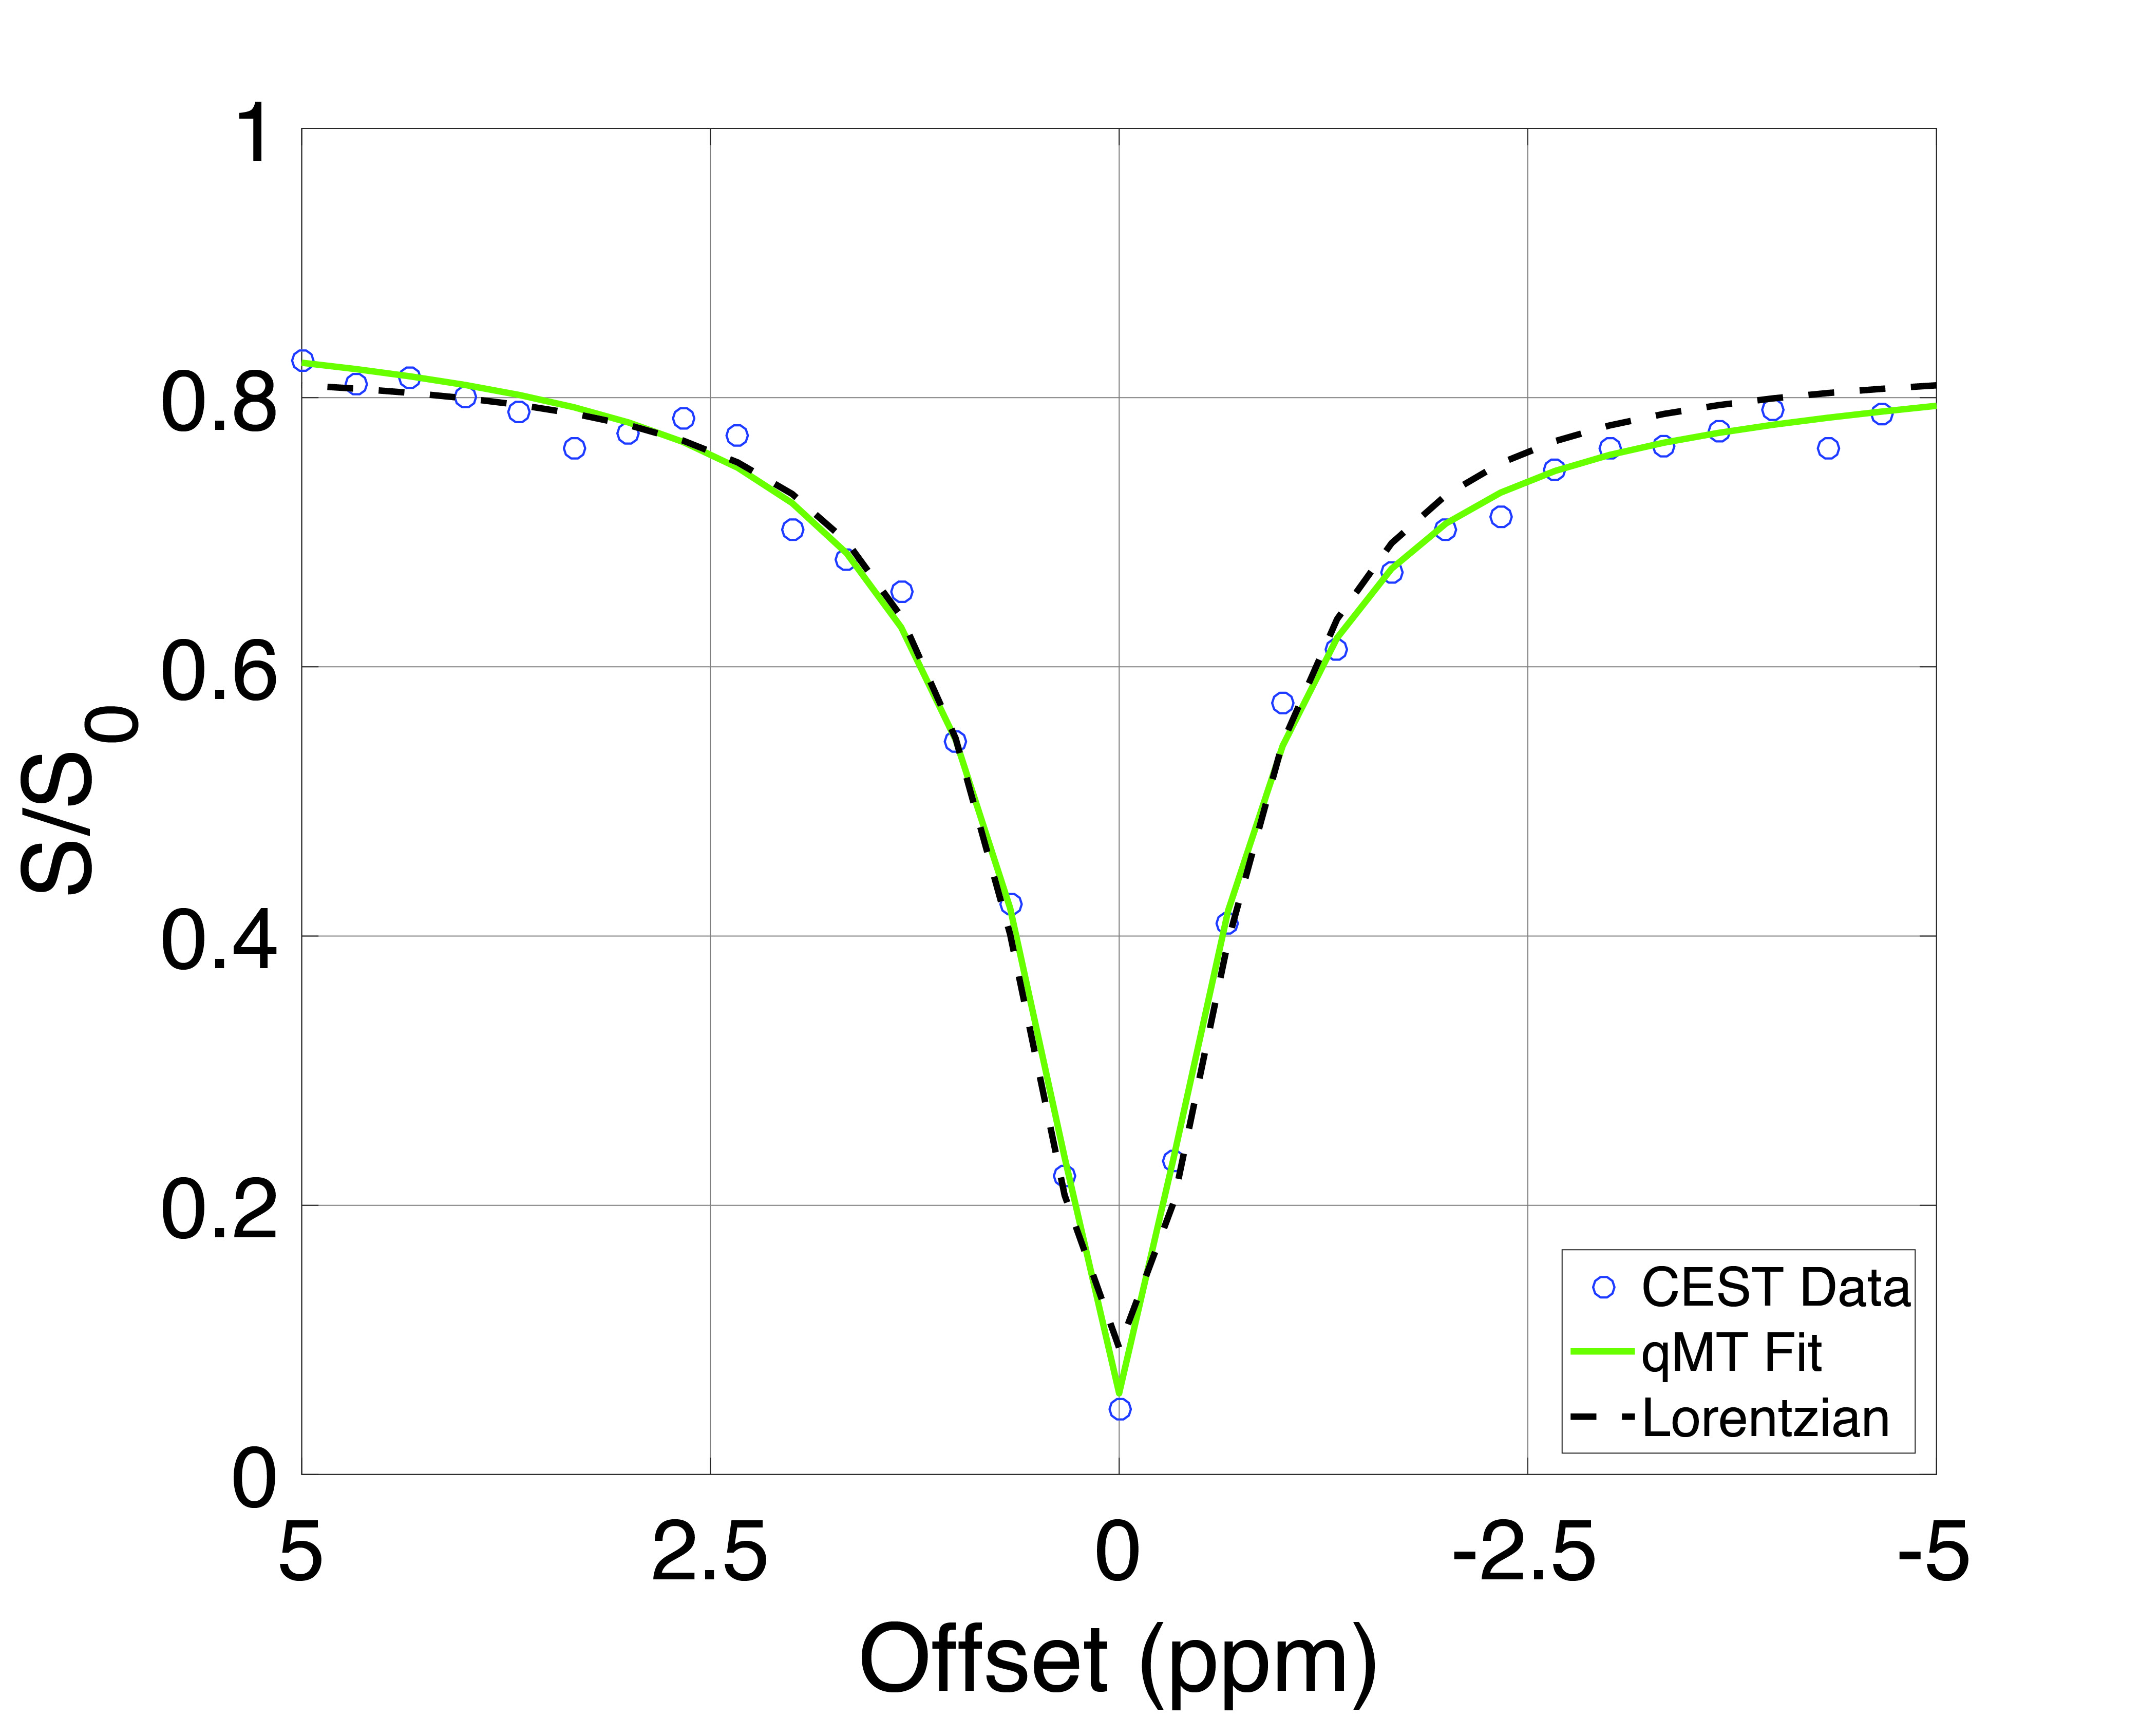
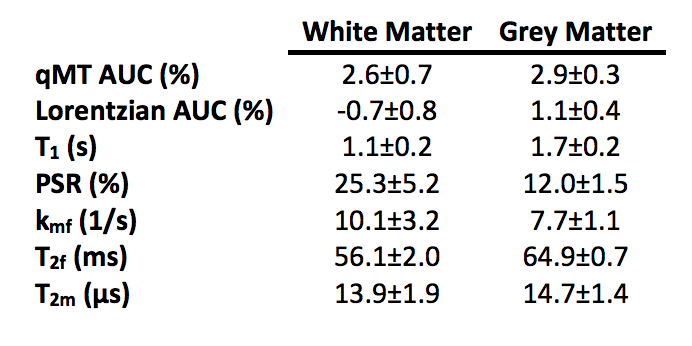
Figure 1 and Table 2 demonstrate fitting results using the Lorentzian and qMT models. Incorporating the MT pool into the CEST data significantly improves the fit (Wilcoxon rank-sum test between qMT and Lorentzian model $$$\chi^2$$$-values=p<0.001 for WM and GM), while still estimating qMT values close to what was prescribed (Table 2). Figure 2 and Table 3 display the in vivo results. The qMT model provides higher AUC than the Lorentzian model: importantly, the qMT model shows no WM/GM differences, consistent with recent reports of APT-CEST in healthy volunteers5. Furthermore, the estimated mean qMT parameters are consistent with established qMT parameter estimates2 (Table 3), with the exception of $$$T_2^f$$$, which shows elevated values more closely matched with T2 values from the literature6, indicating points close to 0ppm may provide a more accurate representation of the free pool than other qMT models.Discussion
We demonstrate a more quantitative characterization of the APT-CEST effect than has been previously described using MT to inform the fitting method. These findings provide insight into providing quantitative CEST metrics free from the influence of MT effects, and thus, are a more unbiased measure of the CEST effect than is currently available.Acknowledgements
Funding provided by: Whitaker International Program Fellowship, NIH/NCI R25 CA136440, DOD W81XWH-13-0073, NIH/NIBIB R21 NS087465-01, NIH/NIBIB R01 EY023240 01A1 and The National MS Society.References
1. Jones, CK, et al. MRM, 2012. 67(6): p. 1579-1589.
2. Yarnykh, VL. MRM, 2002. 47(5): p. 929-939.
3. Listerud, J. MRM, 1997. 37(5): p. 693-705.
4. Smith, SA, et al. MRM, 2008. 60(1): p. 213-219.
5. Khlebnikov, V, et al. JMR, 2016. 272: p. 82-86.
6. Lu, H, et al. JMRI, 2005. 22(1): p. 13-22.
Figures