3776
Dominant pH-sensitive amide proton transfer effect during acute ischemic stroke - Quantification of multi-pool contribution to commonly used MTRasym analysis in a rat model of acute strokeYin Wu1, Iris Yuwen Zhou2, Jing Zhao1, and Phillip Zhe Sun2
1Paul C. Lauterbur Research Center for Biomedical Imaging, Shenzhen Institutes of Advanced Technology, Chinese Academy of Sciences, Shenzhen, People's Republic of China, 2Athinoula A. Martinos Center for Biomedical Imaging, Department of Radiology, Massachusetts General Hospital and Harvard Medical School, MA, United States
Synopsis
Routinely used magnetization transfer (MT) asymmetry in measurement of pH-sensitive amide proton transfer (APT) effect is susceptible to concomitant contributions, including semisolid MT and nuclear overhauser effect (NOE). In this study, multi-pool contribution from NOE, MT, CEST at 2 ppm and APT during the acute stroke was resolved with a sum of five Lorentzian functions. Results confirmed the changes in MT and NOE offset each other, and reduction of APT was approximately two-fold of the CEST effect decrease at 2 ppm, dominating the commonly observed pH-sensitive MTRasym change during acute stroke.
Introduction
Magnetization transfer (MT) asymmetry is routinely calculated to measure pH sensitive amide proton transfer (APT) effect. 1, 2 However, MT asymmetry is susceptible to concomitant contributions, including semisolid MT and nuclear overhauser effect (NOE). 3 The aim of this study was to quantify multi-pool contribution from NOE, MT, CEST at 2 ppm and APT during the acute stroke 4 in order to elucidate the conventional MTRasym effect in the characterization of acute stroke ischemia.Materials and methods
Adult male Wistar rats (n=8) underwent MRI 60 min after unilateral middle cerebral artery occlusion on a 4.7 T scanner. Multi-slice echo planar imaging (5 slices, slice thickness/gap=1.8/0.2 mm, FOV=20×20 mm2, matrix size=48×48) was acquired, including diffusion MRI ( b=250 and 1000 s/mm2, TR/TE=3250/42 ms, 16 averages, scan time=1.5 min), arterial spin labeling MRI (TR/TE=5400/20 ms, time of saturation (TS)=3400 ms, 32 averages, B1=4.7 μT, labeling distance of 15 mm, and scan time=2 min) and APT MRI (frequency offsets between ±6 ppm with intervals of 0.25 ppm, B1=1.5 μT, TR/ TS/TE = 6500/3000/10 ms). In addition, WASSR map was collected with B1=0.5 μT (frequency offsets between ±0.5 ppm with intervals of 0.05 ppm) for field inhomogeneity correction. Perfusion and diffusion lesions were manually segmented. Z-spectrum was flipped as 1- Sz/S0 and fitted with a sum of five Lorentzian functions corresponding to NOE, MT, direct water saturation, CEST and APT effects at -3.2, -1.5, 0, 2.0 and 3.5 ppm, respectively 4, and multi-pool contribution was quantified in ADC lesion, CBF lesion and their mismatch, and their corresponding contralateral normal regions. One-way ANOVA with Bonferroni correction was conducted and P<0.05 was considered statistically significant.Results
Fig. 1 shows manually segmented perfusion and diffusion lesions. Flipped Z-spectra from lesion and respective control areas were fitted with a sum of five Lorentzian functions, from which individual CEST effects of the five contributors to Z-spectra were resolved (Fig. 2). Figure 3 shows maps of the conventional MTRasym and resolved NOE, MT, CEST at 2 ppm and APT effect maps. In all the three lesion regions, MT effect increased significantly while CEST effects of NOE, CEST at 2 ppm, APT and routinely measured MTRasym decreased significantly (Fig. 4). Absolute change of CEST effects between ischemia and control regions were listed in Table 1. The change in MT and NOE has no significant difference among the three lesion regions, and furthermore, their comparably opposite alteration trend led to negligible contributions (<0.2%) to the routine MTRasym. Meanwhile, CEST effect at 2 ppm and APT presented significantly greater alterations in ADC and CBF lesions compared to ADC/CBF lesion mismatch. Importantly, APT reduction was shown to approximately two-fold of that at 2 ppm in all the three lesion regions, demonstrating the dominant contribution of APT effect to commonly observed pH-sensitive MTRasym change during acute stroke.Discussion and conclusion
APT imaging has been shown capable of dividing perfusion/diffusion mismatch into regions of benign oligemia and metabolic penumbra, refining ischemic tissue delineation. We quantified multi-pool contribution to elucidate the contrast mechanism of MTRasym in acute ischemia. Results confirmed the changes in MT and NOE offset each other, and pH-sensitive amide proton transfer effect dominates the commonly used MTRasym effect.Acknowledgements
Financial support from National Basic Research Program of China (2015CB755500), NSFC (81571668), SSTP (JCYJ20140610151856743 and GJHZ20160229200622417).References
[1] JY Zhou, JF Payen, DA Wilson, RJ Traystman, PCM van Zijl. Using the amide proton signals of intracellular proteins and peptides to detect pH effects in MRI. Nature Medicine 2003;9(8):1085-1090 [2] KT Jokivarsi, HI Grohn, OH Grohn, RA Kauppinen. Proton transfer ratio, lactate, and intracellular pH in acute cerebral ischemia. Magnetic Resonance in Medicine 2007;57:647-653 [3] X Zhao, Z Wen, F Huang, S Lu, X Wang, S Hu, D Zu, JY Zhou. Saturation power dependence of amide proton transfer image contrasts in human brain tumors and stroke at 3 T. Magnetic Resonance in Medicine 2011,66:1033-1041 [4] K Cai, A Singh, H Poptani, W Li, S Yang, Y Lu, H Hariharan, XJ Zhou, R Reddy. CEST signal at 2ppm (CEST@2ppm) from Z-spectral fitting correlates with creatine distribution in brain tumor. NMR in Biomedicine 2015,28(1):1-8Figures
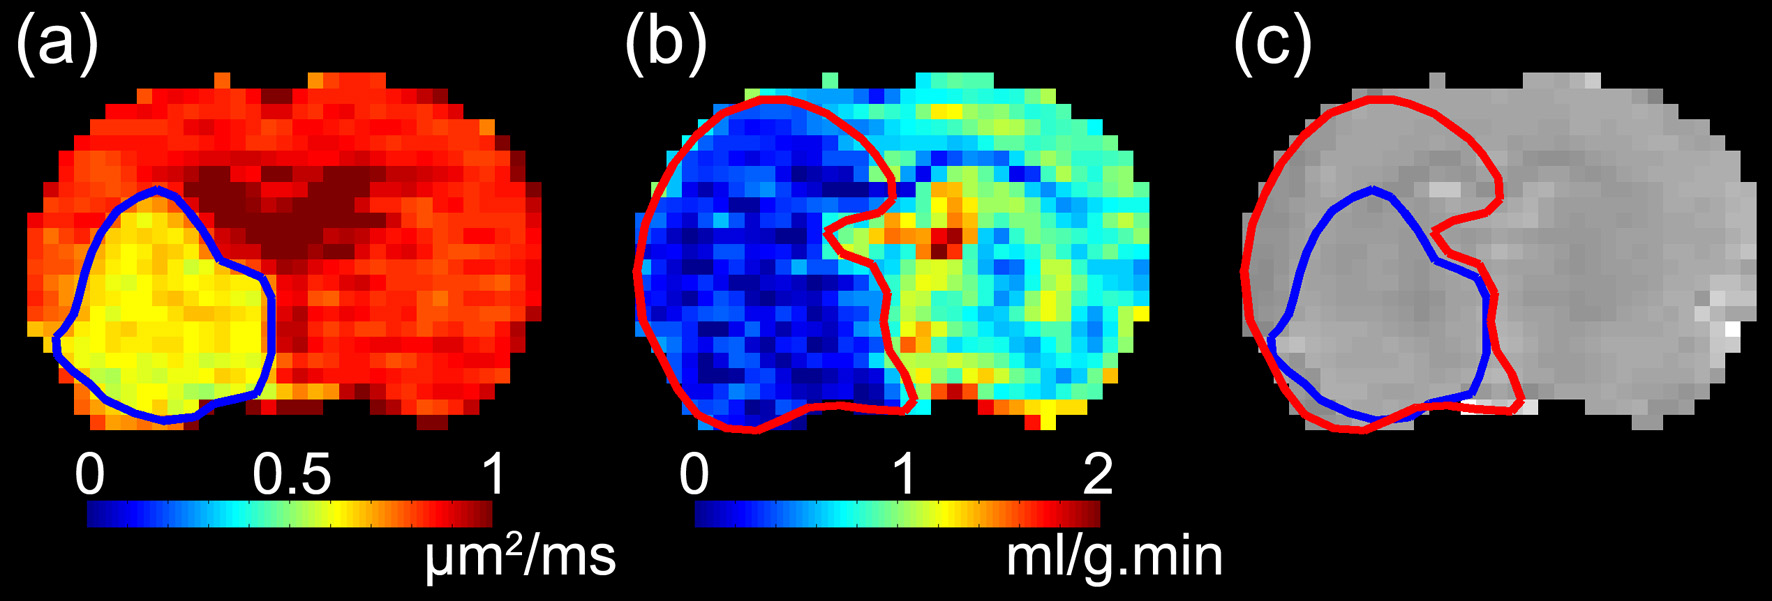
Figure
1. (a) ADC and (b) CBF lesions overlaid
on (c) corresponding T2-weighted anatomical image.
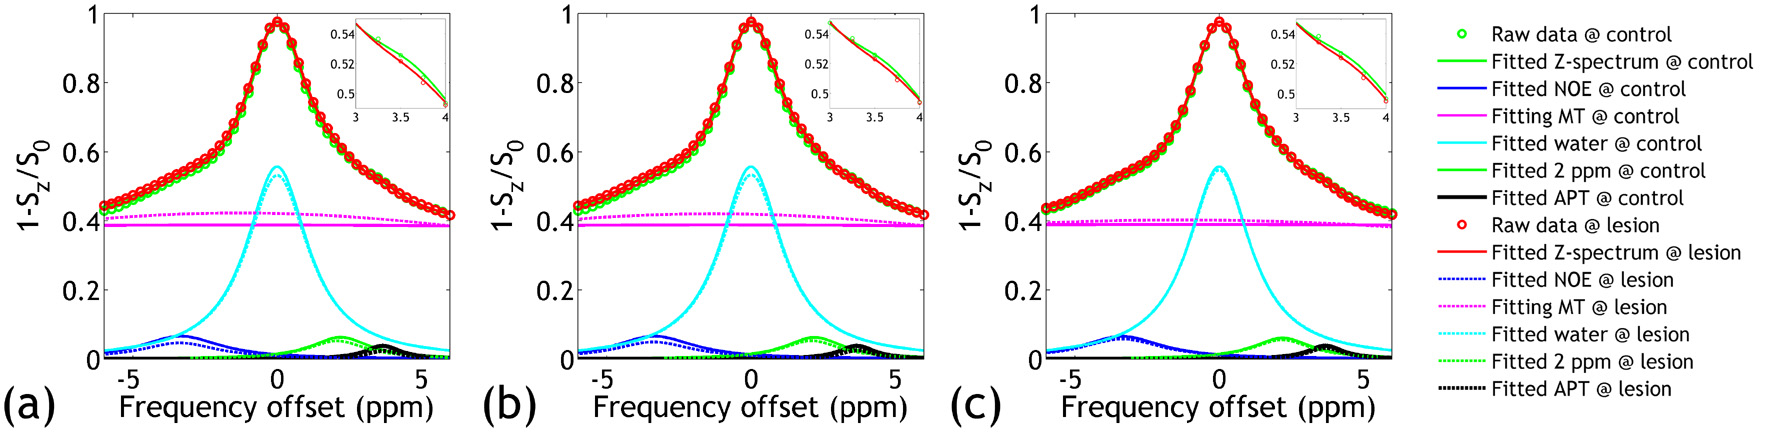
Figure
2.
Fitting of Z-spectra to a sum of five Lorentzian functions in (a) ADC lesion,
(b) CBF lesion, and (c) ADC/CBF lesion mismatch and respective control areas.
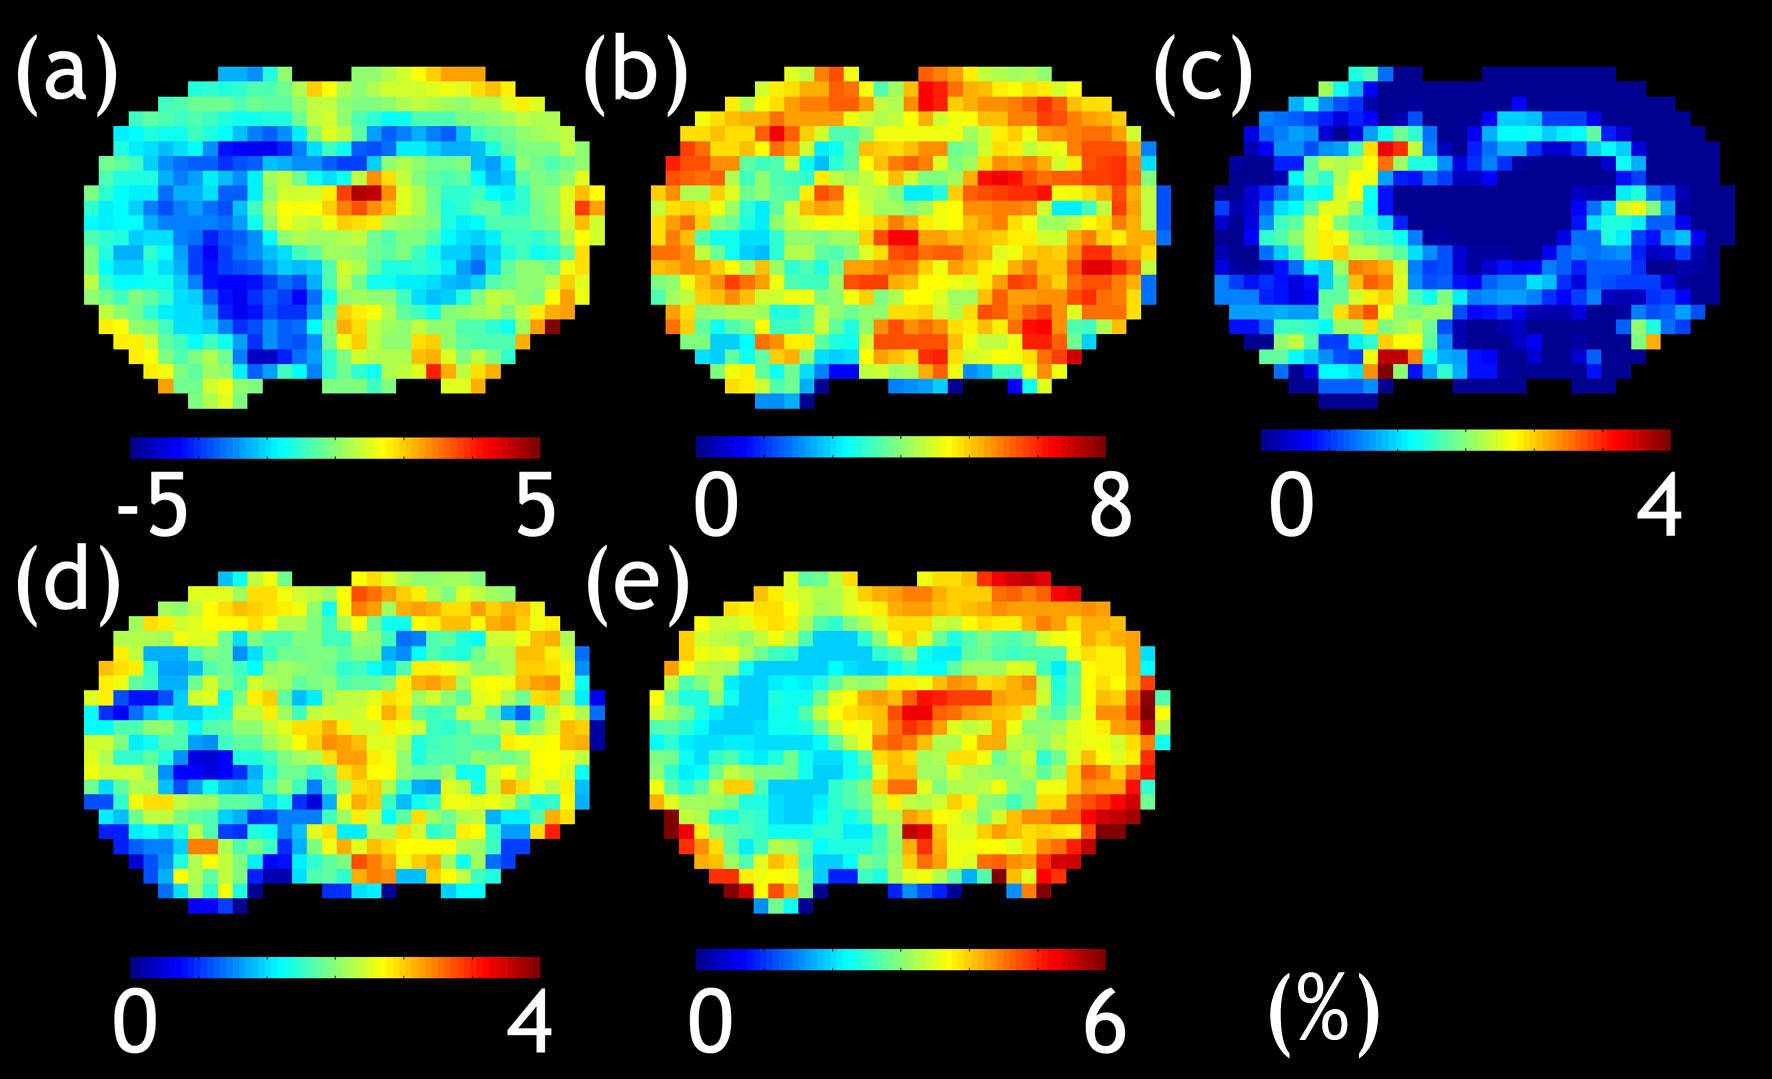
Figure
3.
Maps of (a) MTRasym, and the resolved (b) NOE, (c) MT, (d) CEST at 2
ppm and (e) APT effects.
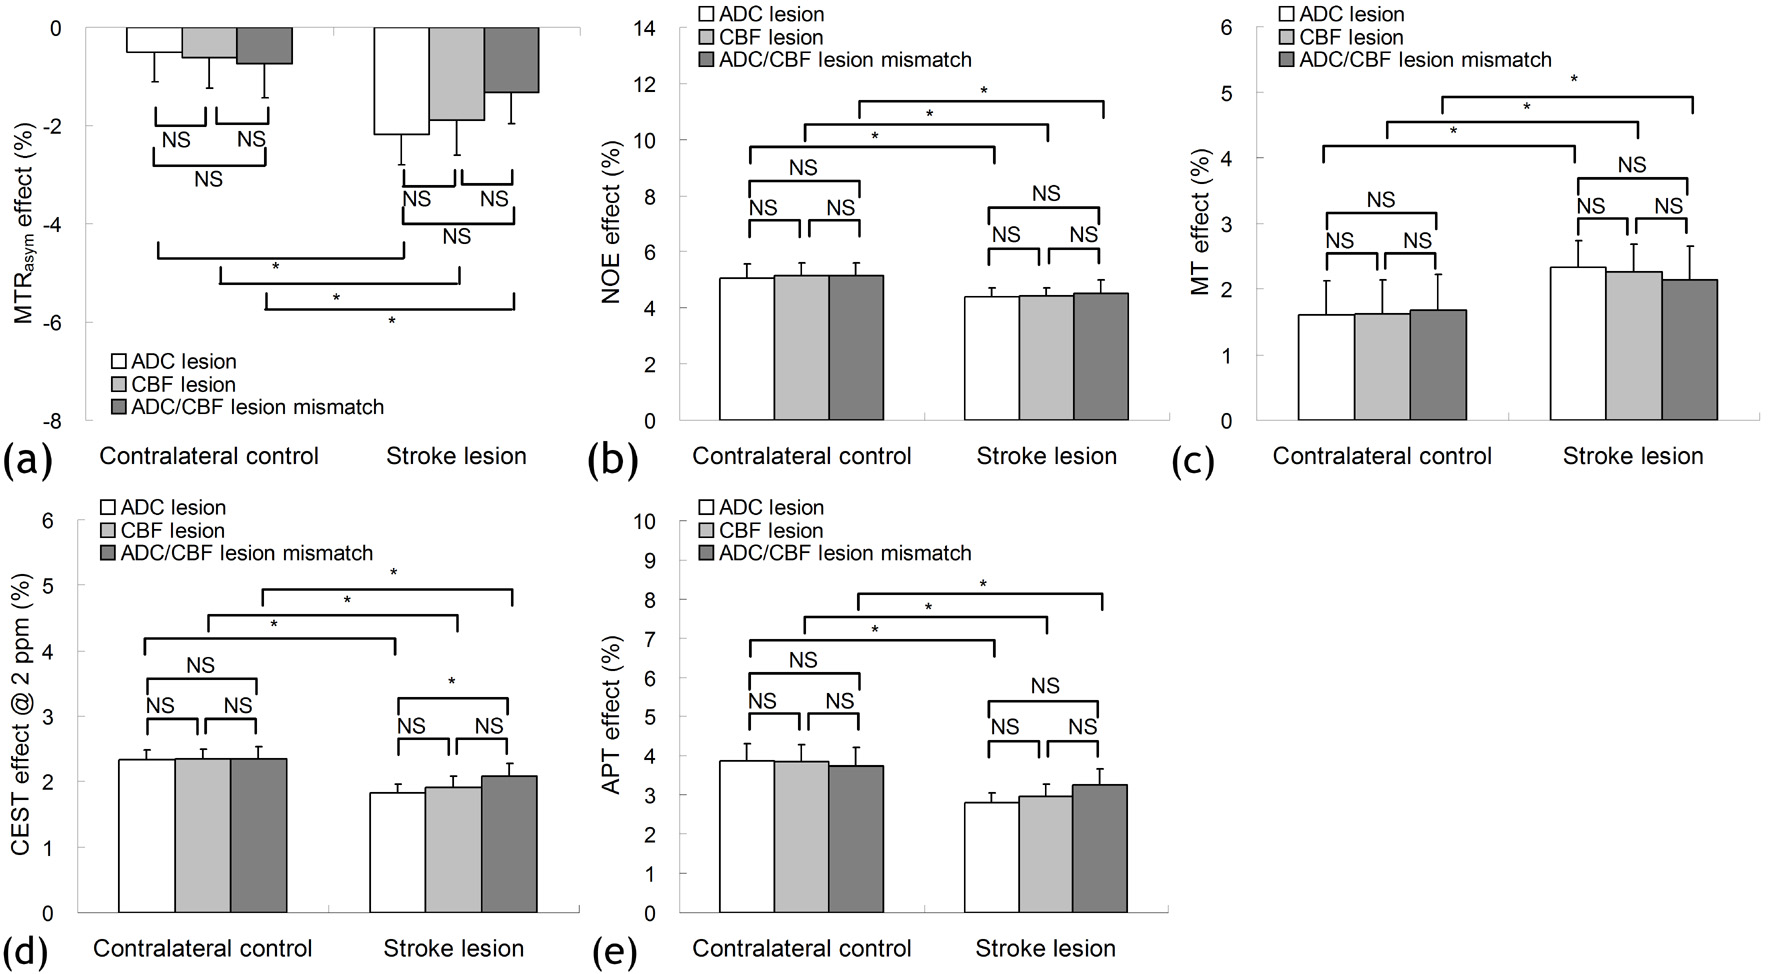
Figure
4.
Values of (a) MTRasym, and the resolved (b) NOE, (c) MT, (d) CEST at
2 ppm and (e) APT effects in ADC lesion, CBF lesion, ADC/CBF lesion mismatch
and respective contralateral controls.
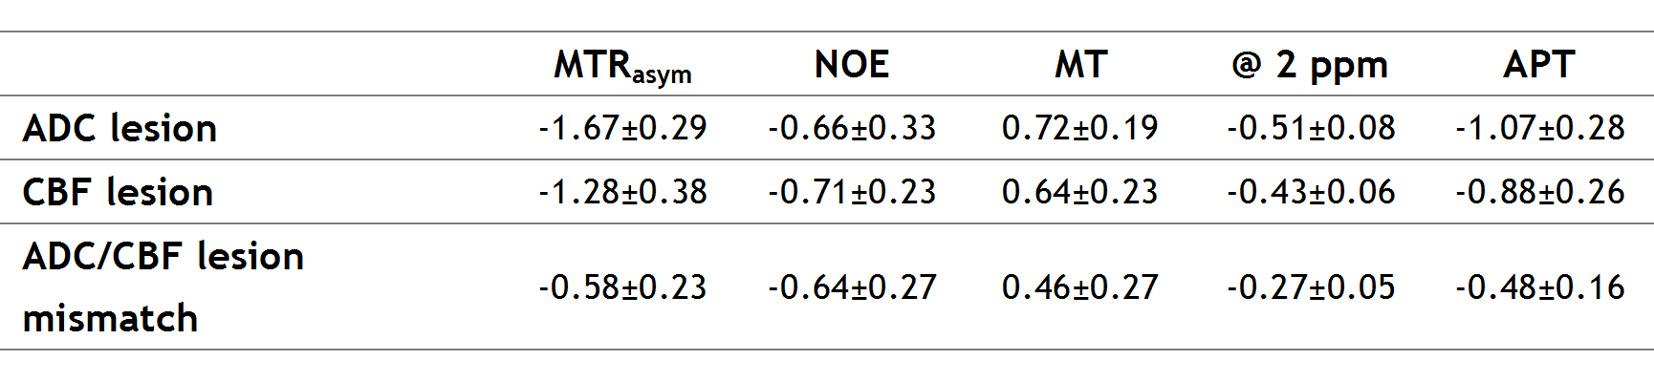
Table
1. Absolute
alteration of CEST effects between ischemia lesion and contralateral control
regions. The unit is %.