3775
Human cardiac creatine by CrCEST: potential improved fitting methods1OCMR, RDM Cardiovascular Medicine, University of Oxford, Oxford, United Kingdom, 2Department of Engineering Science, University of Oxford, Oxford, United Kingdom
Synopsis
The development of a novel CEST technique optimised to measure creatine in the human heart. After unsuccessful measurement of in vivo creatine concentrations using MTRasym, more robust model-based analysis methods based on spectral line shapes were tested and implemented on phantom data, with these model-based methods showing significant improvement to MTRasym analysis. Going forward, the developed pulse sequence combined with the model-based analysis methods are a promising step towards human cardiac creatine CEST.
Purpose
During
heart failure, concentrations of creatine (Cr) in the myocardium, are notably
reduced.1 Creatine CEST
(CrCEST) has been demonstrated as a potential method for measuring these depleted myocardial creatine concentrations in animal models,2 the first preliminary human cardiac CrCEST results have been reported.3 This
abstract aims to implement a new pulse sequence capable of detecting creatine
concentrations in the human heart and to find a more robust method of analysing cardiac
CrCEST spectra than conventional MTRasym.
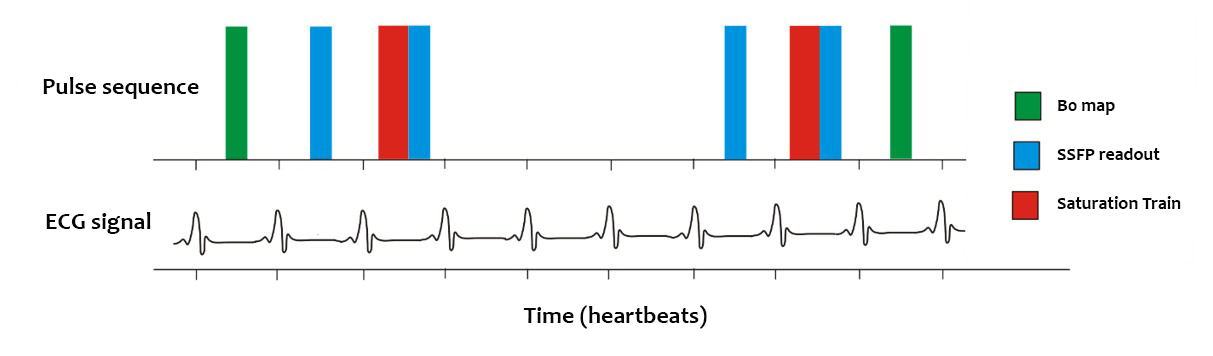
Implementation of CrCEST sequence in vivo
Methods
Data acquisition: All images were acquired using a whole-body clinical 3 T Trio MRI scanner with a 32-channel cardiac coil. The CrCEST imaging sequence (Fig. 1) acquires two points in the z-spectrum per breath hold. It was run approximately 30 times in succession during separate breath holds with different saturation offsets to produce a z-spectrum. Healthy subjects were recruited and scanned in compliance with ethical and legal requirements.
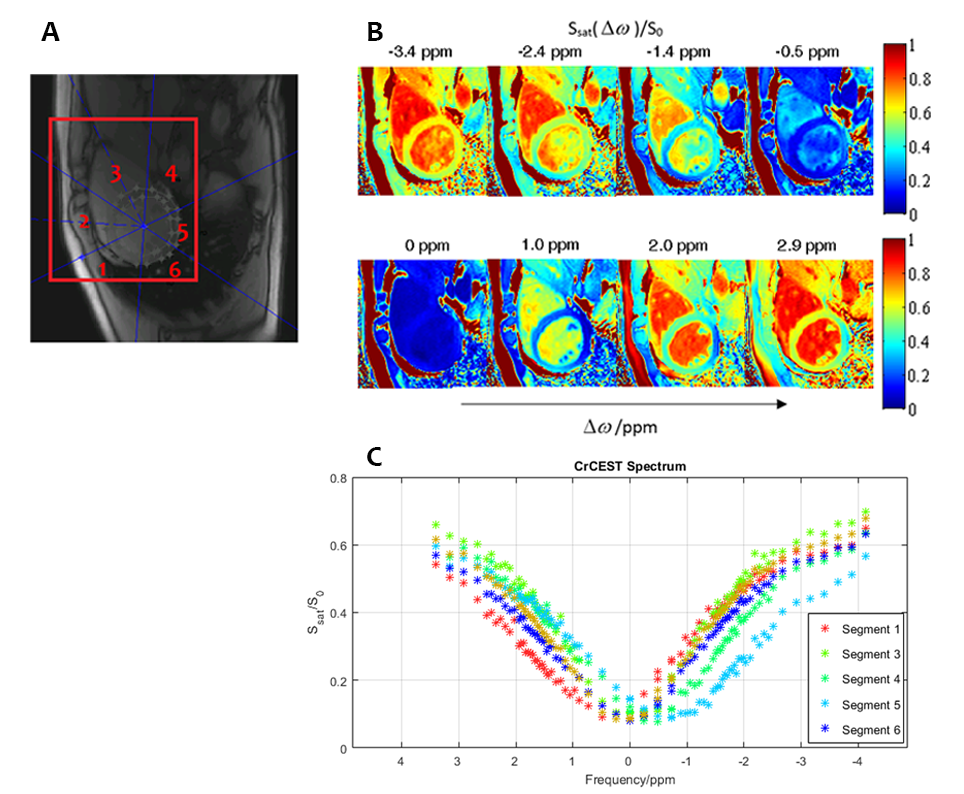
Data processing: ROIs covering the mid short-axis slice of the left ventricle were manually drawn for each series of CEST images (i.e. from each breath-hold) and divided into 6 AHA segments. The frequency difference from the B0 field map generated from each breath-hold was applied to correct the saturation efficiency map from the same breath-hold on a pixel-by-pixel basis. For a single breath-hold at $$$\omega_{a}$$$ ppm, pixels were retained where $$$\mid\omega_{a}+\triangle B_{0}-1.8ppm\mid\leq0.04ppm$$$. This was similarly done for the $$$\omega_{a}-3.4 ppm$$$ measurement within the same breath-hold. Only a small number of pixels are considered “valid” for each breath-hold. Effectively in the different breath-holds, this method makes a series of guesses at the B0 offset in the heart, and pixels where the guess was accurate to within the specified tolerance level are kept for analysis. MTRasym contrast was then calculated pixel-wise by: $$MTR_{asym}(\triangle\omega)=\left\{S_{sat}(-\triangle\omega)-S_{sat}(\triangle\omega)\right\}/S_{0}$$ and contrast maps produced.
Results:
Fig. 2A shows a reference image of the segmented heart. The saturation efficiency at selected frequencies is plotted in Fig. 2B, and Fig. 2C shows the CrCEST spectra for each of the segments of the heart. The analysis for each of these segments is shown in Fig. 3, with statistics collated and an estimate of [Cr] in each segment, according to a phantom calibration curve.
Discussion:
The estimated [Cr] in segments 1-4 and
6 are within the range that are expected from the 1H-MRS literature.4 The unphysical estimated negative [Cr] in the inferior myocardium (segment 5) shows
that, using the current analysis, the CrCEST pulse sequence is unable to
determine cardiac [Cr] from the whole left ventricle. To
make CrCEST sequence applicable over the whole heart, a method of analysis that
is more robust than MTRasym is therefore required.
Testing Model-based analysis methods
Methods:
Two potential model-based analysis methods were tested. The first of these was a 3-pool model that fitted water, Cr and macromolecular pool peaks to Lorentzian line shapes (the ‘3-pool Lorentzian’ model), the second model (the ‘Mixed spectral line shape model’) modelled the macromolecular pool using a Gaussian line shape and water and creatine as Lorentzian. To test the stability of these methods, Monte-Carlo simulations were performed, where CrCEST signals were simulated by Bloch simulation of our sequence, and normally distributed noise added. Two different phantoms were scanned: the first consisted of different [Cr] dissolved in phosphate buffered saline (PBS) and the second was designed to better mimic human tissue, using an agar gel to reduce the water T1 and T2.
Results:
Results of model-based analysis methods can be seen in Figs. 4 and 5. Fig. 4 presents the results of the Monte Carlo simulations – both model-based methods show reduced bias compared to MTRasym, with mean CrCEST contrast deviating by a maximum of 0.69% for the ‘3-pool Lorentzian’ method and 0.43% for the ‘Mixed spectral line shape’ method (compared to 3.4% for MTRasym). MTRasym analysis successfully detects changes in [Cr] in the PBS liquid phantom (Fig. 5A). However, in gel agar phantom (Fig. 5B) higher CrCEST contrast in regions that correspond to higher [Cr] is visible for model-based methods but not for MTRasym.
Discussion:
Clearly,
the precise construction of the phantom (including
any B0 or B1 artefacts and the concentration of the macromolecular pool) is
important and the effect of these factors need to be investigated further
before [Cr] quantitation can become robust and automated.
Conclusion
We have implemented a multi-breath hold CEST sequence that is successfully able to detect changes of [Cr] in phantoms. With the application of the outlined model-based analysis methods, it is hoped that our sequence will be able to detect clinically useful changes in [Cr] concentration in the human heart.Acknowledgements
Funded by a Sir Henry Dale Fellowship from the Wellcome Trust and the Royal Society [098436/Z/12/Z].
Mabel Li and Jane Ellis made an equal contribution to this work.
References
1. Nascimben, L. et al. Creatine Kinase System in Failing and Nonfailing Human Myocardium. Circulation 94, 1894–1901 (1996).
2. Haris, M. et al. A technique for in vivo mapping of myocardial creatine kinase metabolism. Nat. Med. 20, 209–14 (2014).
3. Zhou, Z. et al. Optimized cardiac CEST MRI for assessment of metabolic activity in the heart. 19th Annual SCMR Scientific sessions (2016)
4. El-Sharkawy, A.-M.M. et al. Quantification of human high-energy phosphate metabolite concentrations at 3 T with partial volume and sensitivity corrections. NMR in Biomedicine, 26(11) (2013)
Figures