3773
Chemical exchange-sensitive MRI at 9.4 T versus 15.2 T: Effect on Sensitivity and Background Signals1Center for Neuroscience Imaging Research, Institute for Basic Science (IBS), Suwon, Korea, Republic of, 2Samsung Advanced Insitute for Health Sciences and Technology, SKKU, Seoul, Korea, Republic of, 3Biomedical Engineering, Sungkyunkwan University, Suwon, Korea, Republic of, 4Radiology, University of Pittsburgh, 5Radiology, Sungkyunkwan University, Seoul, Korea, Republic of
Synopsis
With chemical-exchange sensitive imaging, increasing field narrows the linewidth of magnetization transfer effects and shifts relative exchange rates (exchange rate vs. chemical shift) toward a slower exchange regime. This study is intended to explore the interplay of contrast mechanisms and sensitivity benefits by comparing phantom and in-vivo data acquired at the fields of 9.4T and 15.2T. The linewidth narrowing effect between the fields is demonstrated in agar phantoms with nicotinamide as well as spectra from the rat cortex. Spectra taken at higher power shows increase of sensitivity by shifting toward a slower exchange regime.
PURPOSE
With much work being done with regard to chemical-exchange sensitive imaging, one of the most pressing concerns is increasing sensitivity. One solution has been to increase magnetic field. Particularly, with chemical-exchange sensitive imaging, increasing field narrows the linewidth of magnetization transfer effects and shifts relative exchange rates (exchange rate vs. chemical shift) toward a slower exchange regime. This study is intended to explore the interplay of contrast mechanisms and sensitivity benefits by comparing phantom and in-vivo data acquired at the fields of 9.4T and 15.2T.MATERIALS AND METHODS
All MR experiments were performed on either a Bruker Biospec 9.4T/30-cm or a 15.2T/11-cm instrument. B0 maps were obtained using the WASSR method1. The chemical exchange-sensitive pulse sequence comprises a spin-lock preparation module for chemical exchange contrast and a RF-spoiled TurboFLASH readout with a center-out phase encoding scheme: matrix size=64x64,slice thickness=1mm,flip angle=15.0°,GRE readout TR=10.0ms,TE=1.84ms, and image TR=13.0s.
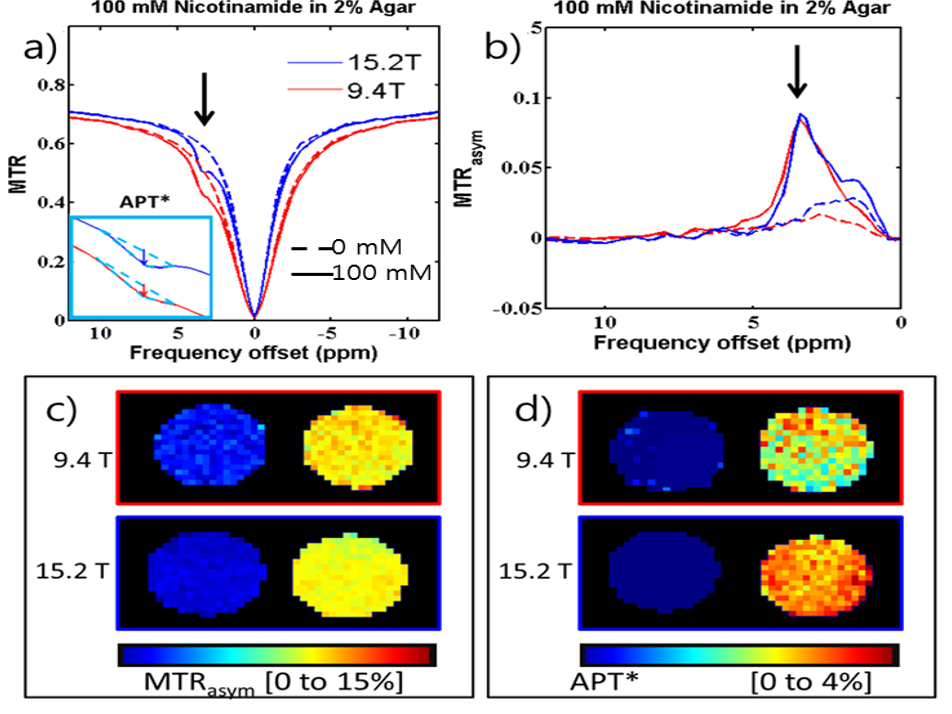
Phantom: Agar was prepared at 2%(w/v) in PBS at pH 7.4 with nicotinamide at two concentrations (0 and 100 mM) in 9-mm I.D. syringes for imaging at room temperature with a volume coil excitation and reception (4.0-cm ID for 9.4T and 3.5-cm ID for 15.2T) and a field of view of 30mmx30 mm. Saturation pulses (ω1=175Hz and TSL=5.0sec) were applied at 91 offsets unevenly between Ω=±15.0ppm.
In-vivo: A total of 12 male Sprague-Dawley rats(50-100g) were anesthetized with isoflurane and controlled at 37.2±0.5°C. A volume excitation and 4 channel receiver array coil assembly was used for imaging with a field of view of 25mmx25mm.
1) CEST Z-spectra (n=6 each for 9.4T and 15.2T) were obtained with either ω1=63Hz and TSL=3.0sec or ω1=500Hz and TSL=150msec at 71 offsets unevenly between Ω=±10.0ppm with reference (S0) images at Ω=300ppm.
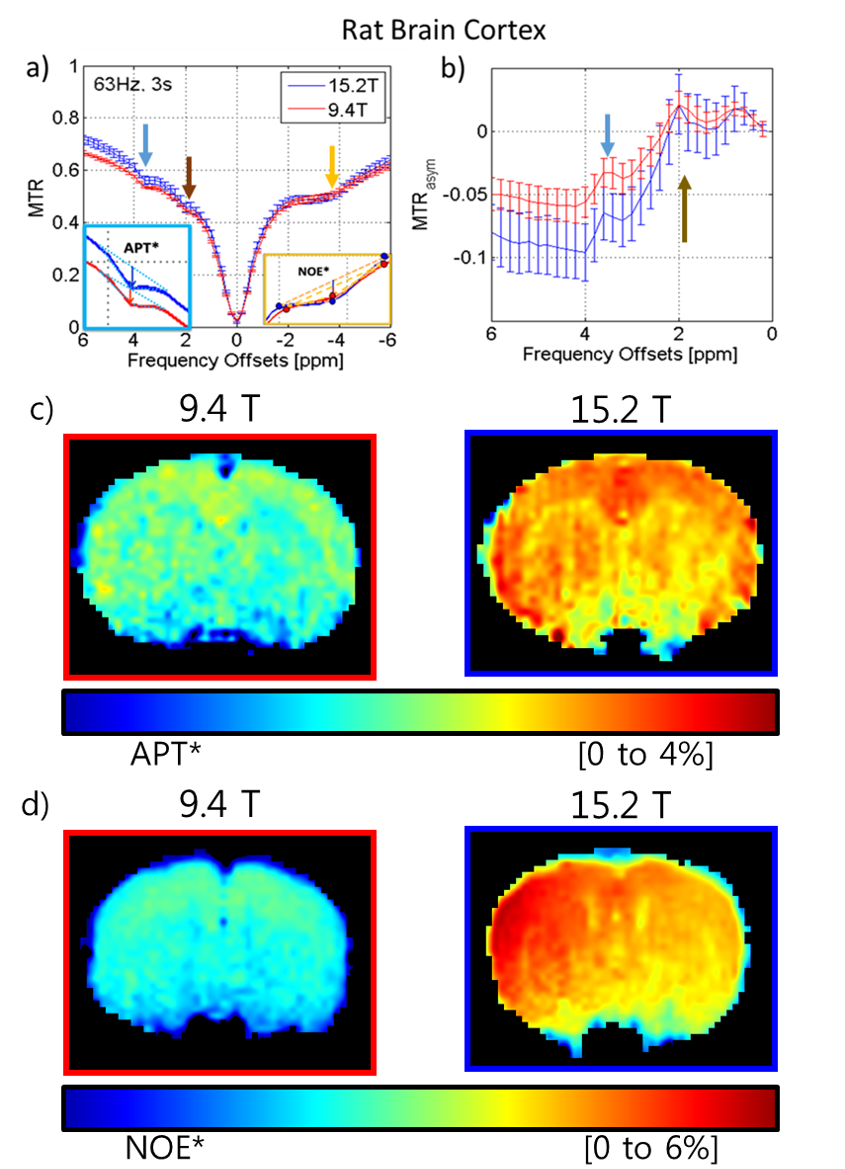
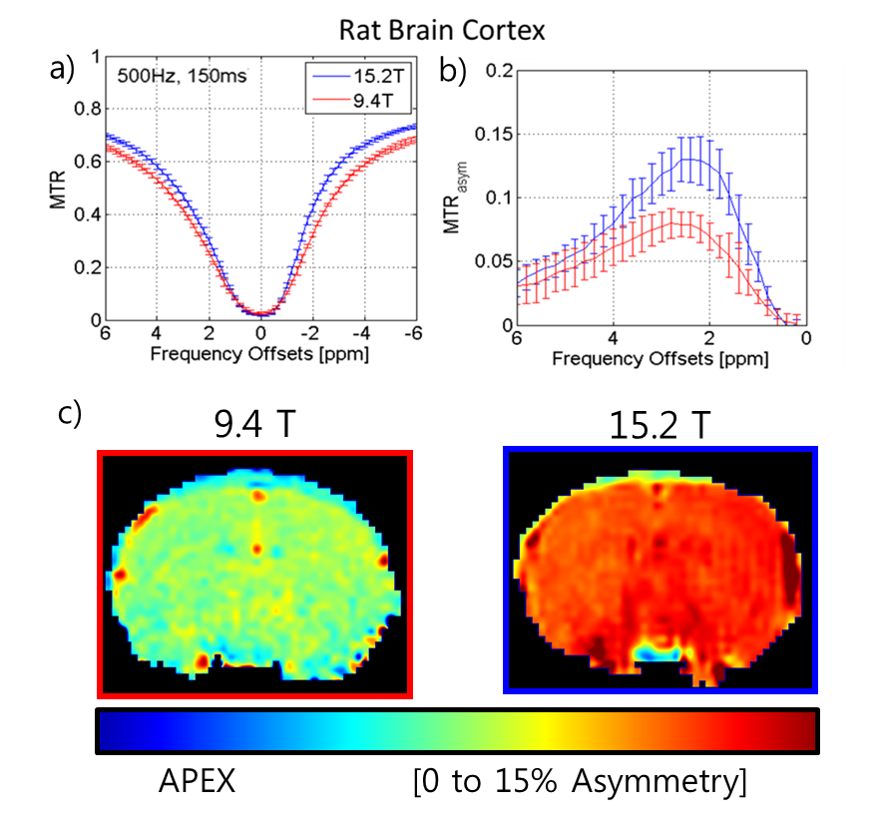
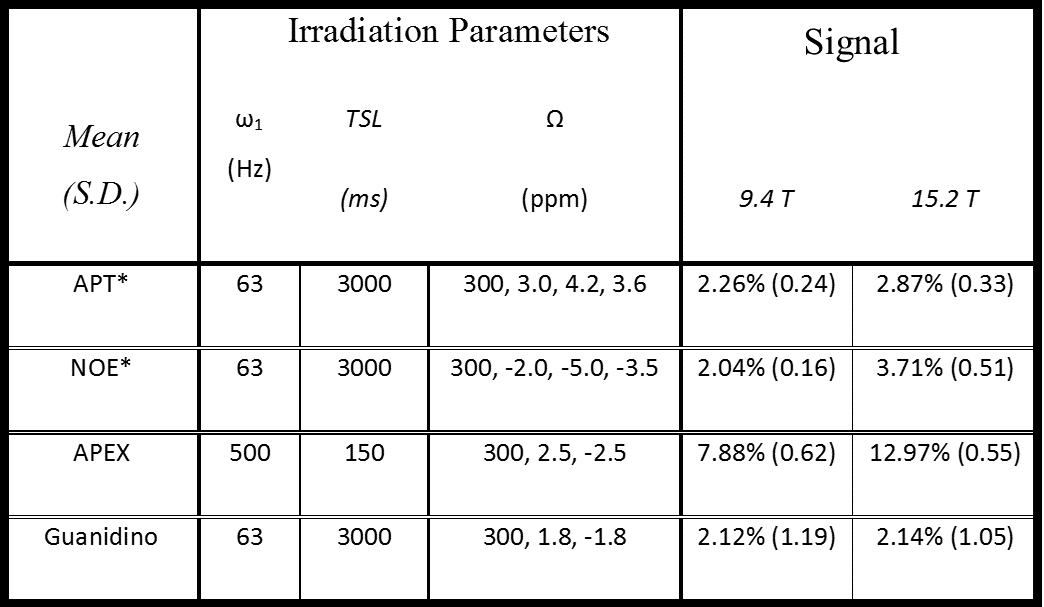
2) To obtain CEST maps, three-point approaches using ω1=63Hz and TSL=3.0sec with APT*=[(S3.0ppm+S4.2ppm)/2 ̶ S3.6ppm]/S0 and NOE*=[(S-2.0ppm+S-5.0ppm)/2 ̶ S-3.5ppm]/S02 as well as APEX at ω1=500Hz and TSL=150ms with APEX=[S-2.5ppm ̶ S2.5ppm]/S03.
RESULTS
Z-spectra data (Fig.1a) was acquired of a phantom intended to interrogate the differences between the two fields of the various contrast mechanisms with nicotinamide for slow chemical exchange similar to the amide groups found in-vivo and agar to increase R1 and R2 as well as a degree of semi-solid MT. The peaks of the asymmetry curves (Fig.1b) acquired at the two fields appear to be similar as well as the APT asymmetry maps of the two fields at 3.5 ppm (Fig.1c). In contrast, using a 3-point measurement, APT* at 15.2T is higher than 9.4T. The in vivo Z-spectra and asymmetry curves at both fields (9.4T[red] and 15.2T[blue] n=6) at low power(ω1=63Hz) show three peaks: amide at 3.6ppm, guanidino at 2ppm, and NOE at -3.5ppm while the presence of the semi-solid magnetization transfer effect can be inferred by the attenuated signal at the wide ends of the spectrum. The amide peak reveals significantly less definition at 9.4T than the amide peak at 15.2T due to the background MT effect (Fig. 2a left inset plot). APT* in the cortex was determined to be 27% higher at 15.2T than at 9.4T (Fig.2c, Table1). Similarly, NOE* in the cortex was found to be 82% higher at 15.2T in comparison to 9.4T (Fig.2d, Table1). At high power (ω1=500Hz), the peak using asymmetry analysis reveals a significantly larger signal at 15.2T when compared to 9.4T (Fig.3a-b). This Amine Proton Exchange (APEX) was found to 65% higher at 15.2T when compared to 9.4T (Fig.3c, Table1).DISCUSSION
For amides at 3.6ppm and NOE at -3.5ppm, their presence precisely opposite to one another across water resonance precludes effective asymmetry analysis (Fig.2a). The background signal is decreased by narrower peak width of the semi-solid magnetization transfer effect as well as the reduction of direct water saturation at higher fields, which positively affect simple methods of measurement such as the 3-point measurement used here as well as providing a larger dynamic range potentially improving curve fitting. At high power (ω1=500Hz), the dominant exchanging species in this spectrum is in the intermediate exchange regime and there is significant spillover of the exchange effect presenting on both sides of water resonance. There is a sensitivity gain at 15.2T due to reduction of the relative exchange rate and direct water saturation.CONCLUSION
In chemical-exchange sensitive imaging, 15.2T provides numerous advantages over 9.4T including: narrowing direct water saturation width and semi-solid magnetization transfer lowering background for slower exchanges as well as shifting toward a slower exchange regime for intermediate exchanges. This improvement is most significant for intermediate-exchanging amine and hydroxyl protons that have small differences in chemical shifts between labile protons and water, which enhances their sensitivity greatly.Acknowledgements
This work was supported by the Institute for Basic Science (IBS-R015-D1) and a National Research Foundation of Korea (NRF) grant funded by the Korean government (MSIP) (2016R1A2A1A05004952).References
1. Kim M, Gillen J, Landman BA, Zhou J, van Zijl PC. Water saturation shift referencing (WASSR) for chemical exchange saturation transfer (CEST) experiments. Magnetic resonance in medicine. Jun 2009;61(6):1441-1450.
2. Jin T, Wang P, Zong X, Kim SG. MR imaging of the amide-proton transfer effect and the pH-insensitive nuclear overhauser effect at 9.4 T. Magnetic resonance in medicine. Mar 1 2013;69(3):760-770.
3. Jin T, Wang P, Zong X, Kim SG. Magnetic resonance imaging of the Amine-Proton EXchange (APEX) dependent contrast. NeuroImage. Jan 16 2012;59(2):1218-1227.
Figures