3771
Chemical Exchange Rotation Transfer Imaging of CEST signal at 2ppm1Vanderbilt University, Nashville, TN, United States
Synopsis
The CEST signal around 2 ppm may have applications in cancer and muscle imaging and is likely related to an important energy molecule, creatine. In this work, we provide a specific metric to better quantify this signal based on modification of our previously developed CERT approach and an inverse analysis. Results show that the CEST signal at 2 ppm is hypointense in tumors which may be due to decreased creatine content.
PURPOSE
Recent studies show that a CEST signal centered around 2 ppm distinguishes tumor from normal brain and is detectable in muscle, and is likely related to creatine, an important metabolite1. A multiple-pool Lorentzian fit has been applied to quantify the CEST signal at 2 ppm. However, this approach may overestimate the CEST signal at 2 ppm due to the influence of fast exchanging amine protons at 3 ppm (e.g. glutamate), which have broad peaks; Furthermore, CEST techniques depend on multiple other parameters, and are often not specific to exchange effects. In this work, we first modified our previously developed chemical exchange rotation transfer (CERT) approach by varying duty cycle and keeping constant pulse width to extend the pass-band of the CERT exchange-rate filter effect to cover the exchange regime of creatine (several hundred Hertz). We then combine a constant pulse width (cpw) acquisition with an inverse analysis, and name the corresponding metric AREXdouble, cpw, to separate and quantify the exchange-specific CEST signal at 2 ppm.METHODS
To quantify CEST signals, conventional MTRasym, CERT MTRdouble, CERT MTRdouble, cpw, and CERT AREXdouble, cpw are defined as,
$$MTR_{asym}=\frac{S_+-S_-}{S_0} (1) $$
$$MTR_{double}=\frac{S_-(\theta=2\pi, dc=0.5)-S_-(\theta=\pi, dc=0.5)}{S_0} (2)$$
$$MTR_{double, cpw}=\frac{S_-(\theta=2\pi, dc=0.18)-S_-(\theta=\pi, dc=0.72)}{S_0} (3)$$
$$AREX_{double, cpw}=R_{1obs}(\frac{S_0}{S_-(\theta=\pi, dc=0.72)}-\frac{S_0}{S_-(\theta=2\pi, dc=0.18)}) (4)$$
where (-) represents the offset of the exchanging species and (+) is the offset on the opposite side of the water. (π) and (2π) represent the nutation angles (θ) of the individual pulses making up a long irradiation pulse train. S0 is the signal acquired in the non-irradiated control case. The duty cycle (dc) in MTRdouble, cpw and AREXdouble, cpw is set to be 0.18 for 2π irradiation and 0.72 for π irradiation so that the pulse durations are constant for all θ (13 ms under irradiation power of 1 mT in this study). The pulse duration is set constant to avoid changes in the bandwidth that may affect direct effects close to the water line. Average irradiation powers, defined to be the root mean square average of the amplitude over a pulse repetition period, are set constant for both π and 2π irradiations. R1obs is the apparent water longitudinal relaxation rate.
To study exchange-rate filter effects, the four metrics were calculated as a function of exchange rate (ksw). A 2-pool model (solute and water) was simulated ignoring direct effects on water, with the solute offset set to 1.9 ppm. To study the ability of the CERTcpw methods to isolate creatine from multiple metabolites, 11 solutions containing brain metabolites at their physiological concentrations and 1 solution containing egg white albumin (EWA) were prepared in 1 $$$\times$$$ PBS and titrated to pH of 7.0. A rat bearing a 9L tumor was also measured. Measurements were performed on a Varian 9.4T small animal MRI scanner.
RESULTS
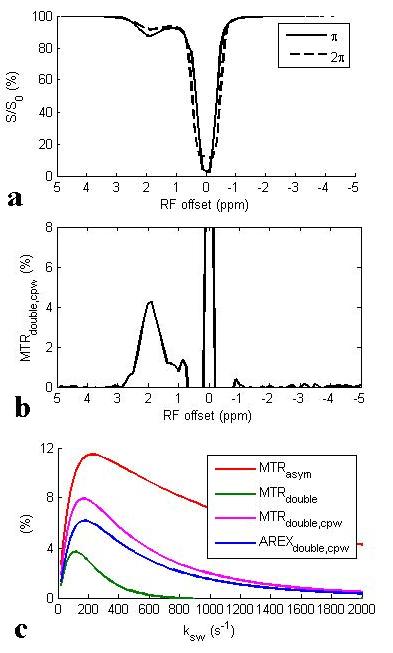
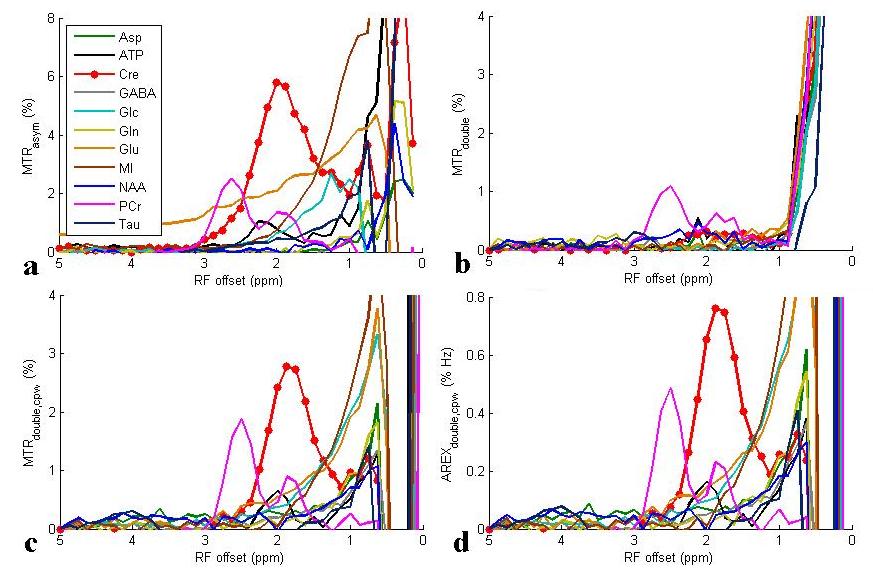
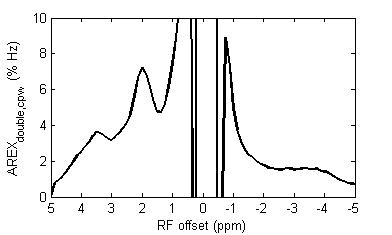
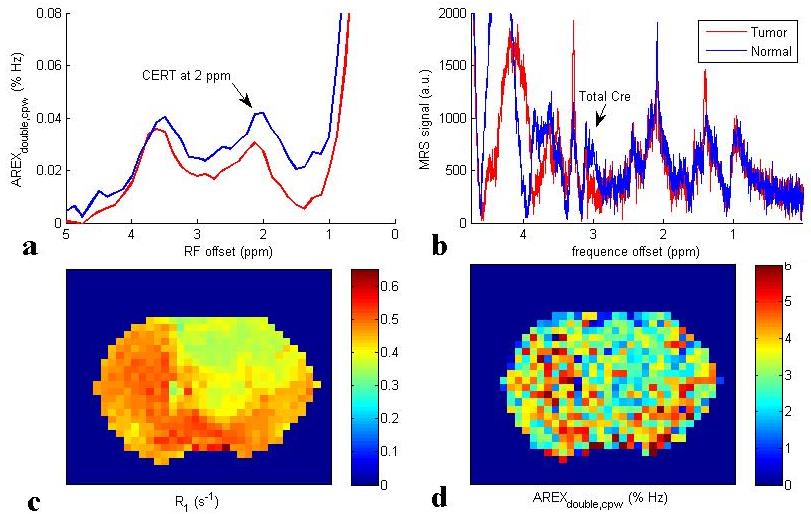
Fig. 1a and 1b show the Z-spectra using π and 2π pulses and the resulting AREXdouble,cpw metric of a creatine sample. Fig. 1c shows the simulated MTRasym, MTRdouble, MTRdouble,cpw, and AREXdouble,cpw metrics as a function of ksw. Note that MTRasym has contributions from all exchanging regimes, but MTRdouble has contributions only from the slow exchanging regime. In contrast, MTRdouble,cpw and AREXdouble,cpw have contributions from the slow and intermediate exchange regimes, and thus can isolate creatine from fast exchanging metabolites. Fig. 2 shows the experimental MTRasym, MTRdouble, MTRdouble,cpw, and AREXdouble,cpw spectra from solutions containing the main metabolites in brain. Fig. 2a shows that although creatine makes the largest contribution to MTRasym, glutamate still contributes roughly 40% of creatine’s signal at 1.9 ppm. Fig. 2b shows that creatine signal can be removed in MTRdouble spectra. Fig. 2c and 2d show that glutamate contributes roughly only 20% of creatine’s signal at 1.9 pm, indicating that the exchange filter effect of MTRdouble,cpw and AREXdouble,cpw can effectively remove contaminations from glutamate. Fig. 3 shows the experimental AREXdouble,cpw spectrum of EWA, indicating that the CEST signal at 2 ppm may have additional contribution from proteins2. Fig. 4 shows CEST and MRS measurements on a rat brain bearing 9L tumor. Both decreased AREXdouble,cpw and MRS signals are found in tumor.DISCUSSION
Phantom experiments in Fig. 2 show that AREXdouble, cpw can more effectively isolate creatine from other metabolites than other metrics. In vivo AREXdouble, cpw imaging in Fig. 4d shows hypointense signal in tumor which may be due to the decreased creatine content. However, Fig. 3 shows that the signal at 2 ppm could be also from proteins. Further validation of the molecular origin of the CEST signal at 2 ppm is required.CONCLUSION
We provide a specific metric to quantify CEST signal at 2 ppm.Acknowledgements
No acknowledgement found.References
1. Cai KJ, Singh A, Poptani H., et al. CEST signal at 2ppm (CEST@2ppm) from Z-spectral fitting correlates with creatine distribution in brain tumor. NMR in biomedicine. 2015;28: 1-8.
2. Jin T, Kim SG., High field MR imaging of proteins and peptides based on the amine-water proton exchange effect. ISMRM 2012.
Figures