Lin Chen1,2,3, Xiang Xu2,3, Haifeng Zeng2,3, Kannie W.Y. Chan2,3,4, Nirbhay Yadav2,3, Shuhui Cai1, Kathryn J. Schunke5, Nauder Faraday5, Peter C. M. van Zijl2,3, and Jiadi Xu2,3
1Department of Electronic Science, Xiamen University, Xiamen, People's Republic of China, 2Russell H. Morgan Department of Radiology and Radiological Science, Johns Hopkins University School of Medicine, Baltimore, MD, United States, 3F.M. Kirby Research Center for Functional Brain Imaging, Kennedy Krieger Research Institute, Baltimore, MD, United States, 4Department of Mechanical and Biomedical Engineering, City University of Hong Kong, Hong Kong, People's Republic of China, 5Department of Anesthesiology/Critical Care Medicine, Johns Hopkins University School of Medicine, Baltimore, MD, United States
Synopsis
We
demonstrate that off-resonance VDMP can be used as an exchange rate filter to
distinguish and quantify the slow- and fast-exchanging components in Z-spectra
by applying an appropriate number of pulses and varying the mixing times. The
method can be used to extract predominantly fast-exchanging protons by
separating out the slow-MTC pool, and provides information about the chemical
exchanging species in tissue that conventional MT/CEST technique cannot access.
Purpose
CEST
is a new MRI technique that is capable of enhancing the MR sensitivity of
dilute metabolites by making use of their exchangeable protons (1).
However, a main challenge in CEST is to separate different types of exchanging
protons in tissues. For most in vivo
studies, conventional line-shape based analysis methods of Z-spectra are not
able to separate out the overlapping signals of exchanging protons such as
amine, amide, and hydroxyl groups, as well as non-exchangeable aliphatic and
aromatic protons (2-4).
We used an off-resonance variable
delay multiple pulse (VDMP) sequence (5-7)
to separate out predominantly fast- (>1 kHz) and slow-exchanging components
in Z-spectra.Methods
The method was verified on solutions of Glutamate (Glu,
50 mM) and Bovine serum albumin (BSA, 10% w) as well as on hair conditioner
(MTC phantom), and then applied on mouse brain. The VDMP sequence consisted of a
train of Gaussian saturation pulses separated by a mixing time and followed by
a RARE acquisition module. Experiments were performed by fixing the pulse
number (n=16) and length (10 ms) and increasing the inter-pulse delay for
different offsets, thus sensitizing the experiment to the rate of magnetization
transfer. For each saturation offset, eight mixing
times were collected and the VDMP
build-up curves fitted with the coupled Bloch equations for a three-pool model (6), consisting of a water pool, a slow-exchanging pool and a
fast-exchanging pool. By fitting the VDMP buildup curves with this model, the concentrations
of fast and slow-exchanging components can be obtained. Three parameters were fitted
for each offset: the exchange rate kslow and the concentration xslow for
slow-exchanging protons, plus the concentration xfast for fast-exchanging
protons. An average exchange rate of 2 kHz was assumed for the fast-exchanging
protons, considering that the VDMP build-up curve is nearly independent of
exchange rate when higher than 1 kHz. Notice that the fast exchange component,
xfast, is also concurrent with the direct water saturation. Offsets between ±1
ppm were excluded in the analysis due to strong interference from direct water
saturation. MRI experiments were performed on a horizontal bore 11.7 T Bruker
Biospec system.Results and Discussion
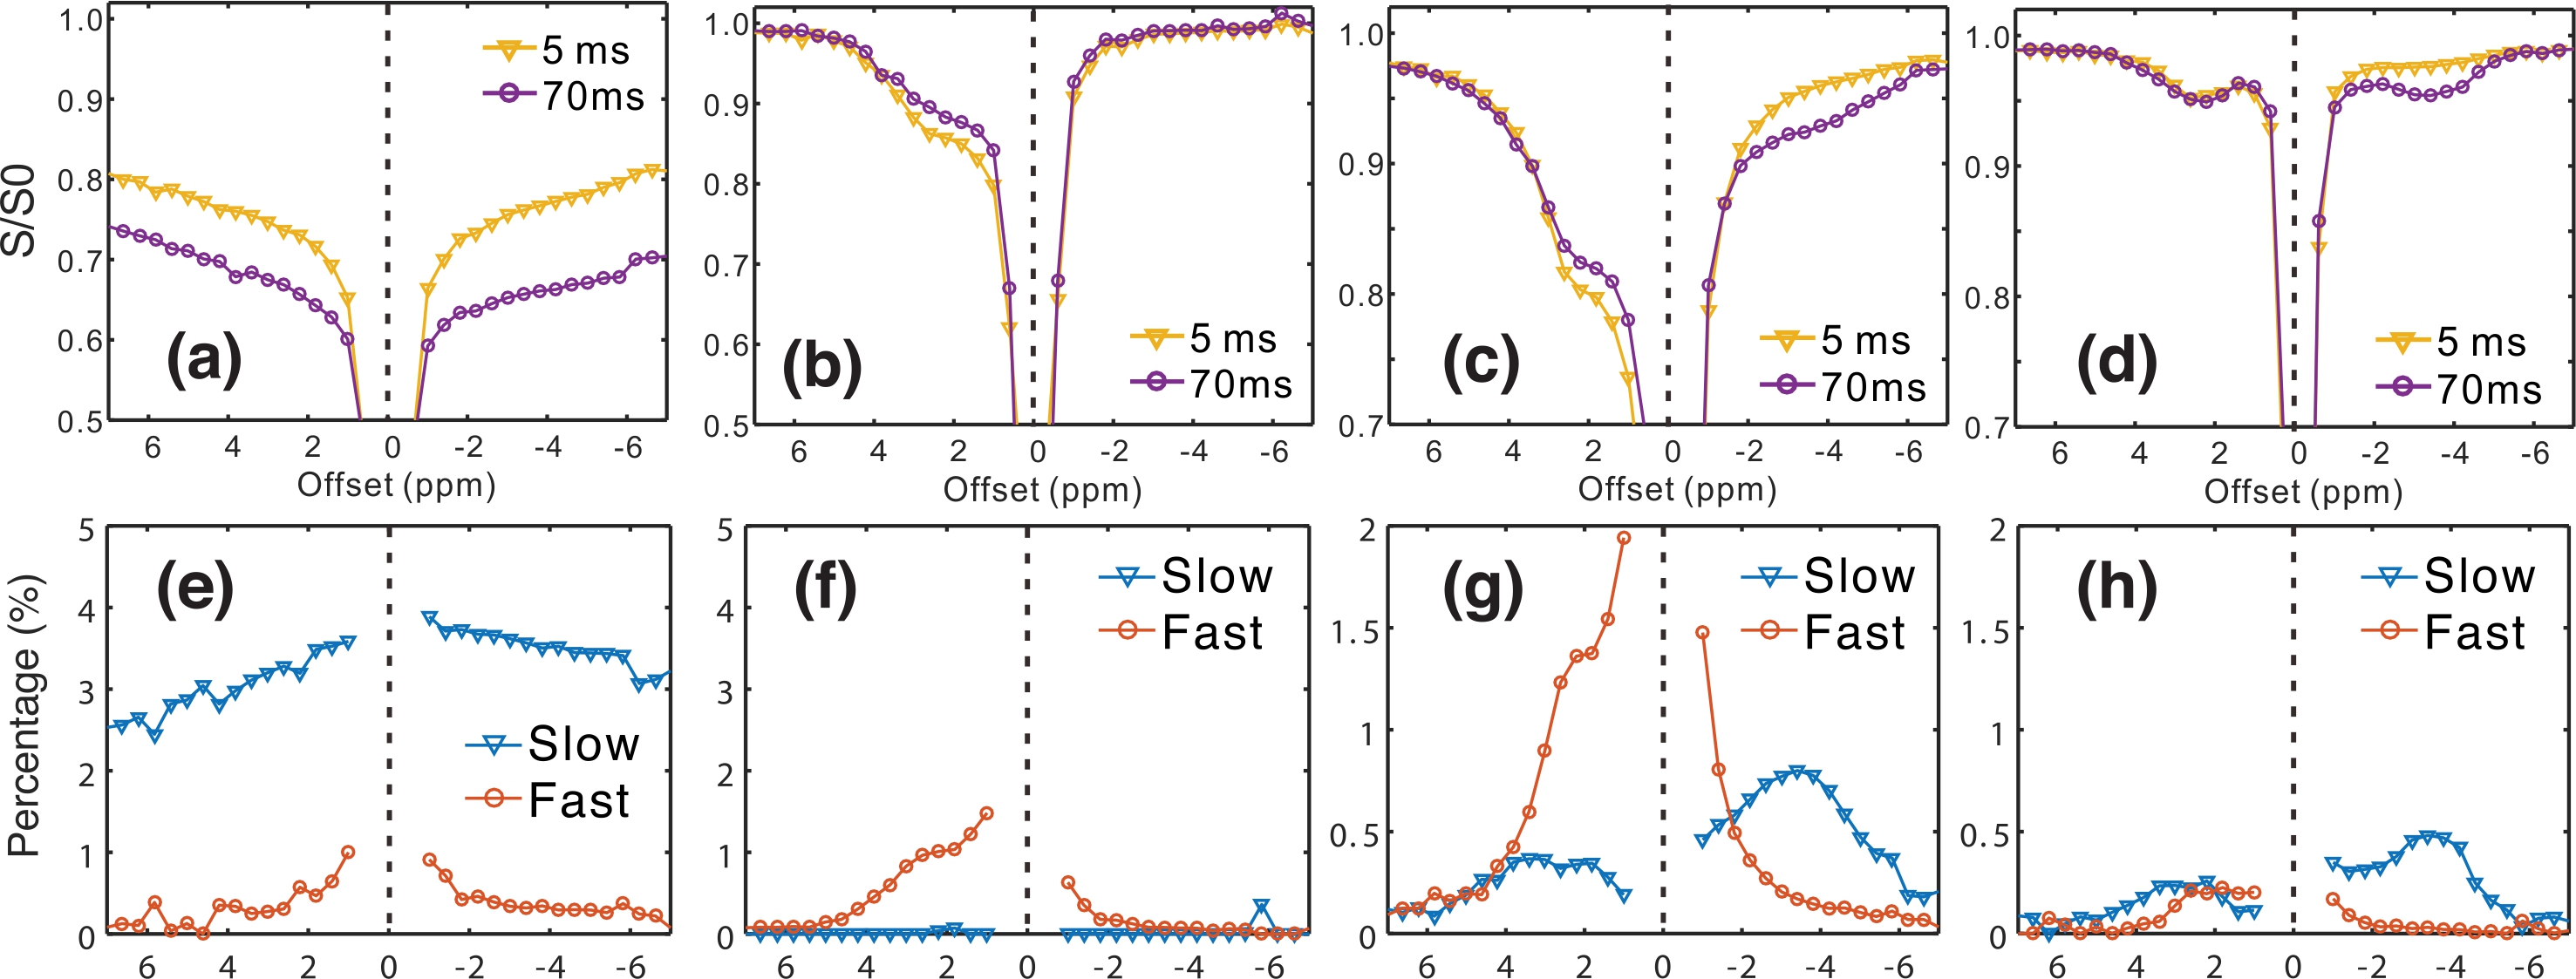
Typical VDMP Z-spectra for the phantoms are plotted in Figs.
1a-d, together with the fast- and slow-exchanging Z-spectra obtained by fitting
the VDMP build-up curves (Figs. 1e-h). The different exchange pools can be well
separated by this method in BSA solution, such as the amine groups, which show a
pattern similar to that of Glu solution in fast-exchanging Z-spectra. The aromatic
and amide groups fall in the slow-exchanging pool and can thus be distinguished
from the amine group, while only a single broad resonance is seen in
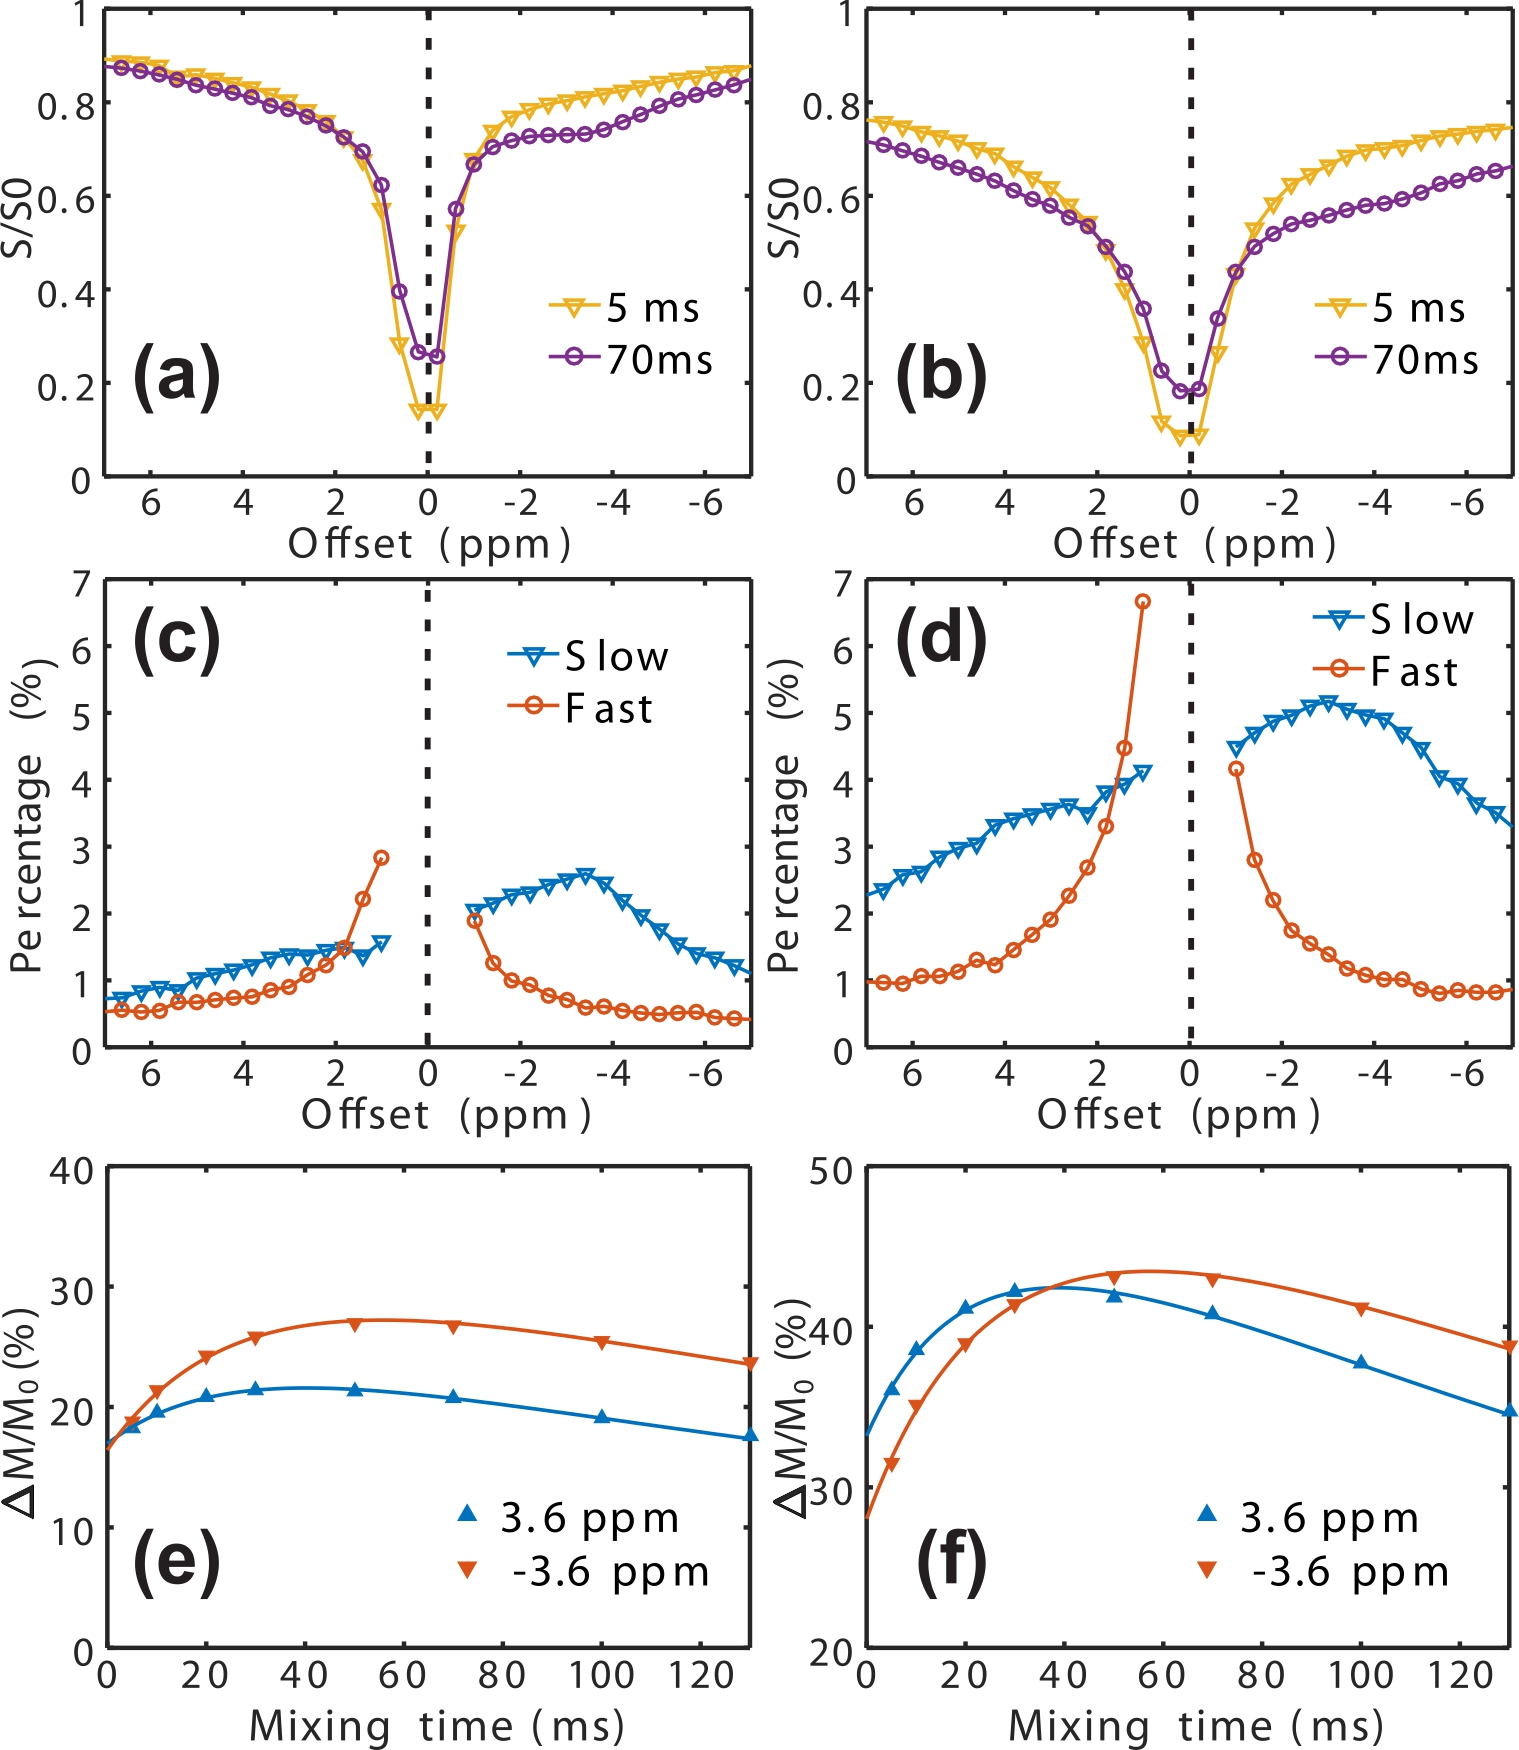
conventional Z-spectra (Figs. 1c&d). Fig. 2 shows the full Z-spectra, as
well as the Z-spectra for fast- and slow-exchanging protons in the mouse brain
recorded using the VDMP sequence with two saturation powers of 5.6 μT and 11.2
μT. The fast-exchanging Z-spectrum shows a constant background (~0.5% and 1%
for low and high B1, resp.) in the region studied, i. e., from -8 ppm to 8 ppm,
except in the range around water signal. The range of 4 to -2 ppm shows clear asymmetry with
respect to the water resonance. Therefore, the region around 0 ppm was assumed
to arise mainly from the fast-exchanging protons (FP) from metabolites and
mobile proteins, and concurrent with water signal. High-resolution slow- and
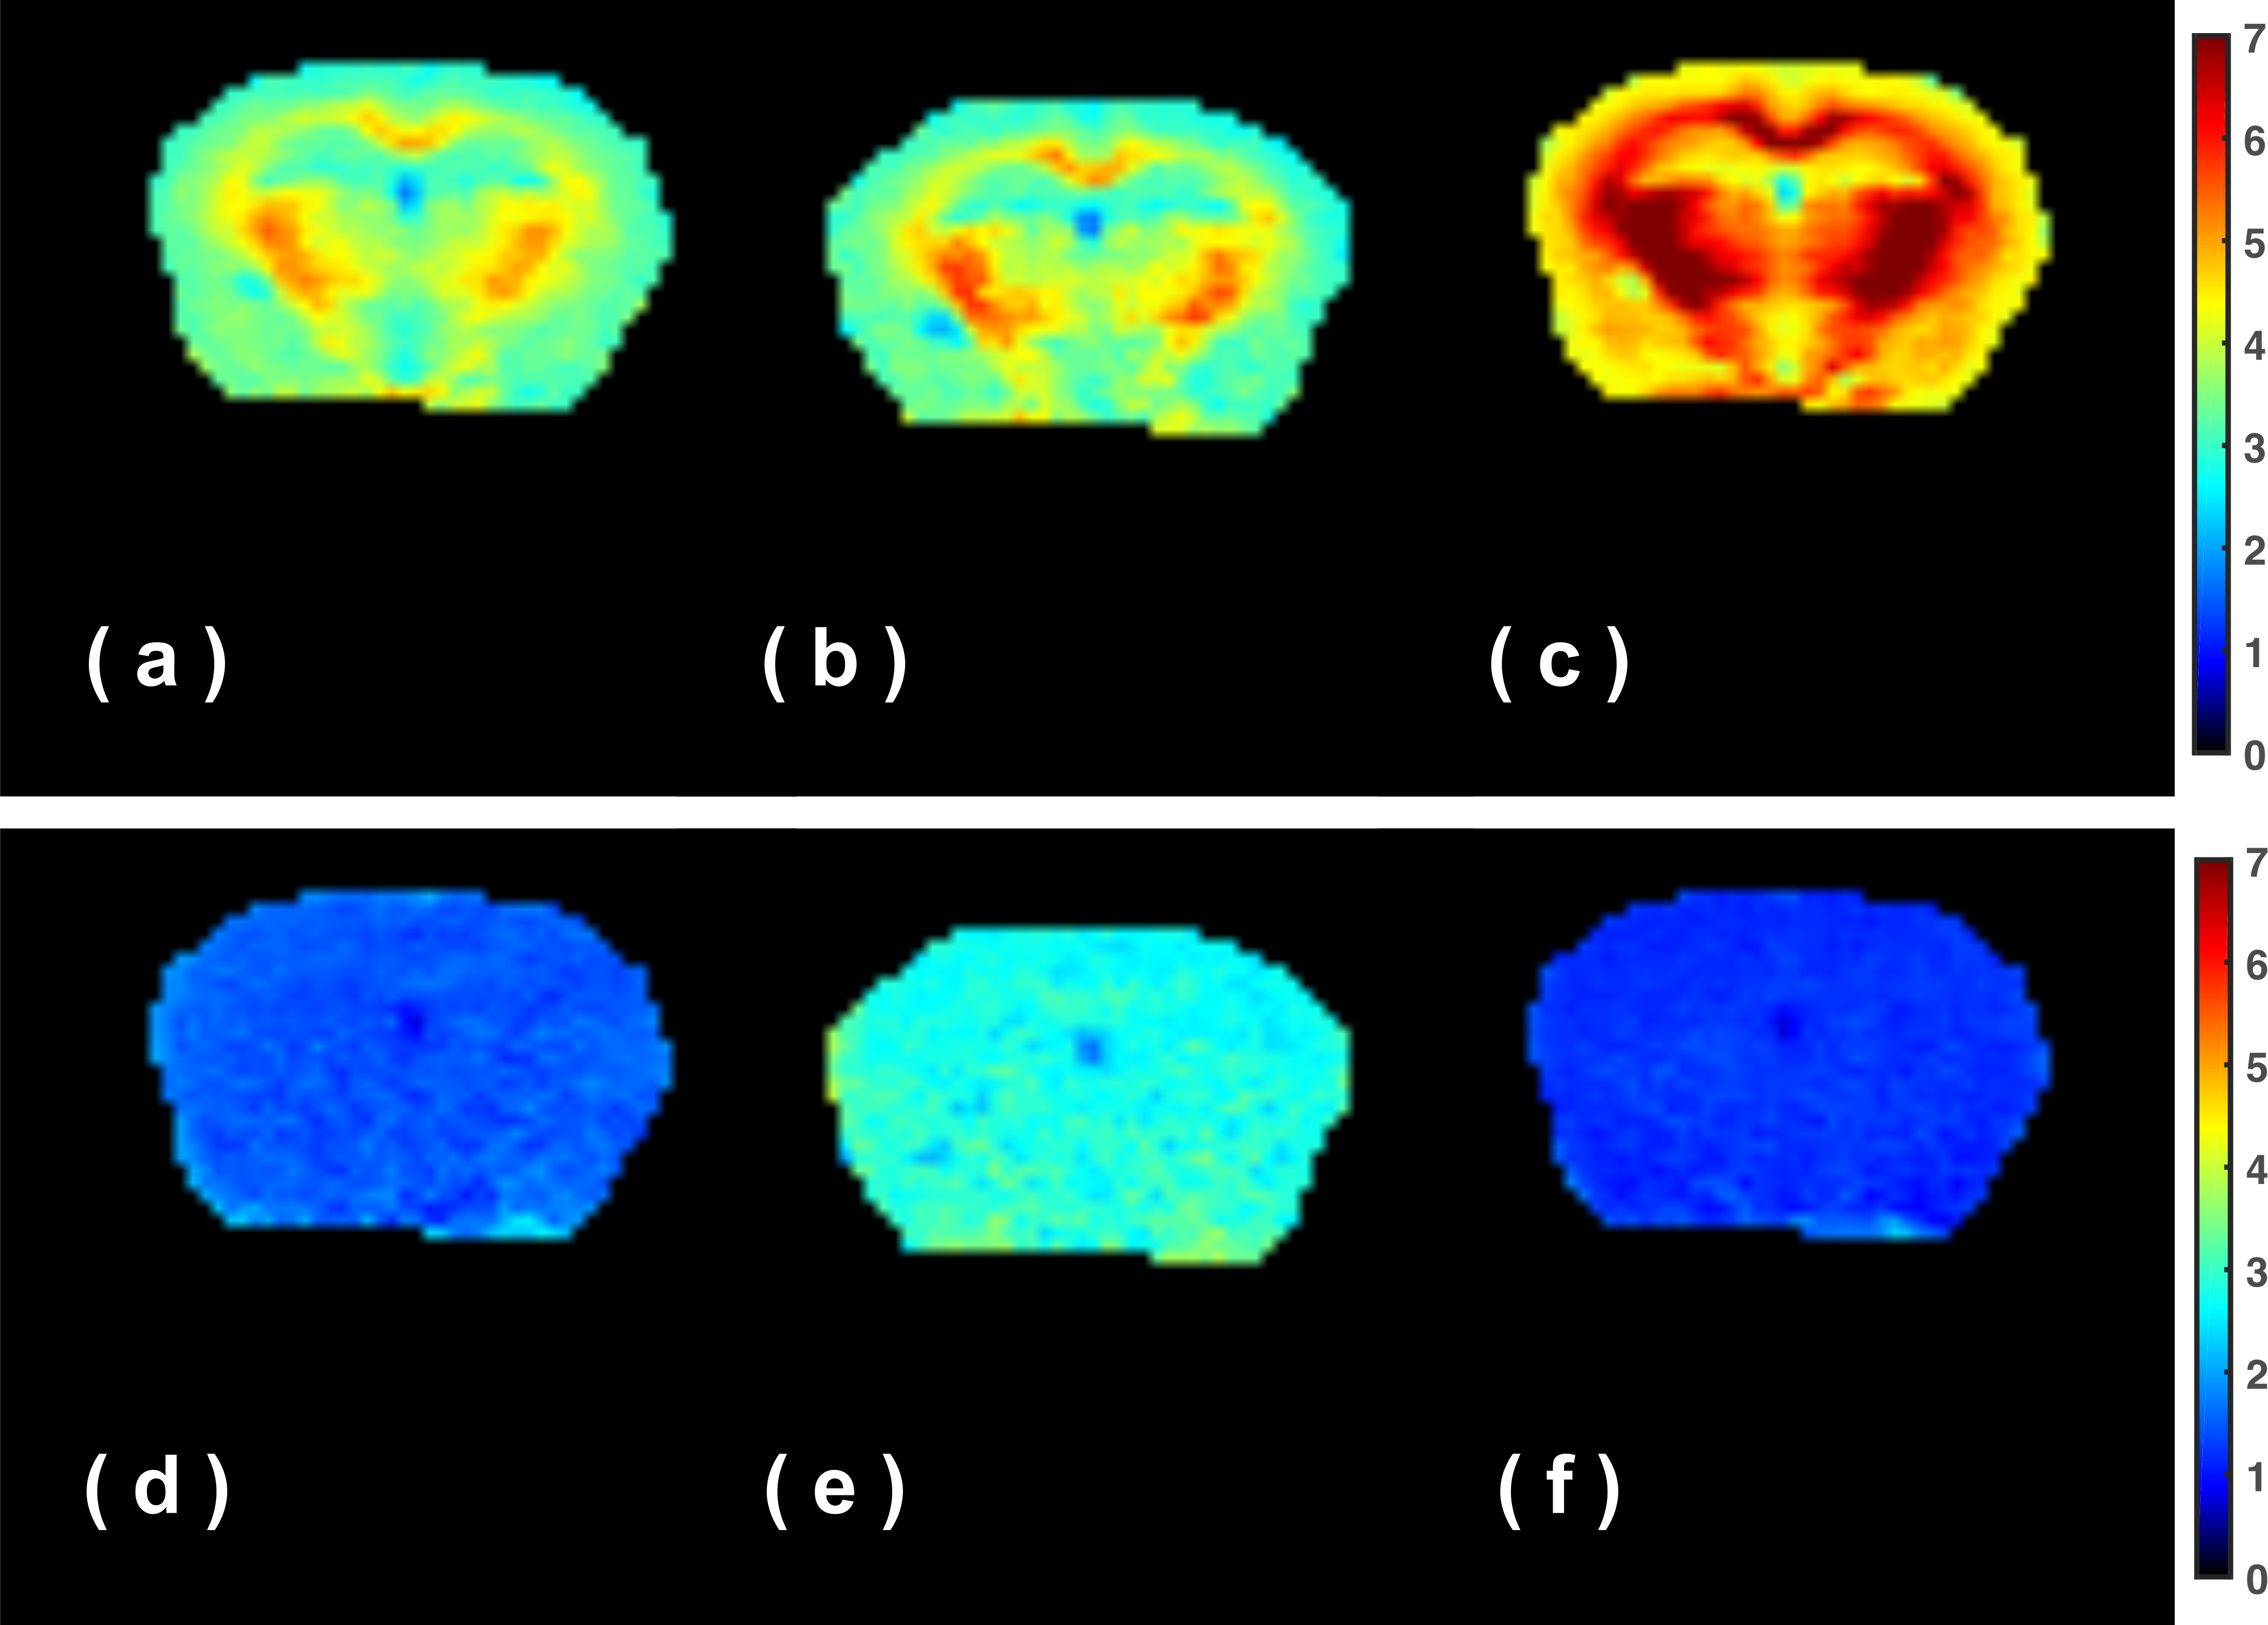
fast- exchanging proton maps at ±3.6 ppm and 2 ppm are plotted in Fig. 3. The total
fast proton (TFP, combined fast-MTC and fast exchanging metabolite protons) map
for these off-resonance data shows homogeneous intensity across the brain at
the three offsets, which is similar to the total
fast-exchanging proton (TFP) map obtained by onVDMP previously (6). The slow-exchanging proton
is asymmetric and broad and shows high contrast between the WM and GM in the
mouse brain at all frequency offsets measured, which indicates that the
slow-exchanging proton pool mainly arises from asymmetric MTC from myelin lipid
and macromolecules (7). The complicated asymmetric line-shape of the
slow-exchanging pool suggests that caution is required when fitting the
Z-spectra using line-shape analysis. In order to apply VDMP method on APT and relayed
NOE CEST for mobile proteins, the saturation power has to be low enough to
minimize the contribution from the MTC pool (Fig. 1d). Then, the
fast-exchanging proton is also not visible, which is the case in the original
VDMP study (7).Conclusion
The current technique can extract the fast- and slow-exchanging
protons from Z-spectra, and presents direct evidence that MTC in vivo contains
both fast-exchanging and slow-exchanging components.Acknowledgements
This work was supported by R01EB015032, P41EB015909
and R01EB019934. Lin Chen thanks the China Scholarship Council (201506310130)
for financial support. References
1. van Zijl PCM, Yadav NN. Chemical exchange
saturation transfer (CEST): What is in a name and what isn't? Magn Reson Med
2011;65(4):927-948.
2. Cai K, Singh A, Poptani
H, Li W, Yang S, Lu Y, Hariharan H, Zhou XJ, Reddy R. CEST signal at 2ppm
(CEST@2ppm) from Z-spectral fitting correlates with creatine distribution in
brain tumor. NMR Biomed 2015;28(1):1-8.
3. Desmond KL, Moosvi F,
Stanisz GJ. Mapping of amide, amine, and aliphatic peaks in the CEST spectra of
murine xenografts at 7 T. Magn Reson Med 2014;71(5):1841-1853.
4. Zaiss M, Windschuh J,
Goerke S, Paech D, Meissner JE, Burth S, Kickingereder P, Wick W, Bendszus M,
Schlemmer HP, Ladd ME, Bachert P, Radbruch A. Downfield-NOE-suppressed amide-CEST-MRI
at 7 Tesla provides a unique contrast in human glioblastoma. Magn Reson Med
2016.
5. Xu X, Yadav NN, Zeng H,
Jones C, Zhou J, Zijl Pv, Xu J. Magnetization transfer contrast–suppressed
imaging of amide proton transfer and relayed nuclear overhauser enhancement
chemical exchange saturation transfer effects in the human brain at 7T. Magn
Reson Med 2016;75(1):88-96.
6. Xu J, Chan KW, Xu X,
Yadav N, Liu G, van Zijl PC. On-resonance variable delay multipulse scheme for
imaging of fast-exchanging protons and semisolid macromolecules. Magn Reson Med
2016:10.1002/mrm.26165.
7. Xu J, Yadav NN,
Bar-Shir A, Jones CK, Chan KW, Zhang J, Walczak P, McMahon MT, van Zijl PC.
Variable delay multi-pulse train for fast chemical exchange saturation transfer
and relayed-nuclear overhauser enhancement MRI. Magn Reson Med
2014;71(5):1798-1812.