3768
snapCEST – A single-shot 3D CEST sequence for motion corrected CEST MRIMoritz Zaiss1, Philipp Ehses1, and Klaus Scheffler1
1Magnetic Resonance Center, Max-Planck-Institute for biological cybernetics, Tuebingen, Germany
Synopsis
In this study, we present a single-shot 3D MRI readout that allows acquisition of a CEST prepared volume within 2 s. This makes it possible to correct for motion, which otherwise can cause severe artifacts in CEST imaging.
Purpose
Chemical exchange saturation transfer (CEST) signals contain relevant information on the molecular and microenvironmental level, but with magnitudes of only some % of the water signal [1,2]. Further, CEST spectrum acquisition is relatively time consuming as several label and reference scans and also an M0 (unsaturated thermal magnetization) scan needs to be acquired to be able to calculate a proper contrast. Thus several minutes can pass between two acquired images which are then used to calculate a CEST contrast. This makes CEST prone to motion artifacts that are easily in the order of 10% of the water signal. To solve this issue, we propose snapCEST, a single-shot GRE readout with centric spiral reordering that allows to acquire a 22x18x4 cm3 volume within 2.5s after CEST preparation. The single-shot acquisition enables retrospective motioncorrection in post-processing without the need of navigators or other motion tracking efforts. This may be an important development for robust CEST MRI in clinical trials.Materials and Methods
snapCEST imaging consists of a spectral but not spatial selective saturation period of 5s (a train of 150 Gaussian-shaped RF pulses, tpulse = 15 ms, tdelay = 15 ms, tsat = 4.5 s, B1,mean = 1 µT) and a subsequent readout phase of 2.5 s realized by a single-shot centric-spiral reordered 3D GRE readout (680 k-space lines, FA=5°, TE=1.85ms , TR=3.64, Grappa=3, elliptical scanning, BW=700Hz/px, resolution 1.5x1.5x2 mm3, FOV=22x18x4 cm3). In vivo snapCEST imaging was performed on a 9.4 T whole body MRI tomograph (Siemens) on a healthy volunteer with informed consent and approval by the local ethics committee. A custom-built head coil [3] was used for signal transmission/reception (16 transmit / 31 receive channels). SNR was calculated using 20 pseudo replicas, Z-spectra and CEST MTRasym maps were obtained after saturation at 95 offsets between -50 and 50 ppm with denser sampling between -5 and 5 ppm. For tSNR calculation 42 repeated measurements after saturation at -3.5 ppm were acquired; during the repeated measurements the volunteer was asked to move the head thrice. Motion correction was performed using the 3Dvolreg function of AFNI [4].Results and Disccussion
Fig 1 shows that snapCEST yields presaturated images of good quality (Fig1a) with decent SNR (Fig1b). For the first 15 measurements, where the volunteer was asked to lie still, the tSNR calculation shows lower values before registration (Fig1c) than after registration (Fig1d). The sagittal view of the head in Figs 2a and d show that the nodding was quite strong but could be corrected by the volume registration. Figure 2c reveals that already for the first 13 measurements small movements are apparent. Before measurement number 14, 19, and 29 the volunteer was asked to nod (which would be the worst case for 2D single slice methods). Fig 2b and e show the tSNR of the full 42 repeated measurements; tSNR without registration in b) shows rather low magnitude, especially outside the homogeneous WM region. Motion correction greatly improves the tSNR (Fig2e). Figure 2c shows that the movements have sever influences in the Z-spectrum value Z(-3.5ppm) of specific ROIs (more than 20% signal change) which could be drastically lowered by snapCEST with motion correction (Fig2f). Figure 3 shows that in a volunteer that was asked to lie still, again small motion appeared that lead to direct changes in the Z-spectrum (Fig3a) and the asymmetry spectrum (Fig3b). Important to note: these motion artifacts are not at all easy to identify in the Z-spectrum or the asymmetry spectrum and can be misinterpreted as altered CEST effects. Whereas the contrast shows to be relatively similar without (Fig 3c) and with motion correction (Fig 3d), the difference map (Fig3e) reveals that there are signal changes of several percent. As indicated by the white arrow that could lead to misinterpretation of e.g. tumor areas in patient studies where even more motion is expected. We want to note that the same approach was realized and tested at clinical field strengths (3T) with similar results (data not shown). Using phase information of the GRE possibly allows retrospective B0 correction as well.Conclusion
Motion is a big problem for difference methods with long scanning time and small signals such as CEST. Especially, such artifacts are hard to identify and can lead to misinterpretation. We showed that the fast 3D snapCEST approach with retrospective registration can solve this issue: it is easily applicable and is able to correct motion artifacts in CEST images. In addition, 3D acquisition with snapCEST yields an improved SNR and extended coverage of the brain, thus makes it a useful tool for clinical studies.Acknowledgements
No acknowledgement found.References
1. Zhou et al. Using the amide proton signals of intracellular proteins and peptides to detect pH effects in MRI, Nature Medicine 9, 1085 - 1090 (2003) 2. Zaiss M, Windschuh J, Paech D, et al. Relaxation-compensated CEST-MRI of the human brain at 7 T: Unbiased insight into NOE and amide signal changes in human glioblastoma. NeuroImage. 2015;112:180-188. 3. Shajan G, Kozlov M, Hoffmann J, Turner R, Scheffler K, Pohmann R. A 16-channel dual-row transmit array in combination with a 31-element receive array for human brain imaging at 9.4 T. Magn Reson Med. 1. Februar 2014;71(2):870–9. 4. Cox RW, Hyde JS. Software tools for analysis and visualization of fMRI data. NMR Biomed. 1997;10(4–5):171–8. (https://afni.nimh.nih.gov)Figures
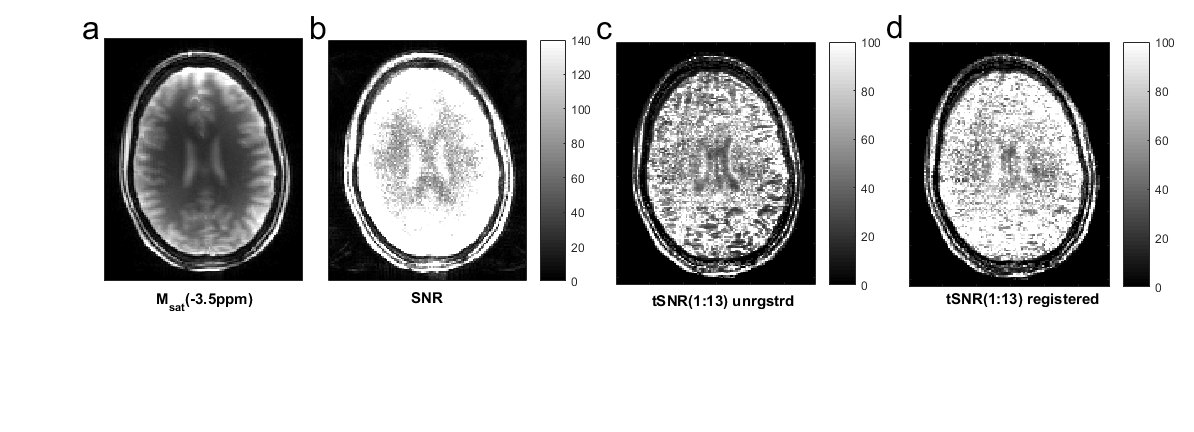
Fig. 1: (a) The 2.5-s snapCEST acquisition
after saturation at Δω ≈ –3.5 ppm. (b) SNR of the image in (a). (c) tSNR of the
first 13 measurements where the volunteer was asked to remain still. (d) tSNR
of the first 13 measurements after retrospective 3D volume registration.
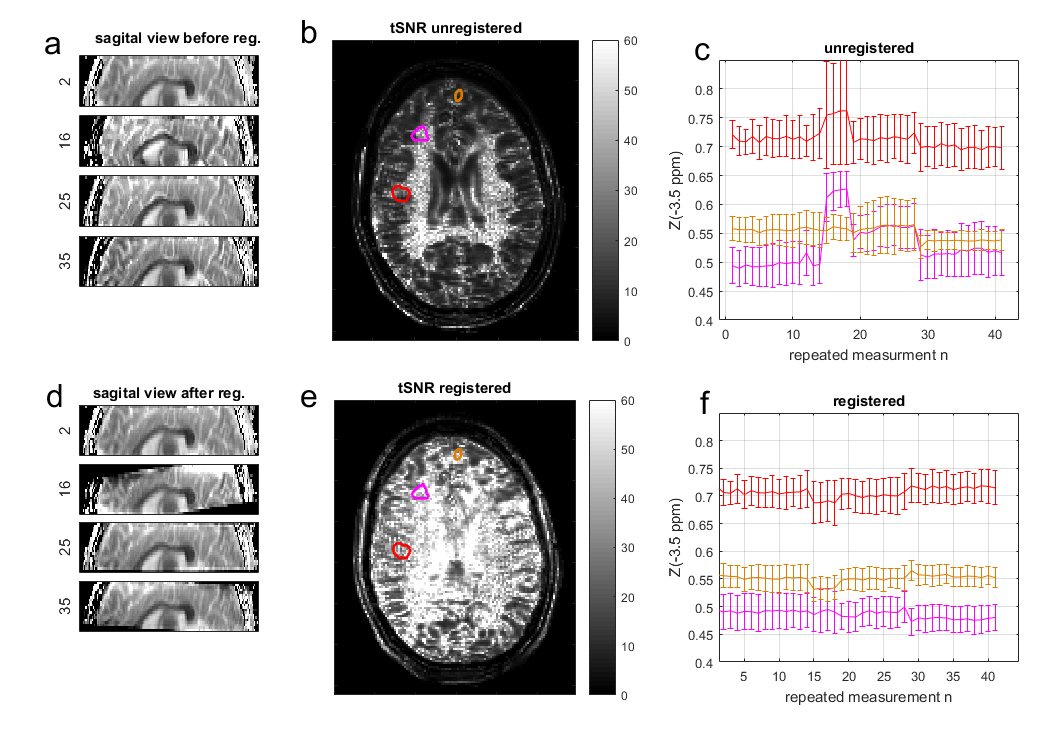
Fig. 2: (a,d) Sagittal view of snapCEST
scan number 2, 26, 25 and 35 before (a) and after (d) motion correction. (b,e)
depict the motion induced by intentional nodding. Center slice tSNR in axial
view before (b) and after (e) motion correction. Region of interest (as defined
in (b,e) ) analysis reveals that motion induced effect changes of up to 20% can
be lowered below 2% by snapCEST with retrospective motion correction
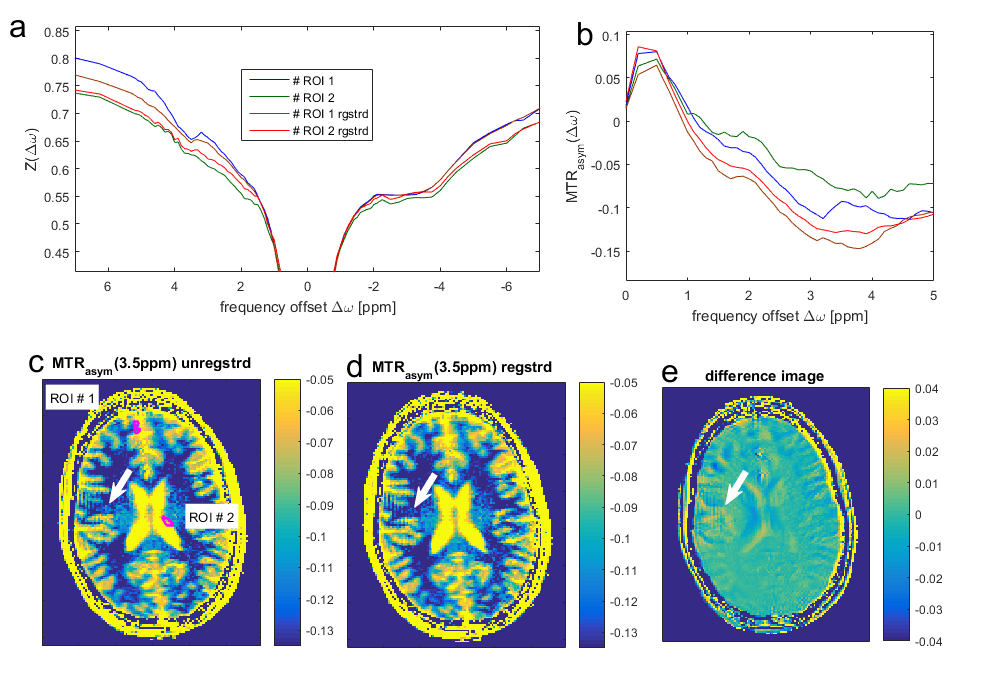
Fig. 3: (a) Z-spectra and
asymmetry-spectra of ROIs defined in (c) reveal that especially at tissue edges
motion induces severe changes in the CEST effects, that can be corrected by
snapCEST with registration. (c) CEST maps: Even when the volunteer was asked to
lie still, the unregistered MTRasym(3.5ppm) shows an additional hotspot (white
arrow) not visible after motion correction (d). The difference image reveals
that motion can induce artificial pseudo CEST effects in the order of magnitude
of real CEST effects.