3764
From in situ to ex vivo: the effect of autolysis and fixation on quantitative MRI markers for myelin1Department of Systems Neuroscience, Medical Center Hamburg-Eppendorf, Hamburg, Germany, 2UCL Institute of Neurology, University College London, London, GA, United Kingdom, 3Department of Neurophysics, Max Planck Institute for Human Cognitive and Brain Sciences, Leipzig, Germany, 4Department of Neuroradiology, Medical Center Hamburg-Eppendorf, Hamburg, Germany, 5Medical Radiation Physics, Lund University, Sweden, 6Department of Engineering, University of Cambridge, United Kingdom
Synopsis
Ex vivo histology remains the gold standard
Purpose
Validation of in vivo MRI-based biophysical models characterizing microstructure in the human brain tissue such as the myelin g-ratio (1) requires comparison to gold standard histology methods, which are mostly based on formalin fixed ex vivo tissue samples (2). However, the MRI signal and its parameters can significantly change from in vivo to ex vivo due to, e.g. (i) autolysis (varying post-mortem interval, PMI (3)), (ii) fixation (e.g. crosslinking of proteins (3,4)), and (iii) temperature changes (5). Consequently, it is necessary to characterize these changes for those specific MRI parameters used in biophysical models such as (1). The purpose of this pilot study is to investigate these changes for the magnetization transfer (MT) saturation (6), a semi-quantitative MRI (qMRI) myelin-marker that has been used for MR g-ratio mapping (7,8). Using a comprehensive qMRI protocol (9,10) in a longitudinal design (from in vivo via unfixed in situ, to fixed ex vivo), we compare the MT marker to previously tested qMRI parameters: (i) the clinically more established but less quantitative myelin marker, the MT ratio (11), as well as to the longitudinal (T1) and apparent transverse (T2*) relaxation times.Methods
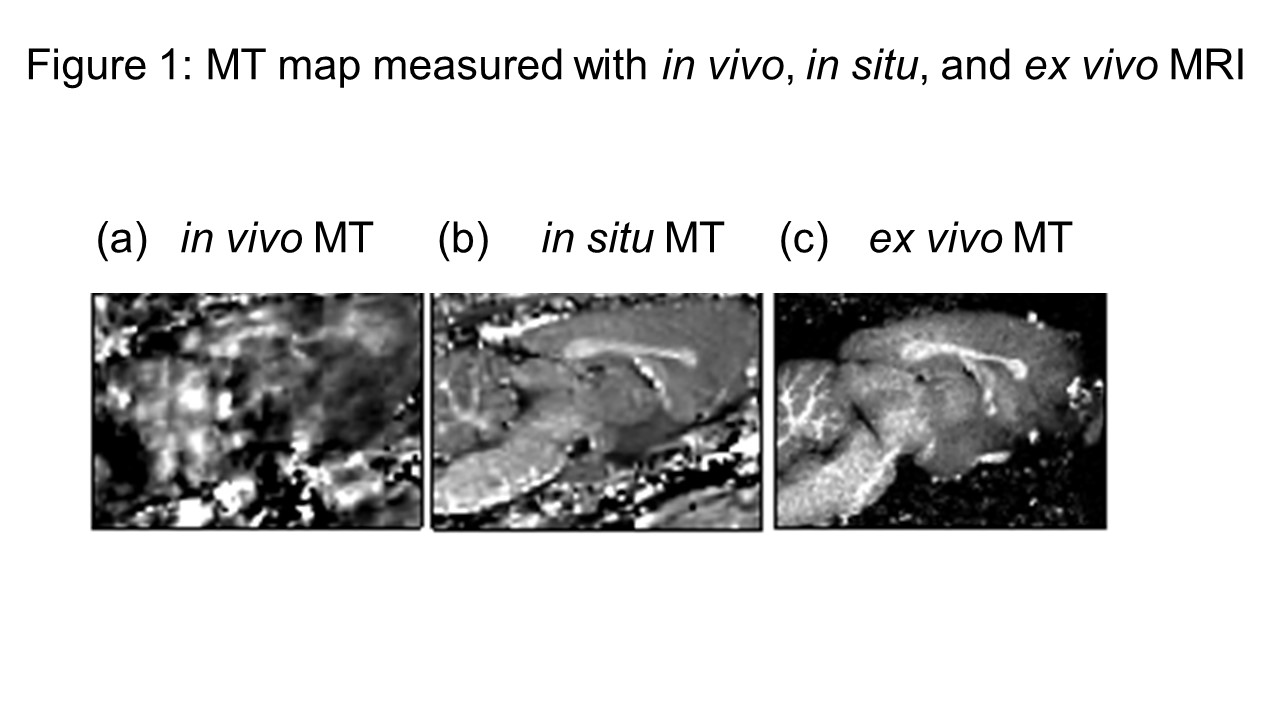
Animal preparation: A female Sprague-Dawley rat (380g) was sacrificed after in vivo measurement under deep general anesthesia (5% isoflurane) by employing carbon dioxide inhalation. Animal experiments were approved by the local authorities of the State of Hamburg and conform to the guidelines set by the European Union. A rectal temperature probe was used during in situ imaging. MRI: The qMRI data of the rat brain was measured longitudinally: we started with in vivo MRI, then after sacrifice, we carried out in situ MRI of the unfixed brain (in intervals of 1hour for 10 hours), and finally after 20 days of immersion fixation we performed ex vivo MRI. Data were acquired on a 7T Bruker Clinscan small animal MRI system using a multi-echo spoiled gradient echo (SPGR) sequence with predominantly proton density (PDw; flip angle = 60), T1w- (210), and magnetization transfer (MTw; 60 with a 4ms Gaussian pulse 2kHz off-resonance prior to excitation) weighting. Two protocols were used (i) for in vivo / in situ MRI, and (ii) for ex vivo MRI. Each had a TR of 30ms and echoes were acquired with 1.26ms echo-spacing from TE = 2ms to TE = 13.34ms (MTw, 10 echoes) or 18.6ms (PDw and T1w, 14 echoes). Protocol (i) had a resolution of 0.3 mm isotropic and a total scan time of about 18 min, whereas protocol (ii) had a resolution of 0.17 mm isotropic and a total scan time of about 50 min, and was acquired with 4 repetitions. Processing: Quantitative maps of MT, T1, T2*, as well as MTR maps and effective proton density (the latter is not used here) (6,9,10,12) were calculated using in-house software in Matlab. To define regions-of-interests within WM and GM (Figs. 2-5), we segmented the MT maps at each time point using SPM Mouse (13) and SPM12. The in vivo qMRI data are not used for figure 2-5 because of severe physiological artefacts (see Fig. 1).Results and Discussion
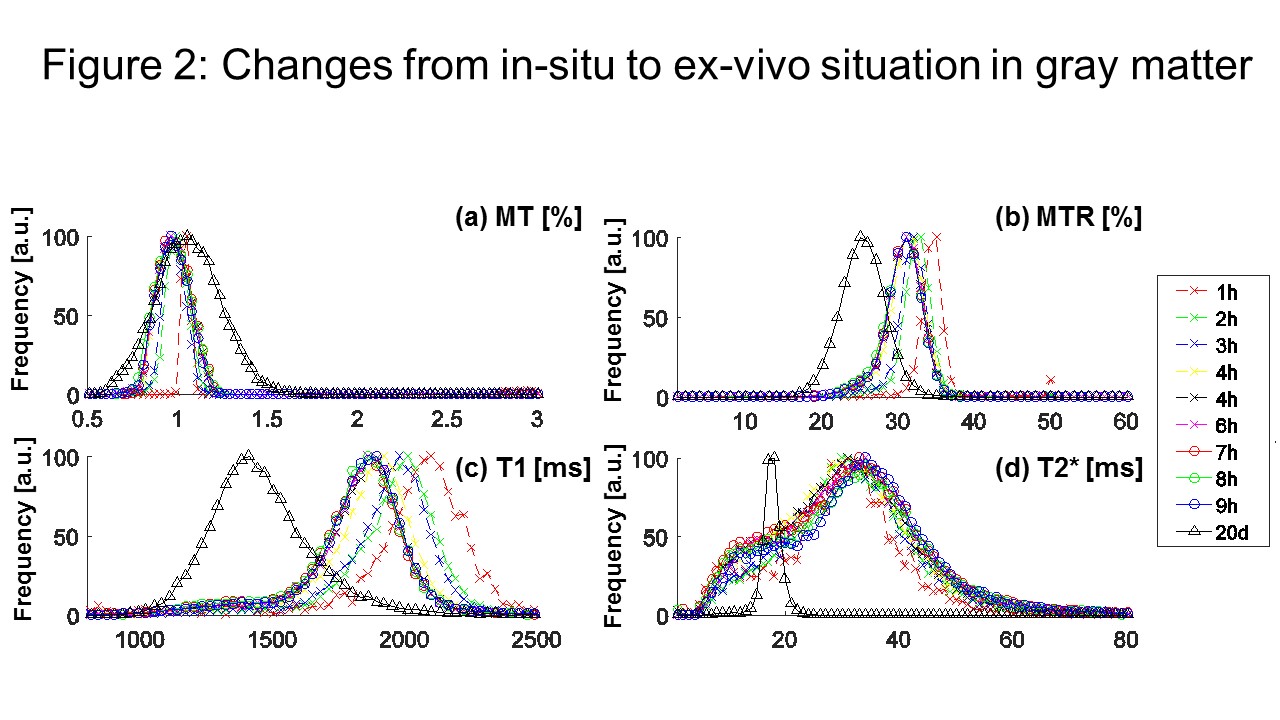
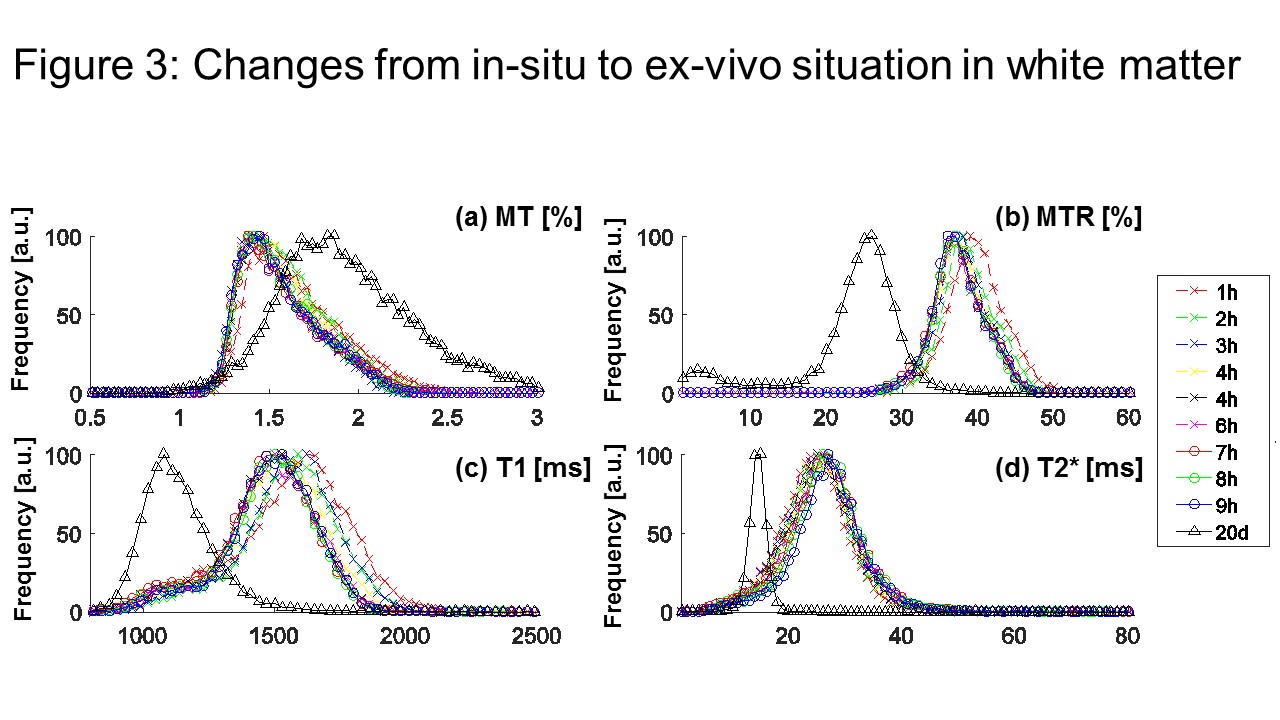
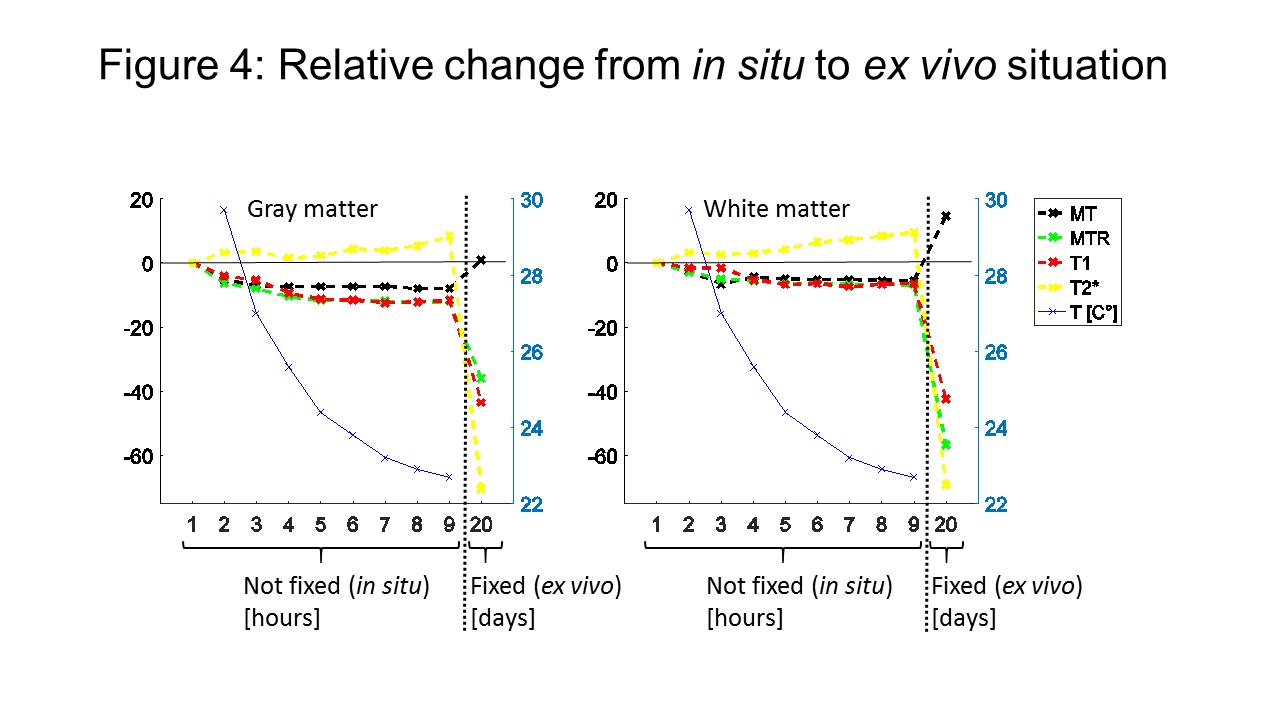
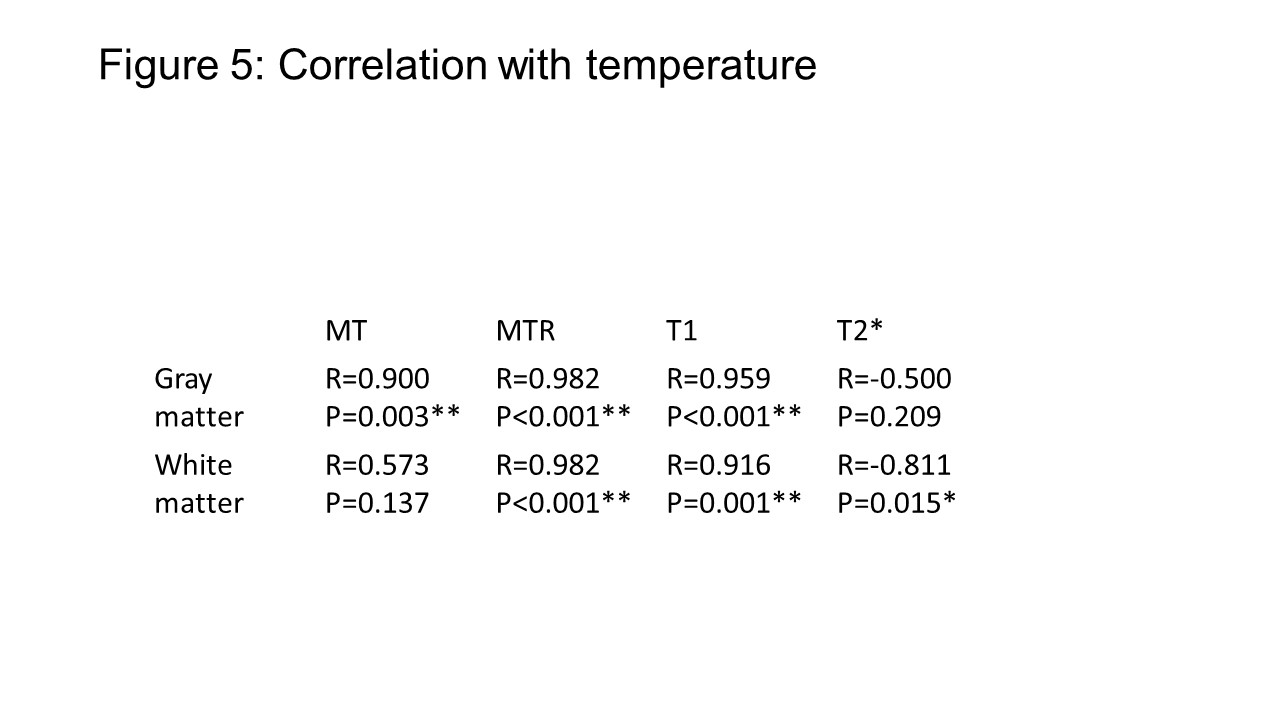
Our most important result was that MT was increased after fixation (Fig. 2,3,4) (as opposed to all other qMRI parameters). MT is independent of underlying T1 and thus behaved similar to the more quantitative but time-consuming z-spectrum magnetization-transfer imaging (qMT, (14)) – a more established myelin marker (15), supporting previous findings that MT saturation is a good proxy for qMT (8). In situ, MT (and T2*) decreased (increased) with increasing PMI and decreasing temperature but greatly increased (decreased) upon fixation. T2* (GM and WM) and MT (WM) showed less strong correlation to temperature effects than MTR and T1 (Fig. 5), indicating temperature changes and autolysis processes are differently affecting these metrics. While the observed temperature-dependence of T1 agrees to a recent experiment (5), the observed increase in T2* with decreasing temperature contradicts their findings. This difference between Birkl’s and our study might be caused by the varying environmental influence ex vivo and in situ.Conclusion
The fact that fixation effects in MT are similar to reported changes in the myelin-marker obtained from quantitative z-spectrum magnetization-transfer imaging (14,15), is an indication that MT is an equally sensitive but more efficient biomarker and thus. should be more widely used.Acknowledgements
This work has been supported by a University Medical Center Hamburg-Eppendorf FFMPostdoctoral Fellowship to IE and a Marie Sklodowska-Curie Individual FellowshipMSCA-IF-2015 (EU Horizon 2020) to SM.References
(1) Stikov N, Campbell JSW, Stroh T, Lavelée M, Frey S, Novek J, Nuara S, Ho M-K, Bedell BJ, Dougherty RF, Leppert IR, Boudreau M, Narayanan S, Duval T, Cohen-Adad J, Picard P-A, Gasecka A, Côté D, Pike GB. In Vivo Histology of the Myelin G-Ratio with Magnetic Resonance Imaging. NeuroImage 2015;118:397–405.
(2) Stikov N, Campbell JSW, Stroh T, Lavelée M, Frey S, Novek J, Nuara S, Ho M-K, Bedell BJ, Dougherty RF, Leppert IR, Boudreau M, Narayanan S, Duval T, Cohen-Adad J, Picard P-A, Gasecka A, Côté D, Pike GB. Quantitative Analysis of the Myelin G-Ratio from Electron Microscopy Images of the Macaque Corpus Callosum. Data Brief 2015;4:368–373.
(3) Shepherd TM, Flint JJ, Thelwall PE, Stanisz GJ, Mareci TH, Yachnis AT, Blackband SJ. Postmortem Interval Alters the Water Relaxation and Diffusion Properties of Rat Nervous Tissue--Implications for MRI Studies of Human Autopsy Samples. NeuroImage 2009;44:820–826.
(4) Schmierer K, Wheeler-Kingshott CAM, Tozer DJ, Boulby PA, Parkes HG, Yousry TA, Scaravilli F, Barker GJ, Tofts PS, Miller DH. Quantitative Magnetic Resonance of Postmortem Multiple Sclerosis Brain before and after Fixation. Magn. Reson. Med. 2008;59:268–277.
(5) Birkl C, Langkammer C, Golob-Schwarzl N, Leoni M, Haybaeck J, Goessler W, Fazekas F, Ropele S. Effects of Formalin Fixation and Temperature on MR Relaxation Times in the Human Brain. NMR Biomed. 2016;29:458–465.
(6) Helms G, Dathe H, Kallenberg K, Dechent P. High-Resolution Maps of Magnetization Transfer with Inherent Correction for RF Inhomogeneity and T1 Relaxation Obtained from 3D FLASH MRI. Magn. Reson. Med. 2008;60:1396–1407.
(7) Mohammadi S, Carey D, Dick F, Diedrichsen J, Sereno MI, Reisert M, Callaghan MF, Weiskopf N. Whole-Brain In-Vivo Measurements of the Axonal G-Ratio in a Group of 37 Healthy Volunteers. Front. Neurosci. 2015;9:441.
(8) Campbell J, Leppert I, Boudreau M, Narayanan S, Duval T, Cohen-Adad J, Pike GB, STikov N. inProc Intl Soc Mag Reson Med 24 2016 Abstr. 1501,2016.
(9) Helms G, Dathe H, Dechent P. Quantitative FLASH MRI at 3T Using a Rational Approximation of the Ernst Equation. Magn. Reson. Med. 2008;59:667–672.
(10) Weiskopf N, Suckling J, Williams G, Correia MM, Inkster B, Tait R, Ooi C, Bullmore ET, Lutti A. Quantitative Multi-Parameter Mapping of R1, PD*, MT and R2* at 3T: A Multi-Center Validation. Front. Brain Imaging Methods 2013;7:95.
(11) Tofts P. Quantitative MRI of the Brain: Measuring Changes Caused by DiseaseJohn Wiley & Sons2004. p 650.
(12) Weiskopf N, Callaghan MF, Josephs O, Lutti A, Mohammadi S. Estimating the Apparent Transverse Relaxation Time (R2*) from Images with Different Contrasts (ESTATICS) Reduces Motion Artifacts. Front. Neurosci. 2014;8:1–10.
(13) Sawiak SJ, Wood NI, Williams GB, Morton AJ, Carpenter TA. Voxel-Based Morphometry in the R6/2 Transgenic Mouse Reveals Differences between Genotypes Not Seen with Manual 2D Morphometry. Neurobiol. Dis. 2009;33:20–27.
(14) Schmierer K, Thavarajah JR, An SF, Brandner S, Miller DH, Tozer DJ. Effects of Formalin Fixation on Magnetic Resonance Indices in Multiple Sclerosis Cortical Gray Matter. J. Magn. Reson. Imaging JMRI 2010;32:1054–1060.
(15) Tozer DJ, Davies GR, Altmann DR, Miller DH, Tofts PS. Correlation of Apparent Myelin Measures Obtained in Multiple Sclerosis Patients and Controls from Magnetization Transfer and Multicompartmental T2 Analysis. Magn. Reson. Med. 2005;53:1415–1422.
Figures