3762
Combining multi gradient echo acquisitions with inversion recovery: estimating the residence time of myelin water from transient MT effects.1Advanced MRI, LFMI, NINDS NIH HHS, Bethesda, MD, United States
Synopsis
Combining multi-gradient-echo (MGRE) acquisitions with inversion/saturation preparation pulses allows for separation of white matter signal in several water compartments and estimation of both their T1 and exchange properties. A model of multiple myelin, myelin water and axonal/interstitial water compartments was implemented, including exchange from and across individual lipid bi-layers. Fitting this model to the inversion prepared MGRE-data resulted in T1's and exchange rates for all compartments. The results from a corpus-callosum region of interest indicate that the single layer myelin water residence time is a few hundred microseconds, while the average residence time of all myelin water combined is around 15ms.
Introduction
Multi-gradient echo (MGRE-) images can be used to separate signals from myelin water (MW), axonal- and interstitial water, based on their different T$$$_2^*$$$-relaxation [1]. Inversion or saturation pre-pulses can create different Mz-states in different compartments, the evolution of which can be assessed with MGRE-acquisitions at various delay times. This results in information on T1 for these compartments and their exchange [2,3], both with each other and with 1H-protons in lipids and proteins making up the myelin solids (MS). A multi-compartment model including alternating layers of MS and MW was fitted to MGRE-data with various preparation pulses to derive relaxation and exchange parameters, which are important for understanding T1 and magnetization transfer (MT) contrasts in the brain.Methods
Four types of MGRE scans were used: I) reference without Mz preparation, II) inversion-recovery (IR), III) double inversion (DI) preparation to saturate the MS to obtain MT data, IV) double inversion with delay between pulses (DS), timed to suppress most of non-myelin water signal.
Ten subjects were scanned on a Siemens 7T. Five slices were acquired, each at five delay times (Table 1). Acquisition parameters: 90x60 voxels, 240x160mm2 FOV, 2mm slice thickness (3.4mm gap), 90' flip-angle, 3s TR for scan types I-III, 1.5s for type IV, 80 echoes spaced at 0.53ms and starting at 2.16ms, 10ms hyperbolic-secant inversion pulse at 750Hz maximum B1.
Step 1: Corpus-callosum-ROI-averaged MGRE data were fitted to a 3 component model [1]. The $$$R_2^*$$$'s and frequencies were determined from the reference data, after fixing these, all data were fitted for the 3 component amplitudes. The amplitudes for scans II-IV were normalized by dividing with the reference amplitudes, then the axonal and interstitial amplitudes were combined. The averages and standard errors (SE) over the subjects were determined.
Step 2: A multi-compartment exchange model (Fig.1) was used to fit the results from step 1. The model included $$$2N$$$ MS and MW layers, the combined axonal and interstitial water (other water, OW), exchange between every MS and neighboring water compartment ($$$x_{ws}$$$ spins exchanging per unit time), and exchange across myelin layers ($$$x_{ww}$$$). The evolution of Mz in compartment MWi becomes:
$$\frac{dM_{z,mw,i}}{dt}=R_{1,mw}(1-M_{z,mw,i})-(2k_{mw}+k_{ml})M_{z,mw,i}+k_{mw}(M_{z,mw,i+1}+M_{z,mw,i-1})+k_{ml}M_{z,sp,i}$$
where $$$R_{1,mw}$$$ is the longitudinal relaxation rate, $$$k_{mw}$$$ the exchange rate for MW with neighboring MW, given by the ratio of the magnetization flow $$$x_{ww}$$$ and the MW compartment size ($$$N_{mw}$$$), and likewise $$$k_{ms}$$$ the exchange rate between MW and MS. In a similar manner, equations of the other compartments and the transverse magnetization were formulated. Finally, rotations were added to describe the effects of $$$B_0$$$ and $$$B_1$$$ fields.
This set of coupled differential equations was numerically solved to simulate the experiments, the simulation was repeated with different parameter values to fit the model to the results of step 1. The simulations included the effects of all RF pulses and slice profile effects. The model had 15 parameters: the $$$R_1, R_2^*$$$, size and frequency for the three pools, the two exchange amplitudes and the number of myelin layers. $$$R_{1,ms}$$$ and $$$R_{1,mw}$$$ could not be distinguished and were assumed identical, the $$$R_{2,mw}^*$$$, $$$R_{2,ow}^*$$$, the MW and OW frequencies and the ratio of MW and OW size were taken from the three component fitting of the reference MGRE data, the $$$R_{2,ms}^*$$$ and MS frequency were taken from a MT spectrum measurement [4], the total of the pool-sizes was set to one, $$$N$$$ was set to either 5,9,12 or 15, leaving 5 parameters free to be fitted.
Exchange induced decay times (Tex) were calculated as the time in which the difference of Mz in each compartment with its equilibrium decayed by a factor 1/e, ignoring T1-relaxation.Results & Discussion
The results of step 1 are shown as bars in Fig. 2. The lines indicate the best fit of the multi-compartment model to these averages (for $$$N=9$$$). The resulting model parameters are given in Table 2, the fixed parameter values are reported in Table 3. The Tex of the average magnetization of all the MW was close to 15ms for all choices of $$$N$$$, substantially shorter than the 69ms estimated from the results in [3]. The Tex in a single MW compartment ranged from 200 to 500μs (depending on $$$N$$$), in line with previous (non-MR) studies on membrane permeability [5-8], and consistent with estimates based on multi-exponential T2 measurements in rat spinal cord [9]. The Tex of MS was found to be 97ms, while the Tex for OW was 112ms. On the T1 timescale all pools appear well mixed, and the combined relaxation is dominated by the shorter MS pool, in line with [10-12].Acknowledgements
This research was supported (in part) by the Intramural Research Program of the NIH, NINDS.References
[1] Li X, van Gelderen P, Sati P, de Zwart JA, Reich DS, Duyn JH. Detection of demyelination in multiple sclerosis by analysis of T2 relaxation at 7 T. NeuroImage Clinical 2015;7:709-714.
[2] Gochberg DF, Gore JC. Quantitative imaging of magnetization transfer using an inversion recovery sequence. Magn. Reson. Med. 2003;49:501-505.
[3] Kalantari S, Laule C, Bjarnason TA, Vavasour IM, MacKay AL. Insight into in vivo magnetization exchange in human white matter regions. Magn. Reson. Med. 2011;66:1142-1151.
[4] Jiang X, van Gelderen P, Duyn JH. Measurement of the resonance frequency of macro-molecular protons in brain. ISMRM 2016, 1502.
[5] Franks NP, Lieb WR. Rapid movement of molecules across membranes. Measurement of the permeability coefficient of water using neutron diffraction. J Mol Biol 1980;141:43-61.
[6] Conlon T, Outhred R. The temperature dependence of erythrocyte water diffusion permeability. Biochimica et biophysica acta 1978;511:408-418.
[7] Cass A, Finkelstein A. Water Permeability of Thin Lipid Membranes. J Gen Physiol 1967;50:1765-1783.
[8] Finkelstein A. Water and nonelectrolyte permeability of lipid bilayer membranes. J Gen Physiol 1976;68:127-135.
[9] Harkins KD, Dula AN, Does MD. Effect of intercompartmental water exchange on the apparent myelin water fraction in multiexponential T2 measurements of rat spinal cord. Magn. Reson. Med. 2012; 67: 793-800.
[10] Koenig SH, Brown RD, 3rd, Spiller M, Lundbom N. Relaxometry of brain: why white matter appears bright in MRI. Magn. Reson. Med. 1990;14:482-495.
[11] Fatouros PP, Marmarou A. Use of magnetic resonance imaging for in vivo measurements of water content in human brain: method and normal values. Journal of neurosurgery 1999;90:109-115.
[12] Rooney WD, Johnson G, Li X, Cohen ER, Kim SG, Ugurbil K, Springer CS, Jr. Magnetic field and tissue dependencies of human brain longitudinal 1H2O relaxation in vivo. Magn. Reson. Med. 2007;57:308-318.
Figures
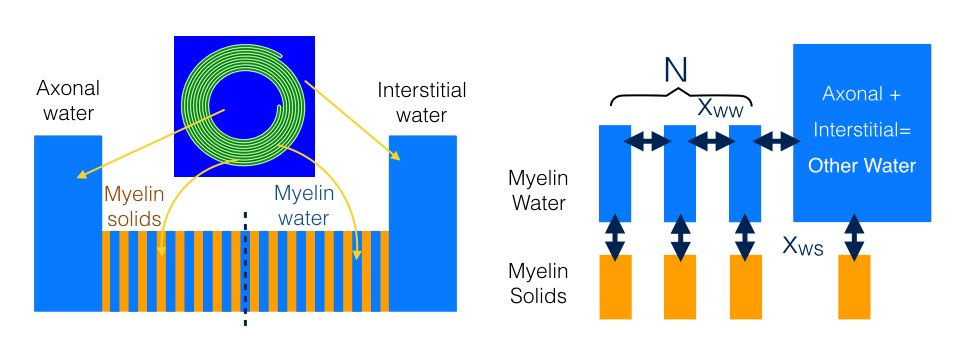
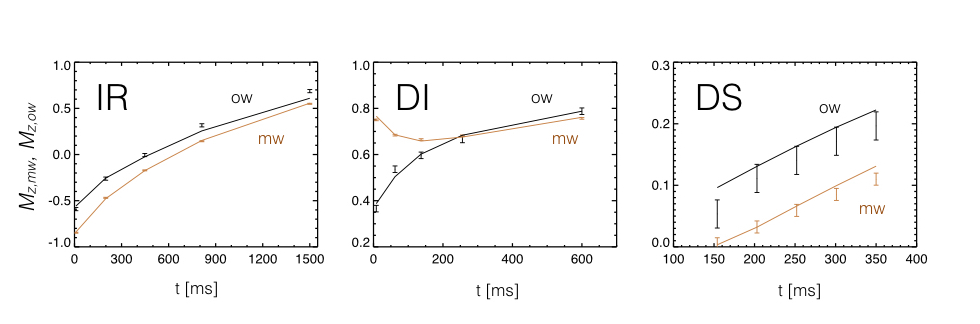
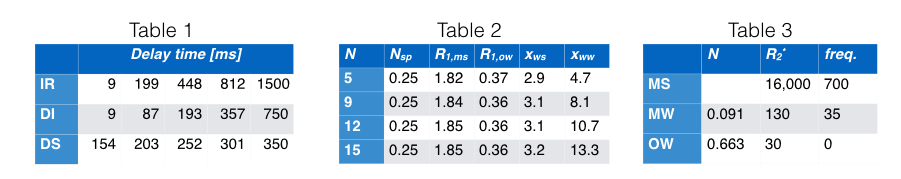
Table 1. Applied delay times from preparation pulse(s) to excitation, for scan II-IV).
Table 2. Fitting results of the multi-compartment model for four choices of N, all rates are in 1/s.
Table 3. Values of fixed parameters used in the multi-compartment model, rates and frequencies are in 1/s.