3761
Assessment of Lipid Order in Model Myelin Membrane Systems with MT and ihMT1Radiology, University of Michigan, Ann Arbor, MI, United States, 2Radiology, Vanderbilt University, Nashville, TN
Synopsis
We report here a study of MT and enhanced MT (eMT), using dual-sided RF saturation, in model membrane system to measure lipid dynamics and structure in systems of known lipid order. The eMT signal generated by dual-sided RF saturation of phospholipid vesicles is well described by Gaussian line shape and T2b is easily determined. T2b of the lipids is related to the lipid order with T2b(liquid disorder) > T2b(liquid order) > T2b(solid order). These tools provide a method to estimate lipid order in vivo.
Introduction
Lipids in eukaryotic membranes can be classified into three dynamic and structural domains (1): solid order (so) with slow lipid diffusion and high molecular order, liquid disorder (ld) with fast diffusion and low order, or liquid order (lo) with fast diffusion and high order. Due to the biological importance of lipid-lipid interactions, numerous physical methods, including fluorescence, EPR, calorimetry, and solid state NMR, are used to assess the lipids in vitro (2-4). MT studies of lipids point to cholesterol and cerebrosides as conduits of proton magnetization between water and lipid (5). Moreover MT and ihMT MRI have the ability to investigate the state of biological membranes in vivo (6-8). We report here a study of MT and enhanced MT, with dual-sided RF saturation, in model membrane system to measure lipid dynamics and structure in systems of known lipid order and begin to understand how these tools may be used to assess lipid order in vivo.Methods
1-palmitoyl-2-oleoyl-sn-glycero-3-phosphocholine (POPC, transition temperature, Tm = -2 °C) and brain sphingomyelin (BSM, Tm = 37 °C) were prepared in multilamellar vesicles (MLV) as previously described (8). Samples of each lipid were constructed with 0% and 50% cholesterol in a 1:1 H20/D20 aqueous environment.
Lipids were studied at 11.7 T (500 MHz). MT and eMT experiments were performed using a train of 1000, 5 ms, Gaussian RF pulses of constant (MT) or alternating (eMT) off-resonant frequencies and a B1 field of 10 $$$\mu$$$T (7,8). MT and eMT of each sample was measured from -50 to 50 kHz in 2 kHz increments and at 10, 25, 37 and 50 °C. Lipid proton T1d was measured with a Jeener-Broekert sequence (8).
eMT profiles were fitted to a steady-state solution of the Provotorov equations for dual-frequency RF saturation (7-10), $$$eMT = 100/\left[1+a\times g(\Delta)\right]$$$ where $$$g(\Delta)=exp(-2\pi^2\Delta^2 T_{2b}^2)$$$ and $$$a=a(\omega_1,r,r_a,r_b,M^0_b,T_{2a})$$$, all MT parameters except T2b. MT and eMT signals resulting from direct saturation of the water resonance from +4 to -4 kHz were discarded to simplify analysis.
Results
Figure 1 (d,e,f) demonstrates that a Gaussian line shape provides an excellent fit to eMT saturation profiles of all lipids. Examination of single-sided MT saturation profiles shows super-Lorentzian behavior (Fig. 1 a,b,c), but can be also explained as a Gaussian line shape coupled by single-sided RF saturation to a reservoir of dipolar order (7-10). Pure POPC was also studied but found to have no MT signal, likely due to lack of exchangeable protons.
Figure 2 shows that T2b of POPC-Chol and BSM-Chol increase gradually with increasing temperature. These membranes are known to be in the lo phase and hence no phase transition is expected nor seen in the MT or eMT data. In addition, T2b of BSM-Chol is less that POPC-Chol, likely due to the different phase transition temperatures of the lipids.
Pure BSM at 25 °C is known to be in the so phase and we find T2b to be the shortest measured here (Fig. 1f and Fig. 2). In addition, ihMTR is zero for BSM at 25 °C, indicating fast spin diffusion correlated with short proton T1d. As temperature increases, BSM undergoes a phase transition from so to ld phase and an increase in T2b from 8.3 to 23.1 $$$\mu$$$s (Fig. 2). In addition ihMTR (the difference between MT and eMT) increases. MT and eMT of BSM are reduced compared to BSM-Chol, consistent with previous studies (5).
Finally, Fig. 3 shows that ihMT increases linearly with T1d, as expected from Provotorv theory (7-10). In addition, the frequency, shape, and amplitude of the ihMTR signal is a function of lipid order. POPC-Chol and BSM-Chol at 50 °C have significant ihMT signals as does BSM at 50 °C. However, the maximum ihMT signal for the lipid-cholesterol (lo) occurs at 12kHz off-resonance whereas the maximum ihMT signal for pure BSM at 50 °C (ld) occurs at 8 kHz.
Conclusions
The eMT signal generated by dual-sided RF saturation of phospholipid vesicles is well described by Gaussian line shape for the lipids. These findings suggest that the eMT experiment using a Gaussian line shape for analysis may be appropriate for lipid MT studies. T2b of the lipids is related to the lipid order with T2b(ld) > T2b(lo) > T2b(so). ihMTR increases linearly with lipid proton T1d, with temperature, and is very small when lipid T2b is less than 12 $$$\mu$$$s. These studies show that MT, eMT and ihMT signals are sensitive to lipid order and provide tools to assess lipid order in vivo.Acknowledgements
Research reported in this study was supported by the National Institutes of Health under award numbers R01CA184693 and R01EB017767References
1. van Meer G, Voelker DR, Feigenson GW. Membrane lipids: where they are and how they behave. Nature Reviews Molecular Cell Biology 2008;9(2):112-124.
2. de Almeida RFM, Loura LMS, Fedorov A, Prieto M. Lipid rafts have different sizes depending on membrane composition: A time-resolved fluorescence resonance energy transfer study. Journal of Molecular Biology 2005;346(4):1109-1120.
3. Veatch SL, Keller SL. Miscibility phase diagrams of giant vesicles containing sphingomyelin. Physical Review Letters 2005;94(14).
4. Filippov A, Oradd G, Lindblom G. The effect of cholesterol on the lateral diffusion of phospholipids in oriented bilayers. Biophysical Journal 2003;84(5):3079-3086.
5. Kucharczyk W, Macdonald PM, Stanisz GJ, Henkelman RM. Relaxivity and Magnetization-Transfer of White-Matter Lipids at Mr-Imaging - Importance of Cerebrosides and pH. Radiology 1994;192(2):521-529.
6. Varma G, Duhamel G, de Bazelaire C, Alsop DC. Magnetization Transfer from Inhomogeneously Broadened Lines: A Potential Marker for Myelin. Magnetic Resonance in Medicine 2015;73(2):614-622.
7. Varma G, Girard OM, Prevost VH, Grant AK, Duhamel G, Alsop DC. Interpretation of magnetization transfer from inhomogeneously broadened lines (ihMT) in tissues as a dipolar order effect within motion restricted molecules. Journal of Magnetic Resonance 2015;260:67-76.
8. Swanson SD, Malyarenko DI, Fabiilli ML, Welsh RC, Nielsen J-F, Srinivasan A. - Molecular, dynamic, and structural origin of inhomogeneous magnetization transfer in lipid membranes. 2016 in press.
9. Lee J-S, Khitrin AK, Regatte RR, Jerschow A. Uniform saturation of a strongly coupled spin system by two-frequency irradiation. Journal of Chemical Physics 2011;134(23).
10. Lee J-S, Regatte RR, Jerschow A. Isolating chemical exchange saturation transfer contrast from magnetization transfer asymmetry under two-frequency rf irradiation. Journal of Magnetic Resonance 2012;215:56-63.
Figures
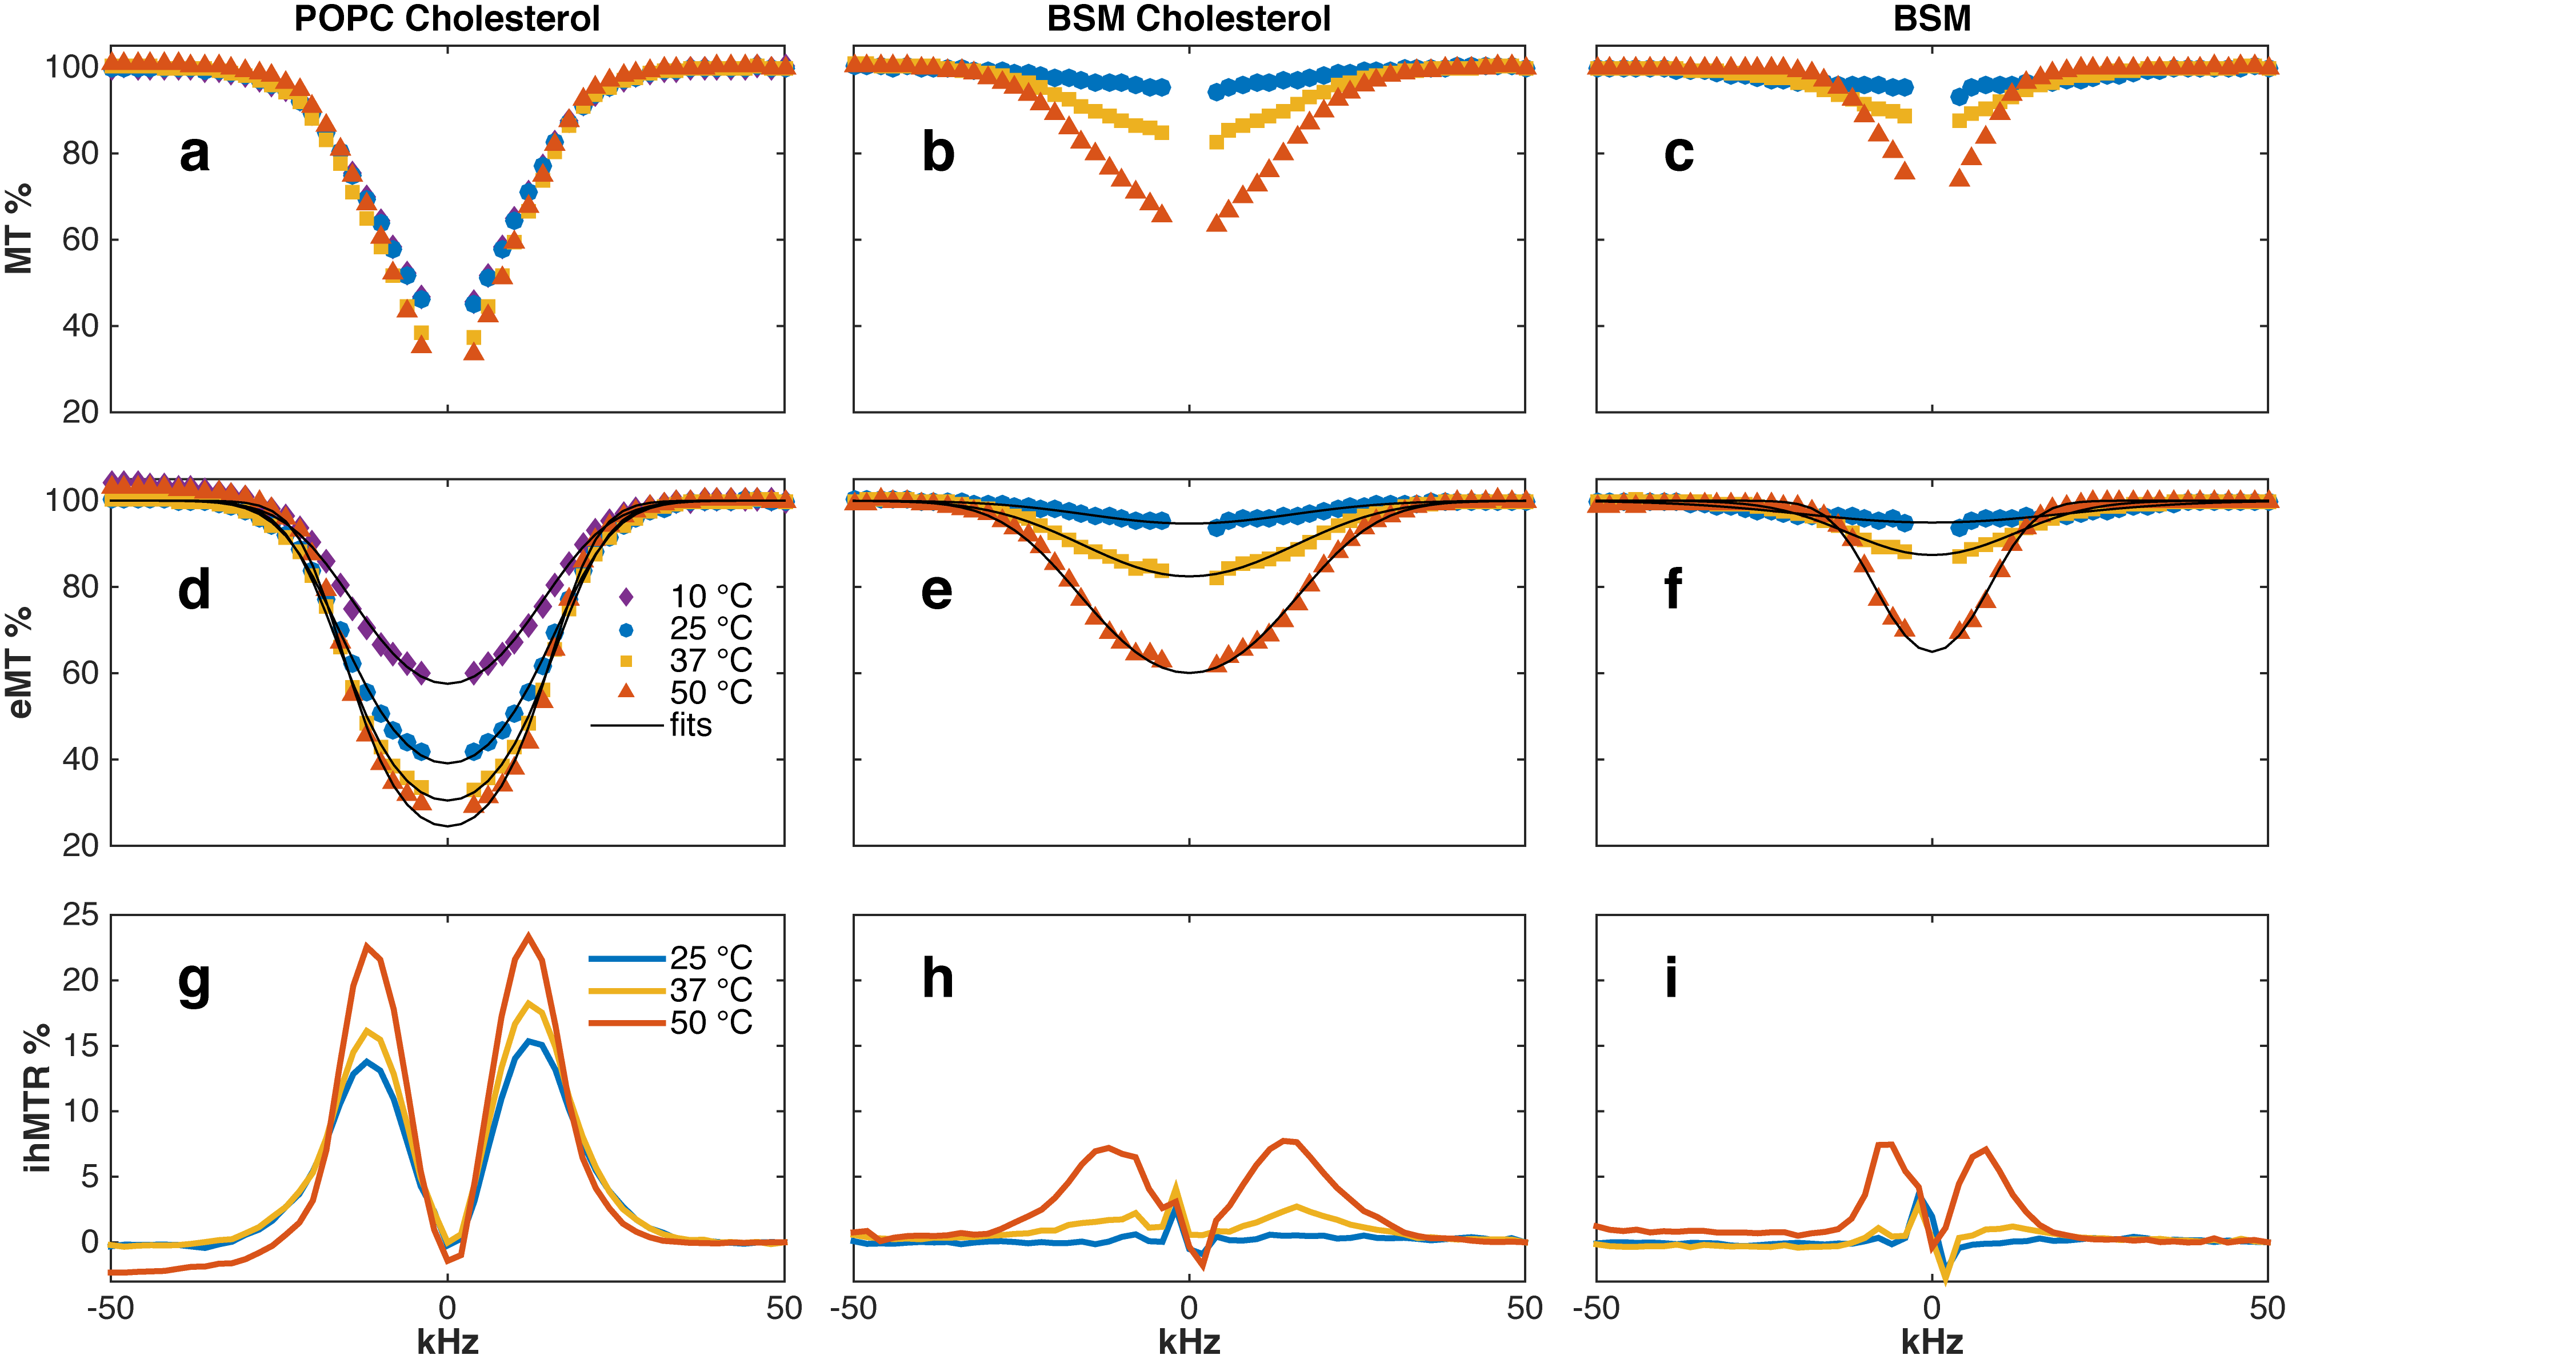
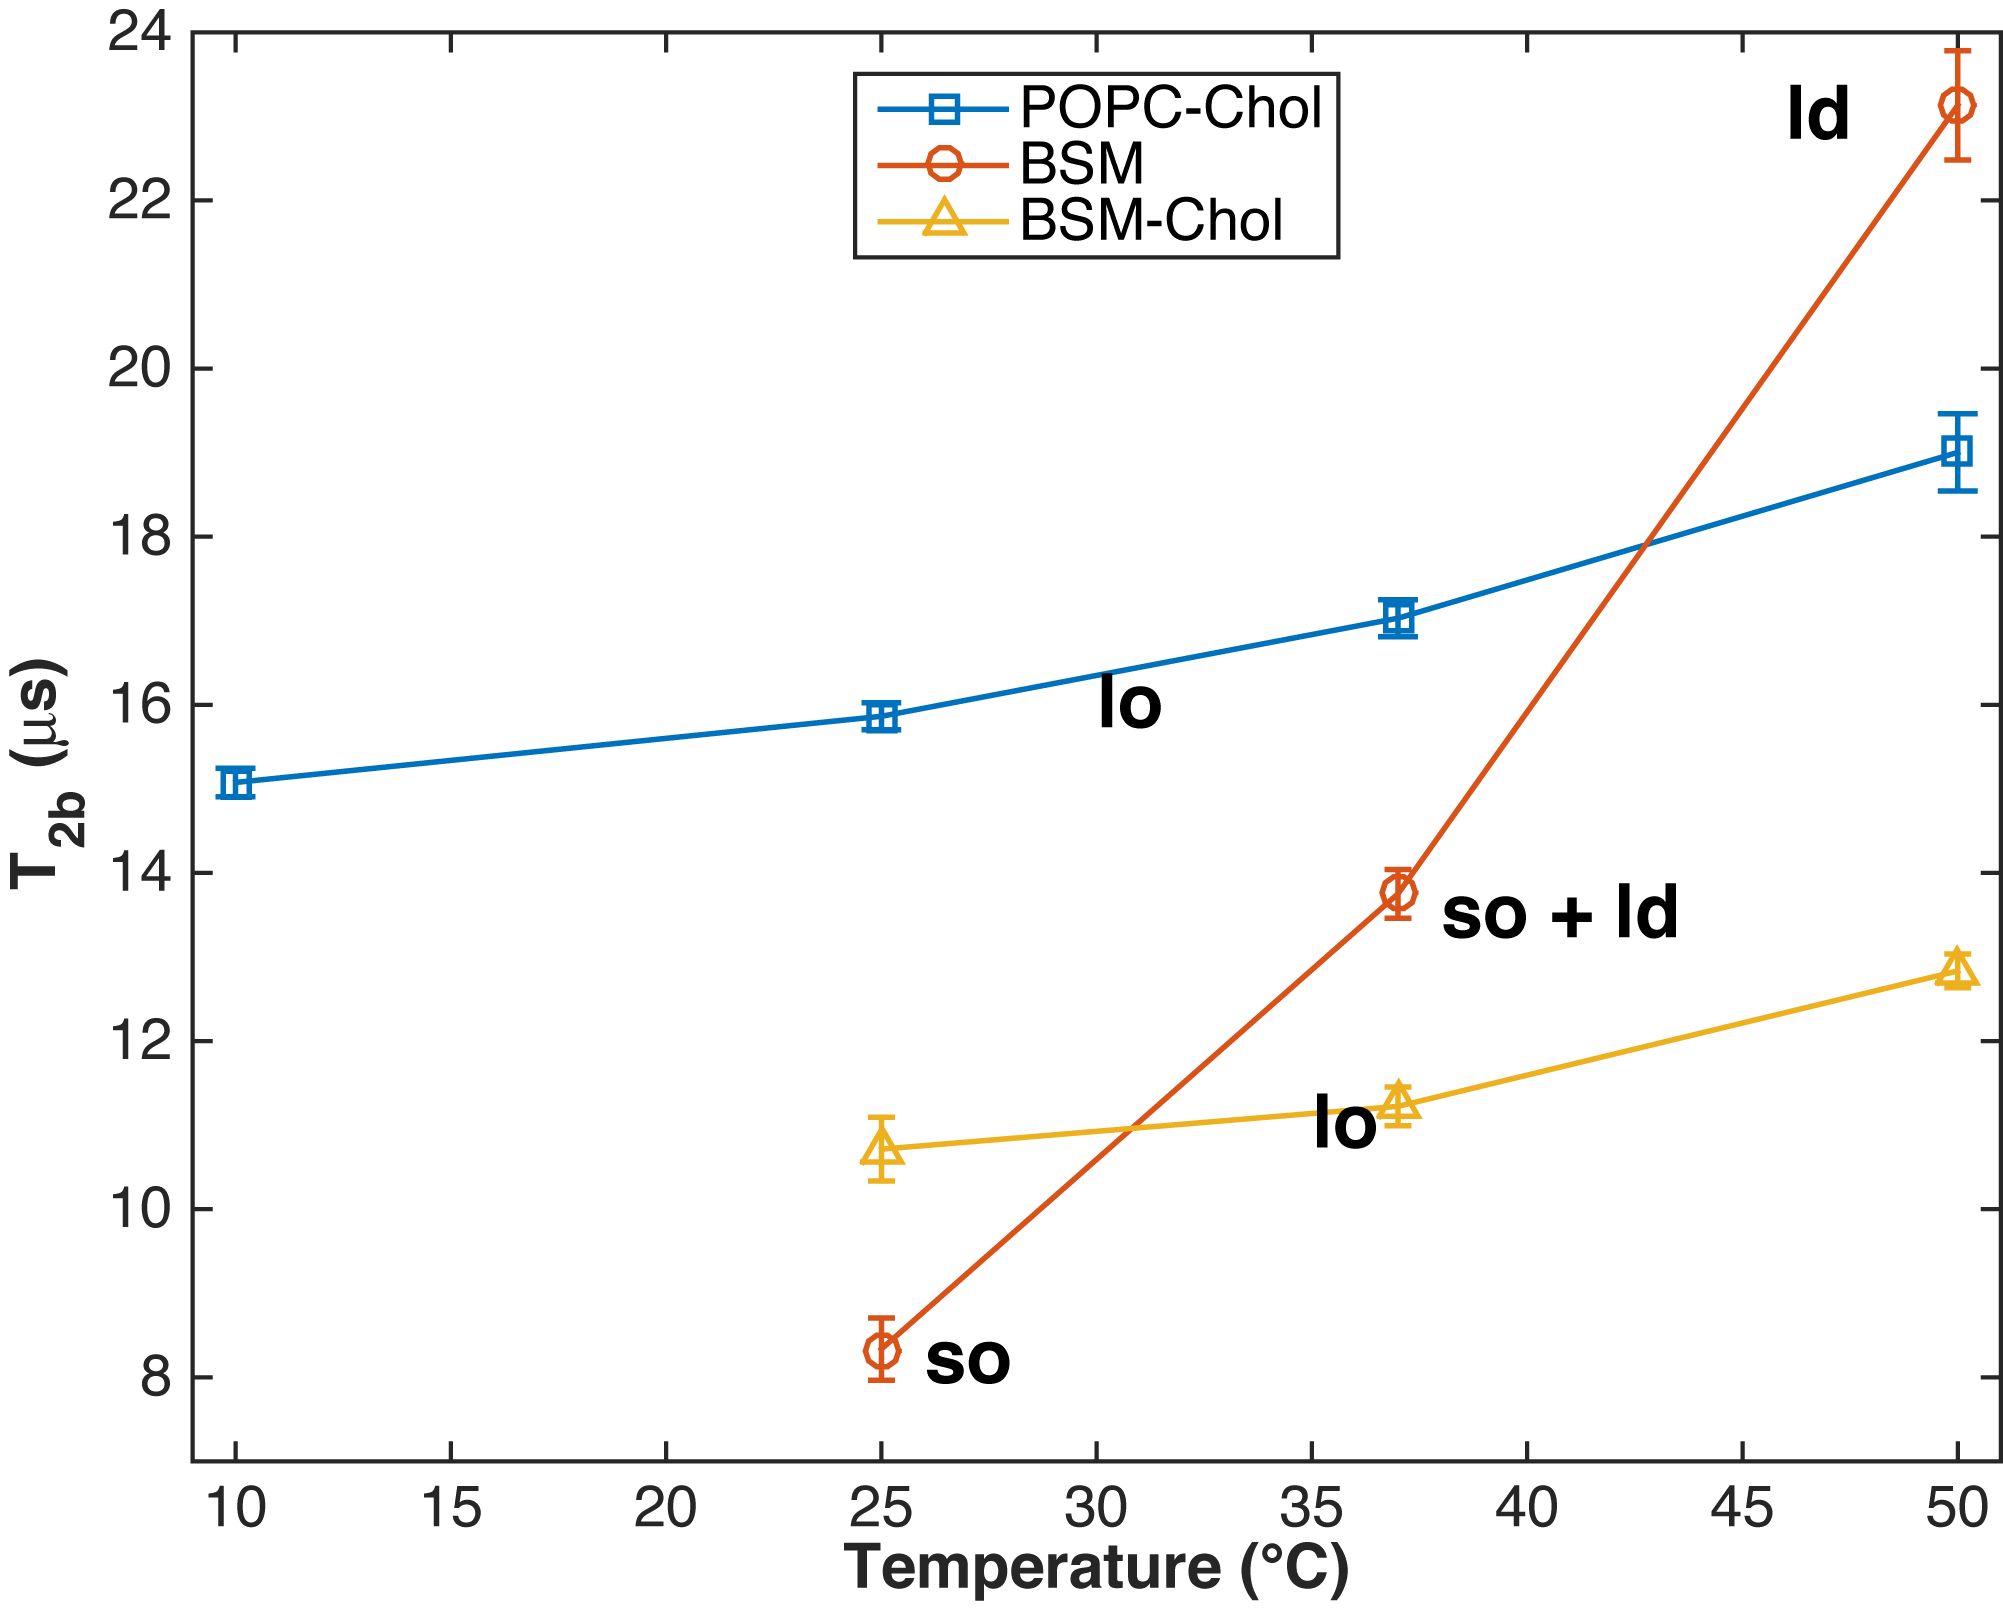

Figure 3. ihMTR of water protons as a function of lipid proton T1d. As predicted by Provotorov theory outlined in (7-10), the amount of ihMTR generated in water is proportional to the lipid proton T1d ($$$\rho$$$ = 0.95, p=3x10⁻⁴). Temperature is increasing in each lipid sub-plot from left (25 °C) to right (50 °C)